Week 7 State of charge estimation
1.Simulate the 3 test cases from harness dashboard and write a detailed report on the results?
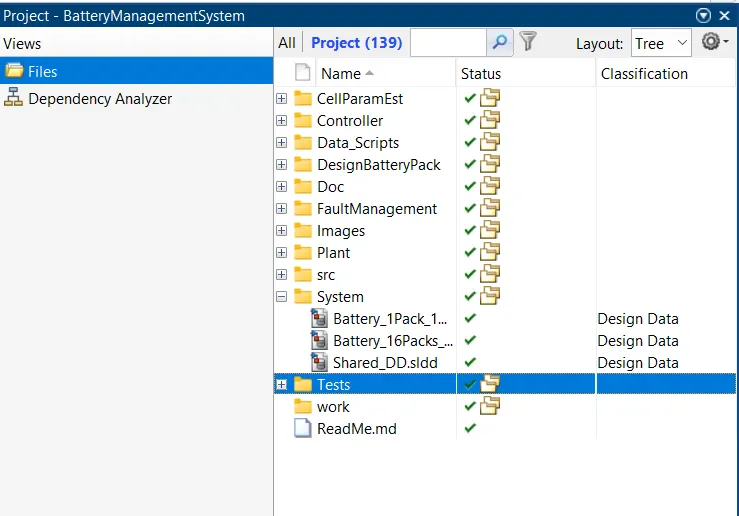
we are going to begin the test case by opening the MATLAB and downloadable content from the reference documentation project which skill-Lync has provided.
Below shows how the steps are involved in the setup of the ECU block with the battery management system. This the beginning of the setup where we set up the Matlab and open project
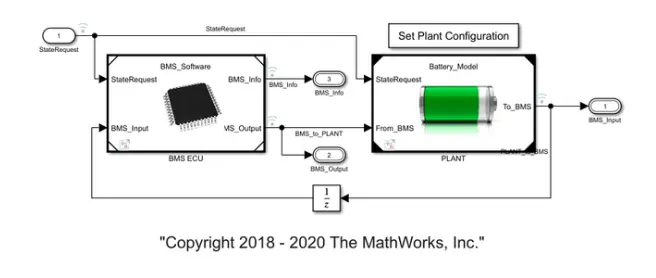
this is what ECU looks like in the BMS subsystem of the project. This is where we are to understand how the battery performance works
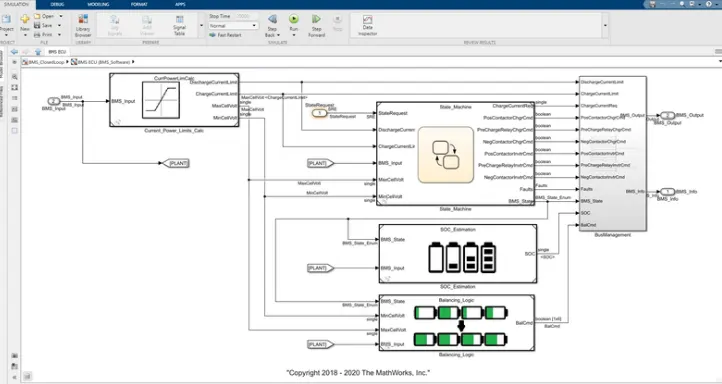
and if we look inside the subsystems of ECU we are going to see a flowchart of commands that governs the flow of processes within the BMS.
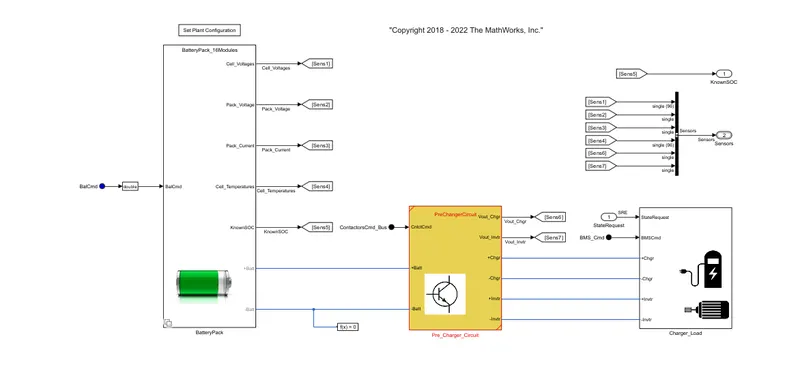
Below is the base setup and interior block of PLANT block where the simulation is running with electrical output within the systems
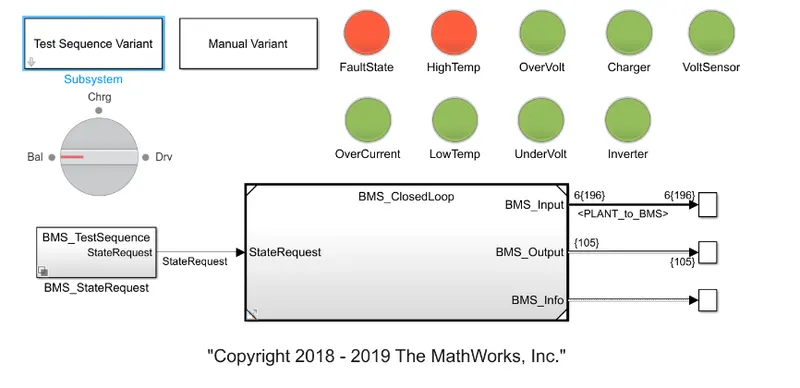
now we are going to get the harness dashboard from the project Matlab window and export the model. which we can see in the first picture of this report
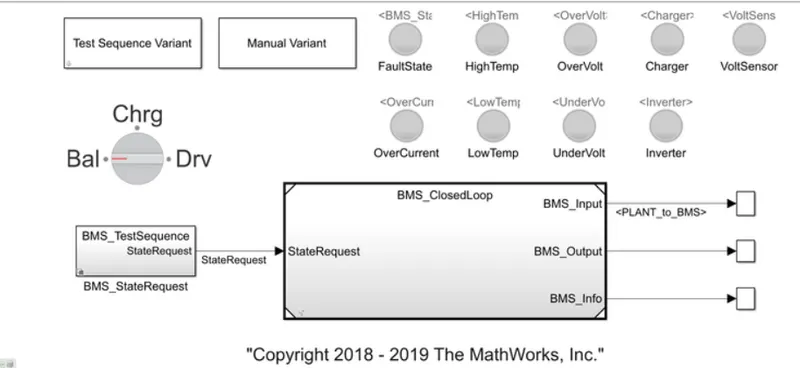
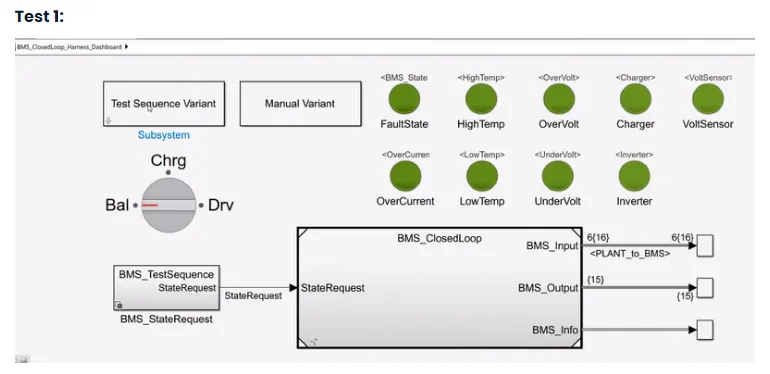
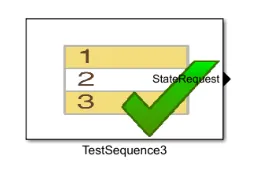
it consisted of 3 cases where when green light indicates the simulation is running smooth. The dashboard also helps in determining the fault states and other parameters. after running the simulation from 20000 secs we get the following output
this is where we get our 1st test results in to

like this we have to do for 3 tests and the simulation results will come in the manner
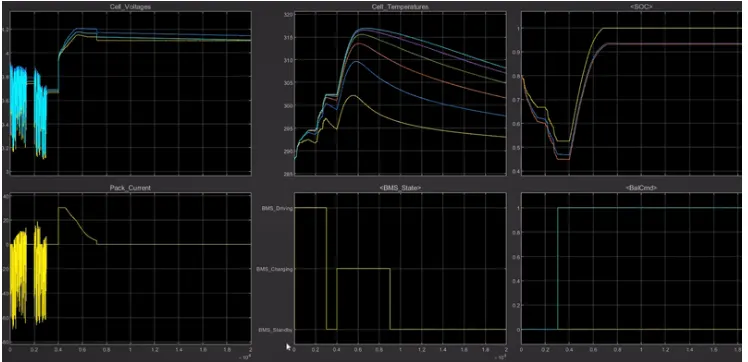
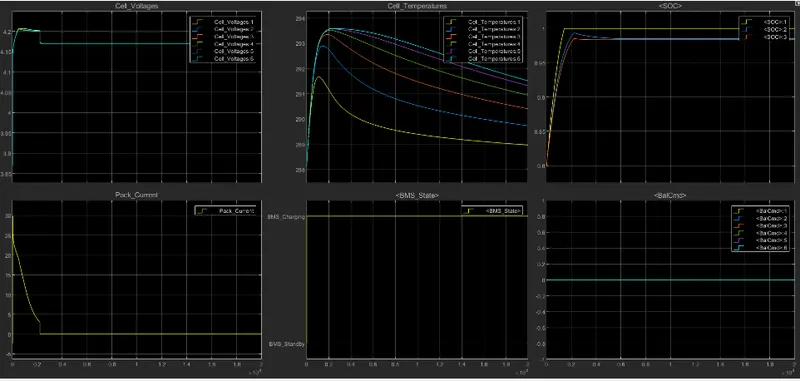
here we can observe the cell voltages cell temparatures soc (%) peak current & bms state
the scope results we can define note the following points.
• The input cycle can be seen in the BMS_State plot in which the vehicle initially undergoes driving, then charging till SOC = 90% and then later in standby state.
During Charging the Battery pack voltage is increased upto 4.2V.
• The cell temperature increases during the driving and charging cycle and starts falling off in standby mode.
• The SOC drops to less than 50% after the driving cycle and then later put into charging until SOC Reaches 100%
• The Current supplied to the EV during driving phase can be seen in the current plot.
second test case:
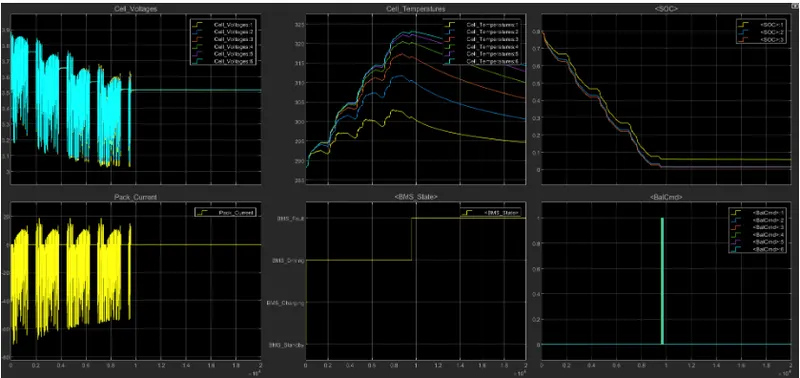
we will go for the second test case. For this we have to go to test case variant subsystem and select test case 2 from there and click on "Ok". Then we have to run the system for the given simulation time. The result shows that there is a fault condition in the vehicle. The dashboard on the model depicts the same with a red colour indication.
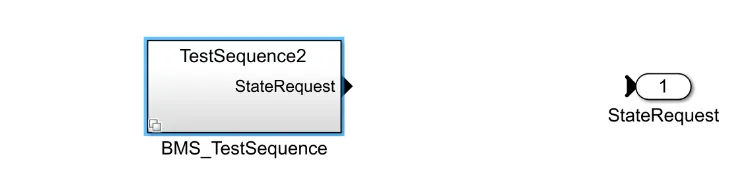
The scope shows the various parameters for the BMS model under second test case. After 10,000 sec when the driving cycle is over, the fault condition occurs and so the SOC does not increase even for the charging phase.
test3:
after applying for 3rd case we have too run the simulation
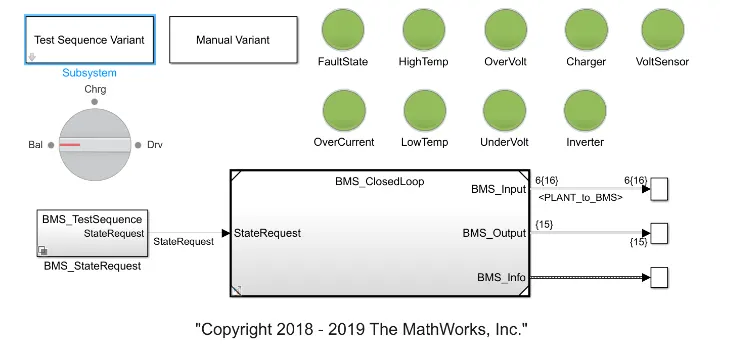
from this we didnt get any errors
for this particular conditon we seelected the case
2.What is coulomb counting? Refer to the above model and explain how BMS implements coulomb counting for SOC estimation.
To determine available capacity, coulomb counting relies on the integration of the current drawn from and supplied to a battery over time as given by
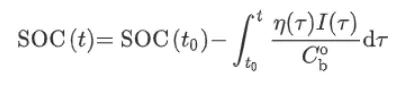
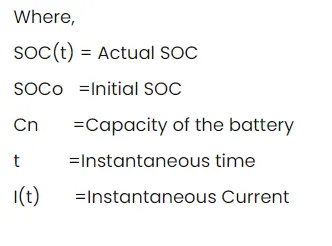
where I is the current and η is the efficiency during charge and discharge operations .Coulomb counting is advantageous in terms of a simple structure and its ease of implementation. However, some problems make it difficult to accurately estimate battery SOC by coulomb counting. Because battery capacity and efficiency are significantly influenced by operating temperature and current direction, these factors should be considered to correct for battery SOC. Sensor accuracy is also important because accumulated errors can lead to a drift in the estimated battery SOC. Furthermore, one of the main problems in coulomb counting is that it is necessary to calibrate the initial battery SOC. In several applications, the initialization involves rest and the initial SOC is estimated based on the voltage inversion method described next.
The “coulomb counting” or CoulCount method was developed by Schas a as heuristic method, although the underlying theory is reasonably accessible. It depends on the recording of the current noise only. The signal is filtered with a high-pass filter with a cut-off frequency of 0.01 Hz. The filter may be either analog (although the implementation of a good-quality 0.01 Hz analog filter is difficult) or digital. The absolute value of the measured current samples is then summed over time. A steep slope is taken as an indication of rapid corrosion, although it is not possible to calibrate this in terms of an estimated corrosion rate
The use of the integrating plot provides a form of low-pass filtering that may make it easier to see trends, but this can also be accomplished by digital filtering. The use of only the current noise restricts the value of the technique, as it does not allow for the estimation of the noise resistance (and hence the corrosion rate), and it is difficult to see what real advantages the method has over the conventional three-electrode method, although the use of integrating plots may be of value.
the flow chart for coloumb counting:
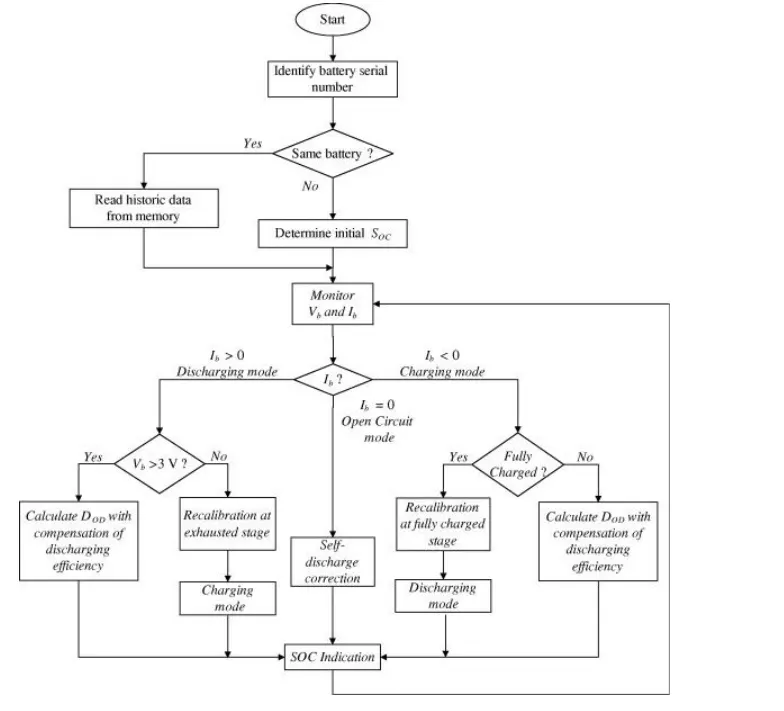
enhanced algorithim:
In order to overcome the shortcomings of the coulomb counting method and to improve its estimation accuracy, an enhanced coulomb counting algorithm has been proposed for estimating the SOC and SOH parameters of Li-ion batteries. The initial SOC is obtained from the loaded voltages (charging and discharging) or the open-circuit voltages. The losses are compensated by considering the charging and discharging efficiencies. With dynamic recalibration on the maximum releasable capacity of an operating battery, the SOH of the battery is evaluated at the same time. This in turn leads to a more precise SOC estimation.
Considering the expanding use of embedded devices equipped with rechargeable batteries, especially Li-ion batteries that have higher power and energy density, the battery management system is becoming increasingly important. In act, the estimation accuracy of the amount of the remaining charges is critical as it affects the device's operational autonomy. Therefore, the battery State-Of-Charge (SOC) is defined to indicate its estimated available charge. In this paper, a solution is proposed for Li-ion battery SOC estimation based on an enhanced Coulomb-counting algorithm to be implemented for multimedia applications. However, the Coulomb-counting algorithm suffers from cumulative errors due to the initial SOC and the errors of measurements uncertainties, therefore to overcome these limitations, we use the Open-Circuit Voltage (OCV), thus having a piecewise linear SOC-OCV relationship and performing periodic re-calibration of the battery capacity. This solution is implemented and validated on a hardware platform based on the PIC18F MCU family. The measured results are correlated with the theoretical ones; they have shown a reliable estimation since accuracy is less than 2%
note:
the models for the battery testing are taken from the MathWorks
references:
wiki
research gate
skill lync(videos)
google scholar