Week 7 State of charge estimation
AIM:
To study about state of charge estimation for a battery pack.
THEORY:
STATE OF CHARGE:
State of charge (SoC) is the level of charge of an electric battery relative to its capacity. The units of SoC are percentage points (0% = empty; 100% = full). An alternative form of the same measure is the depth of discharge (DoD), the inverse of SoC (100% = empty; 0% = full). SoC is normally used when discussing the current state of a battery in use, while DoD is most often seen when discussing the lifetime of the battery after repeated use.
In a battery electric vehicle (BEV), hybrid vehicle (HV), or plug-in hybrid electric vehicle (PHEV), SoC for the battery pack is the equivalent of a fuel gauge. It is important to mention that state of charge, presented as a gauge or percentual value at any vehicle dashboard, especially in plug-in hybrid vehicles, may not be representative for a real level of charge. In that particular case, some noticeable amount of energy stored in the electric battery is not shown at the dashboard, and it is reserved for hybrid-work operations. It permits a vehicle to accelerate with electric motor(s) mainly using battery energy, while engine serves as a generator is used to recharge the battery to the minimum level needed for such operation.
GOVERNING EQUATION:
In general, the SOC of a battery is defined as the ratio of its current capacity (`Q(t)`) to the nominal capacity (`Q_n`). The nominal capacity is given by the manufacturer and represents the maximum amount of charge that can be stored in the battery. The SOC can be defined as follows:
`SOC(t)=(Q(t))/(Q(n))`
Coulomb Counting Method:
The Coulomb counting method measures the discharging current of a battery and integrates the discharging current over time in order to estimate SOC. Coulomb counting method is done to estimate the `SOC(t)`, which is estimated from the discharging current,`I(t)` , and previously estimated SOC values, `SOC(t-1)` . SOC is calculated by the following equation:
`SOC(t)= SOC(t-1)+(I(t))/Q_n Delta(t)`
But there are several factors that affect the accuracy of Coulomb counting method including temperature, battery history, discharge current, and cycle life .
Modified Coulomb Counting Method:
To improve the Coulomb counting method, a new technique called modified Coulomb counting method is proposed. The modified Coulomb counting method uses the corrected current to improve the accuracy of estimation.
The corrected current is the function of discharging current. There is a quadratic relationship between the corrected current and discharging current of battery. By practice of experimental data, corrected current is calculated by the following form:
`I_c(t)=k_2I(t)^2+k_1I(t)+k_0`
Where `k_2 ,k_1` and `k_0`, and are constant values obtained from the practice experimental data.
In modified Coulomb counting method, SOC is calculated by the following equation:
`SOC(t)= SOC(t-1)+(I_c(t))/Q_n Delta(t)`
The experimental results show that the accuracy of the modified Coulomb counting method is superior to the conventional Coulomb counting method.
OBJECTIVES:
- To download Matlab file from below link simulate the 3 test cases from harness dashboard and write a detailed report on the results for above downloaded Matlab Model.
- To understand what is coulomb counting? To refer the above model and explain how BMS implements coulomb counting for SOC estimation?
SOLUTION:
MATLAB MODEL:
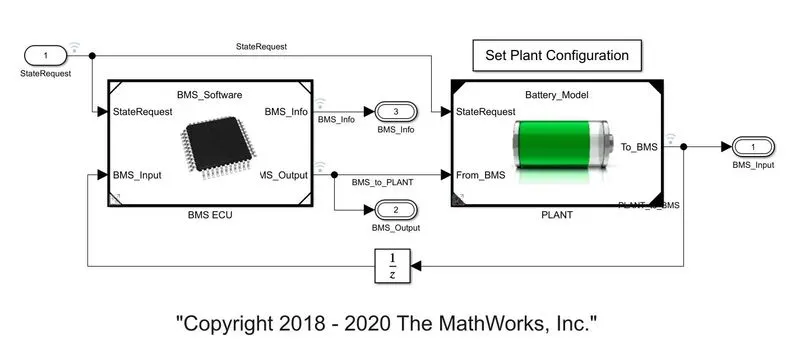
FIGURE.1
I) TO TEST THE 3 TESTS FROM HARNESS DASHBOARD:
- To do the harness test we need to open the TEST Model from the above downloaded file and we will a dashboard as shown in below image:
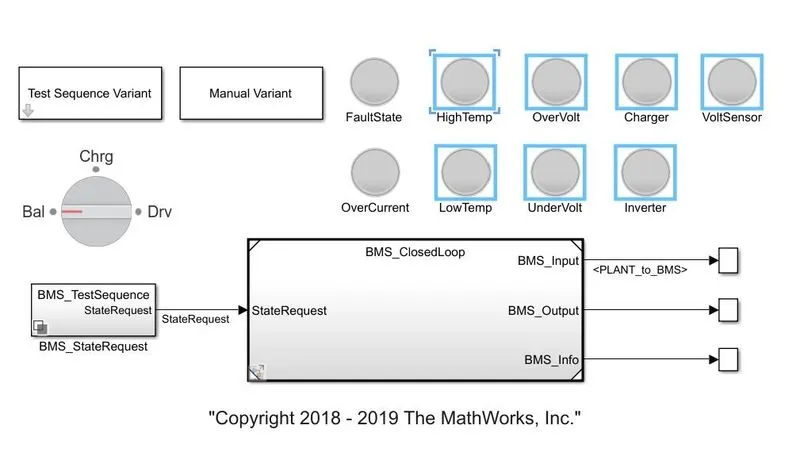
FIGURE.2
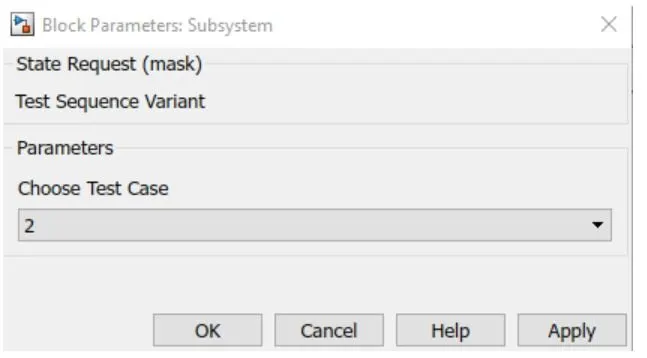
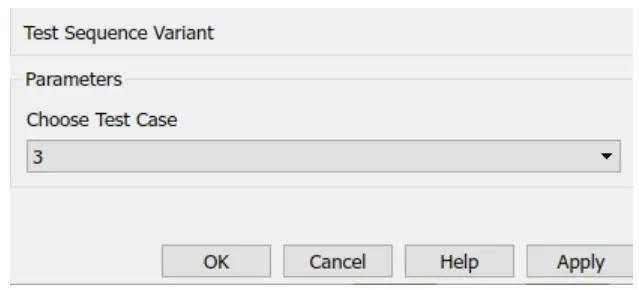
- Now here when we click on the ‘TEST SEQUENCE VARIANT’ we get the following dialog box popping up.
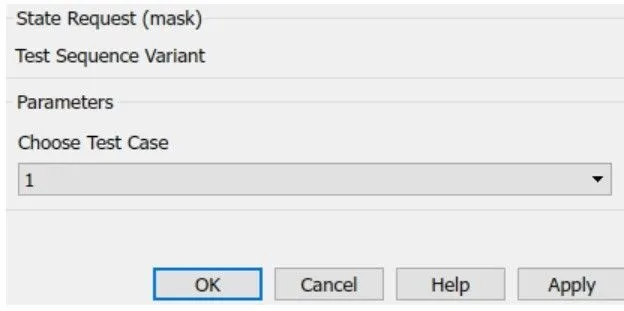
FIGURE.3
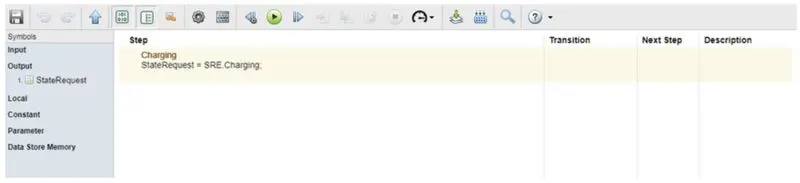
- Now here we have to select the BMS Test sequence number for which we want to run the test. For instance, we have selected test case 1 here and to see what happens in the this test we can click on the down arrow which is in the corner of the ‘TEST SEQUENCE VARIANT’. We get the following box:
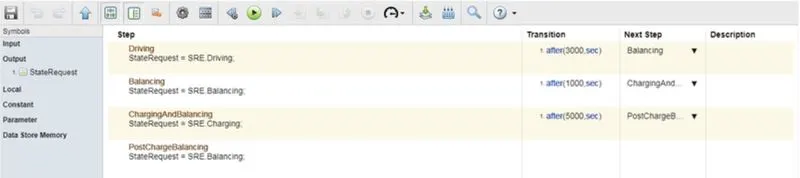
FIGURE.4
- Here we can see what happens in the above selected test sequence. Similarly, we select for test 2 and 3 and we can what happens in those tests like we saw for test 1.
|
FIGURE.5 |
FIGURE.6 |

|
FIGURE.7 |
FIGURE.8 |
- Now when we run the tests our dash boards indicate the light turning into green which means that all process is taking place correctly.
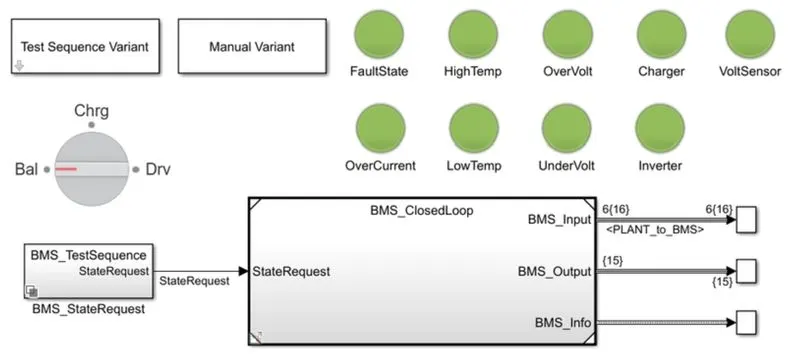
FIGURE.9
RESULTS:
For Test 1:
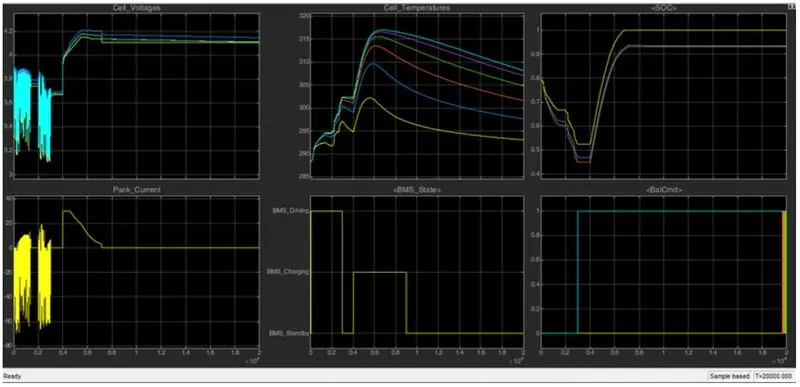
FIGURE.10
Here we can see that the results show the how the cells in the battery pack are performing individually. In the first graph, it shows the voltage of each cell, when the test is in driving mode, the voltage of the cell fluctuates since during driving mode initially vehicle need more power. And also, this voltage is balanced according to the speed in the Balancing mode. Now while in charging mode the cells voltage is increases and there is no discharge since there is no load on the cells, this increase in charge also is done in balanced manner so that all cells charge equally, we can see how all cells are charging nearly the same in a steady manner at the end of the test.
Peak current the battery pack is mostly below 0 in the driving mode since all the current is used in this mode. Then while the charging mode in onn, the battery current increases and then it settles at a constant current since after charging there is no use of the battery, thus storing the charged current.
We can also observe the temperature of each cell, which gradually increases in driving mode and small increase during the charging mode. Once the charging mode in complete the temperature again starts decreasing and reaches nearly to the initial temperature of the cells.
SOC of the cells also decreases as the in driving mode cell voltage is used up, and then while in charging mode the SOC of the cells increases as the voltage is being increased, and then once charging mode is done the SOC remain constant, which means that the energy is stored and not used for any purpose after the charging is done.
We can also observe how the BMS is switching between the modes, during the driving mode the BMS is in driving settings, during the balancing mode, it switches to the Standby settings, then while charging it goes to the charging setting and again come back to the standby setting after charging mode in done.
For Test 2:
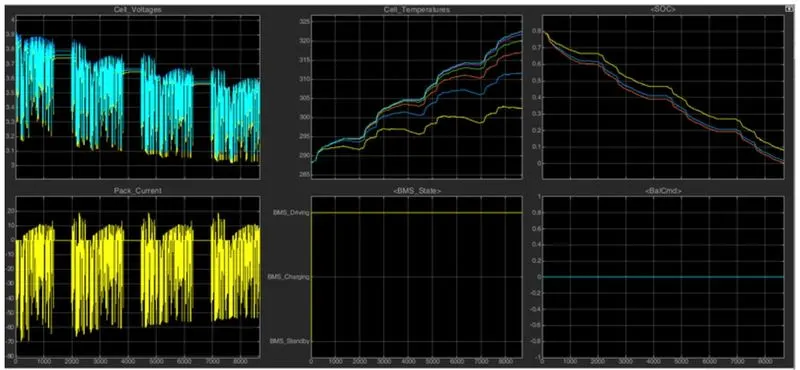
FIGURE.11
Here we can observe that the voltage of the cells is being decreased which means that its benig used up as this test has only driving mode onn. Similarly, current here is also only consumed so it keeps on decreasing.
In the temperature graph, the temperature of the cells keeps on increase because all of their energy is being used in driving mode. In the SOC graph we can see how its decreasing since all the charge is being used in the driving mode.
In the BMS state graph, the BMS is switched only to driving settings, since only driving mode is onn.
For Test 3:
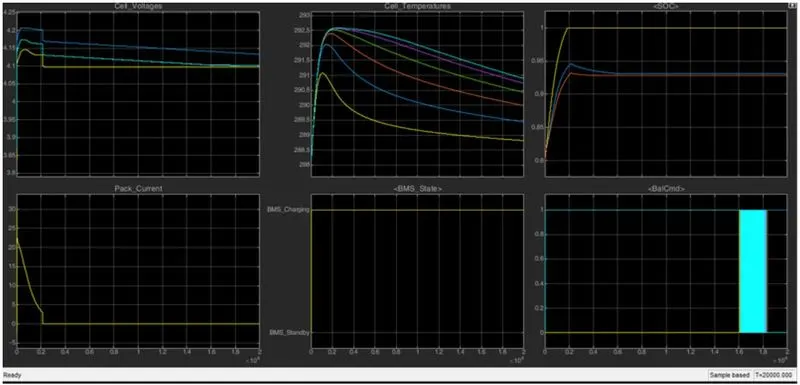
FIGURE.12
Here we can see that the voltage shoot up initially and then they are stable, here voltage increases as the cells are being charged, there is no load applied.
Also the peak current shoot up initially and then since no current is being used it comes to 0 and stays constant.
Similarly temperatures also goes up initially and they come down since there is no load on cells.
SOC increases and stays constant thus retaining the charge in the cells.
BMS is in charging settings since the test is in charging mode.
II) HOW BMS IMPLEMENTS COLOUMB EFFECT IN THE MODEL:
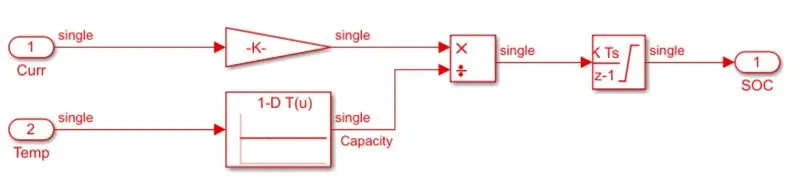
FIGURE.13
- Here to see the above block we need to first double click on ‘BMS ECU BLOCK’ and then we need to double click on the ‘SOC ESTIMATION BLOCK’ then we have to select ‘COLOUMB COUNTING BLOCK’ , once we double click on this bock we get the above series for blocks which helps the BMS to determine the coulomb effect on the battery
- It accepts two input signals: current and temperature, with the current signal going to the gain block and the temperature signal going to the battery time and current lookup tables. Both blocks are linked to the split block, and these signals are sent to the discrete-time integrator to track the charge, which then aids in the calculation of the state of charge.
How coulomb effects works is explained above in the GOVERNING EQAUTION section.
CONCLUSIONS:
- Thus, all the objectives were achieved successfully.
- Similar kind of approach can be followed for similar kind of problems.