Week 7: Shock tube simulation project
1. AIM: To perform transient simulation of shock tube using Converge CFD and post process the results using Paraview.
OBJECTIVE:
-
- Setup a transient shock tube simulation
- Plot the pressure and temperature history in the entire domain - Explain the result
- Plot the cell count as a function of time
2. METHODOLOGY:
Introduction:
Shock tube is an instrument that is used for studying shock waves. It is used to replicate the actual real time explosions and study their effects on a smaller scale. Shock wave is created when a diaphragm separating the high and low pressure region is broken/bursted. Then the shock wave starts to propogate down the shocktube.
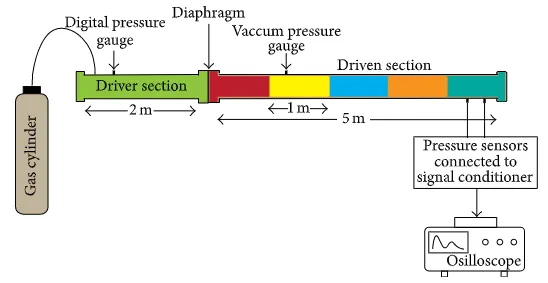
APPLICATIONS OF SHOCK TUBES
- Used to measure dissociation energies and molecular relaxation rates in aerodynamics tests
- To study aerodynamic flow at wide range and pressure and temperatures
- To investigate compressible flow phenomenon and gas phase combustion reactions
- shock tubes used as a tool to both create and direct blast waves at a sensor to imitate actual explosions and the damage that they cause on a smaller scale can be exponentially used to relate/ study actual explosions.
PROCEDURE:
1. Geometry
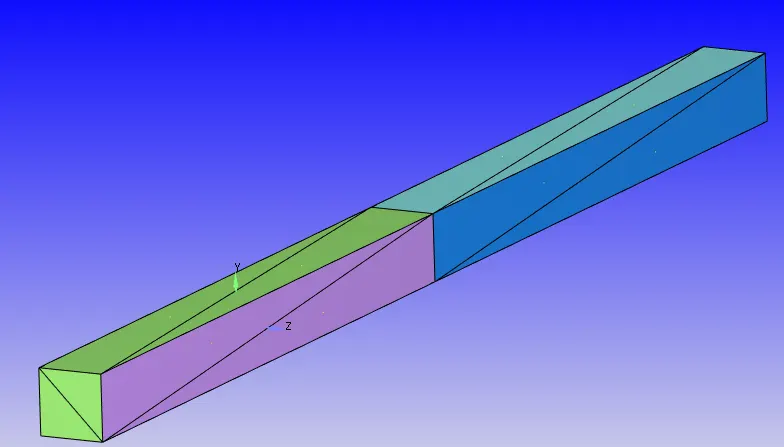
Case Setup-
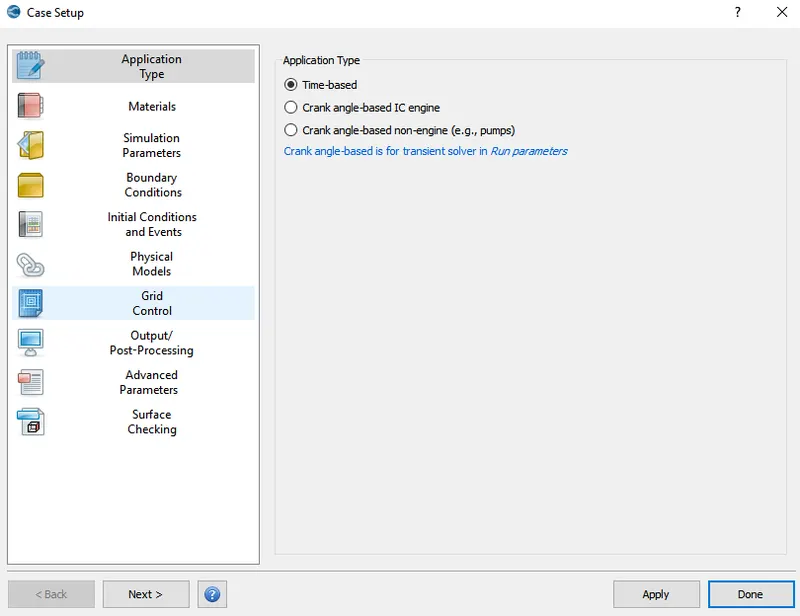
2. Application Type = Time-based
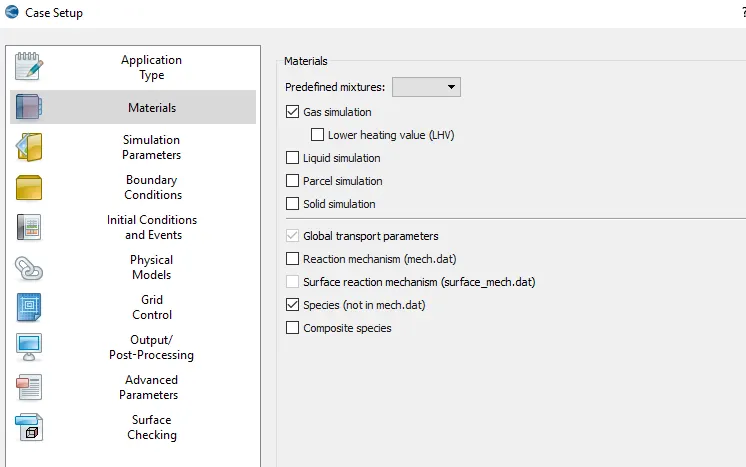
3. Materials - Predefined mixtures = Air
Select 'Gas Simulation' and 'species'.
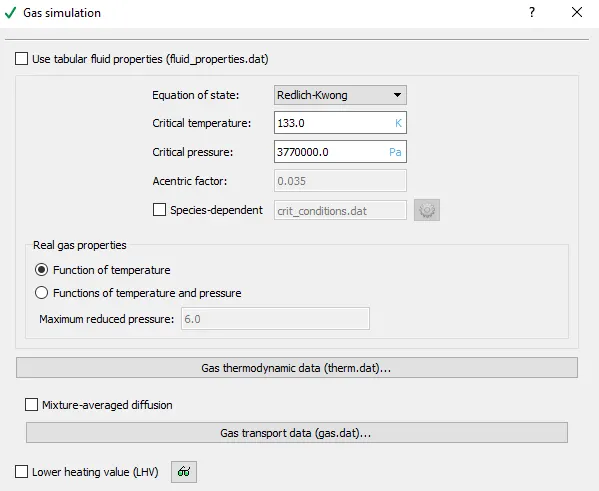
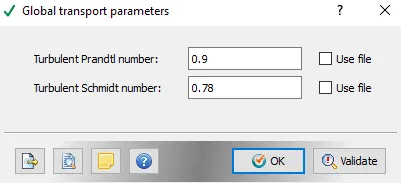
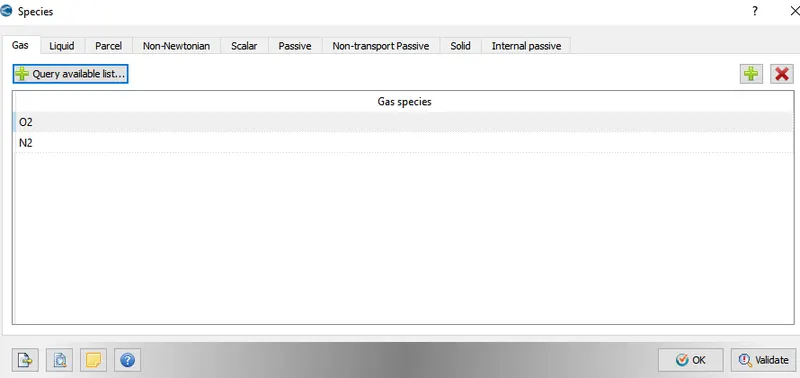
4. Simulation Parameters-
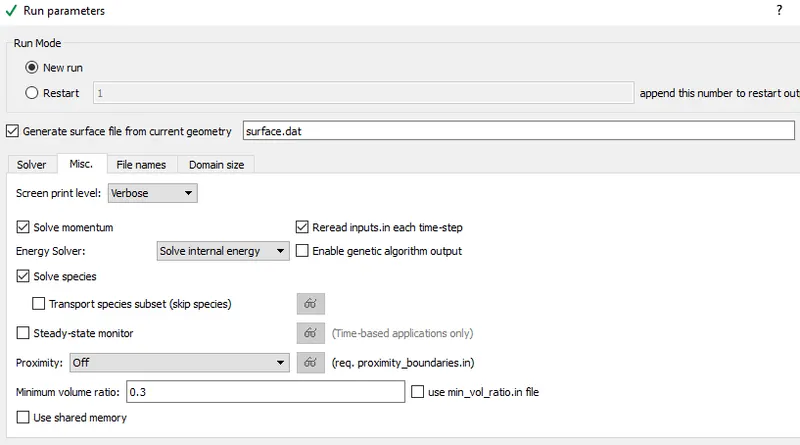
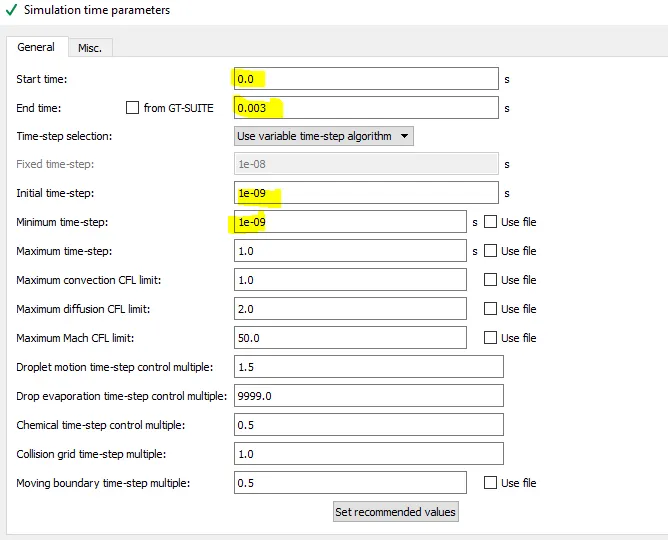
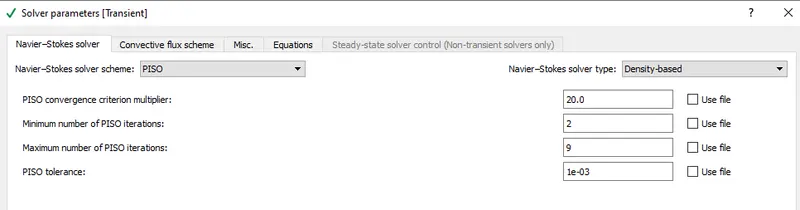
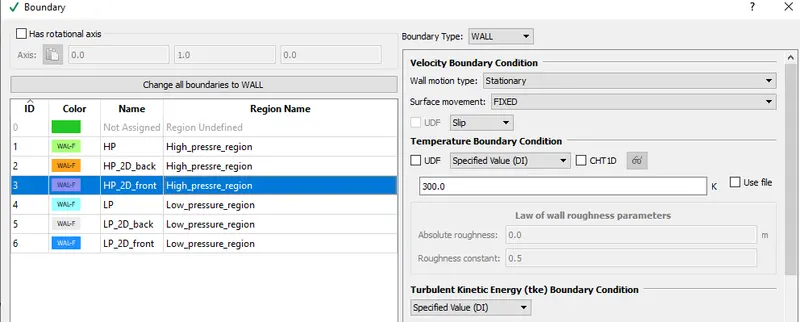
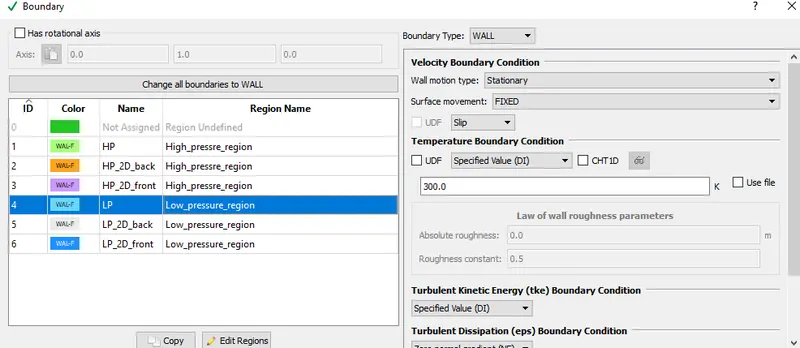
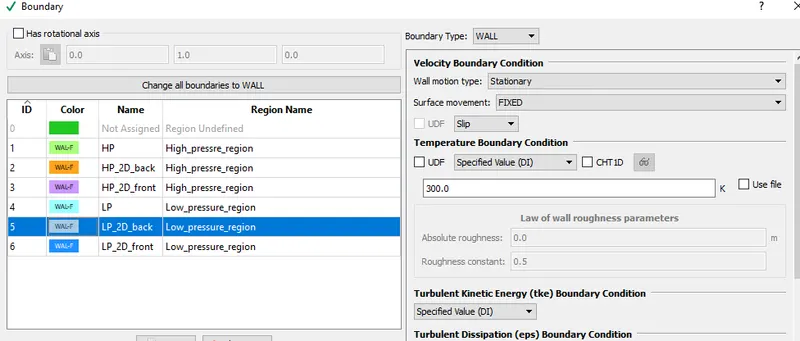
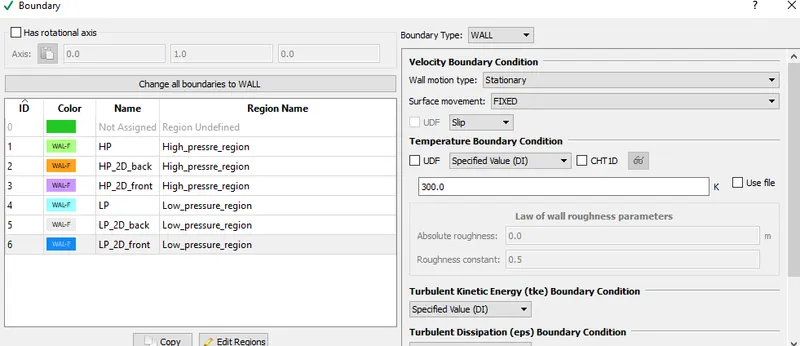
5. Boundary Conditions-
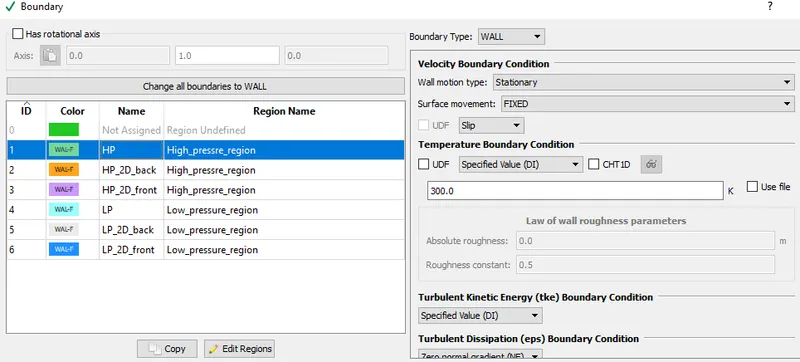
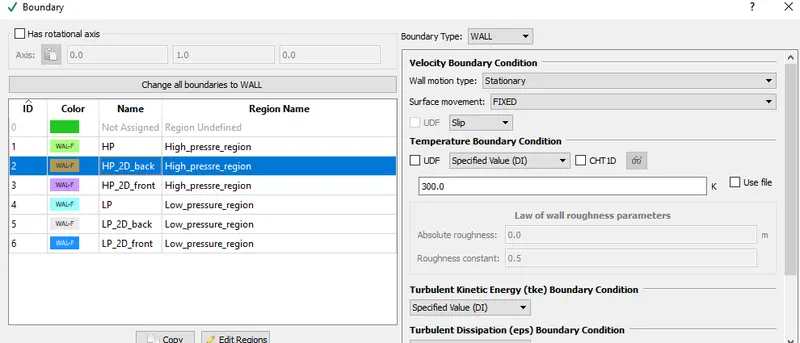
6. Initial Conditions and Events:
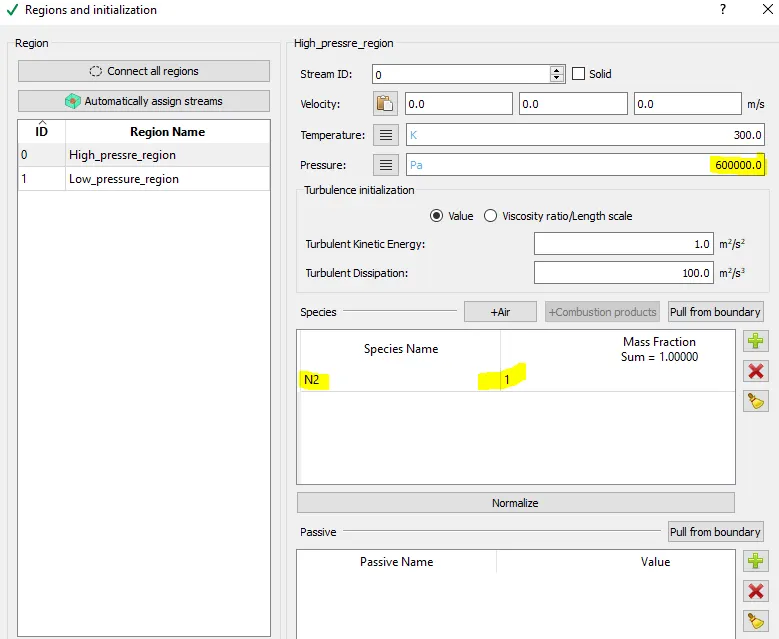
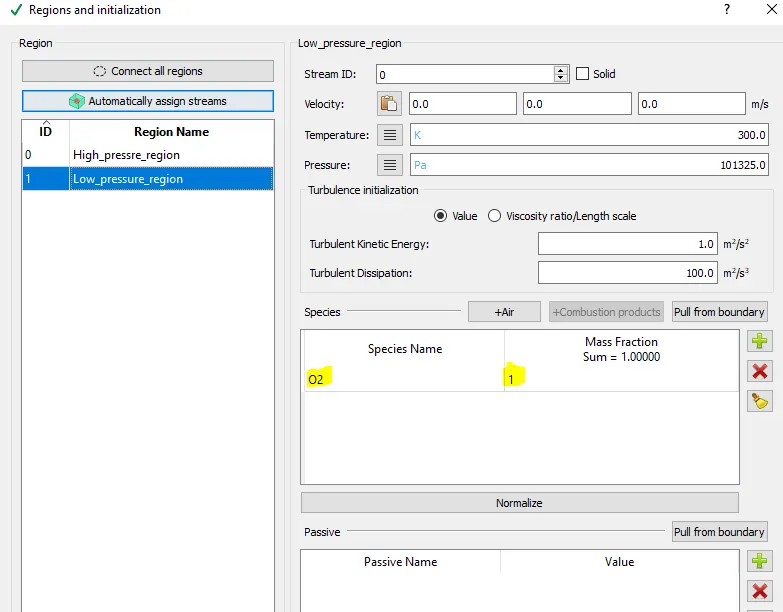
Events:
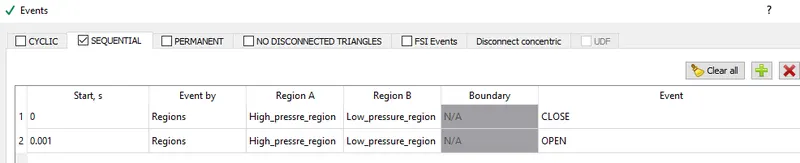
7. Physical Models:
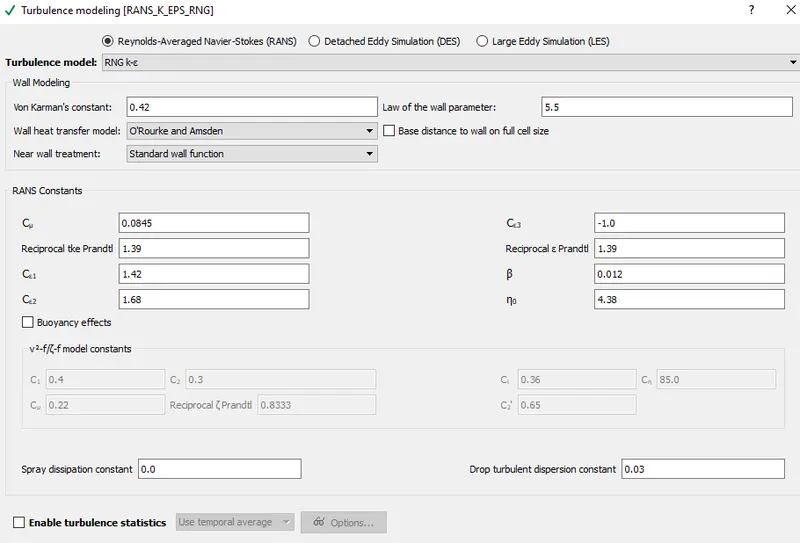
8. Grid Control:
Basic grid:
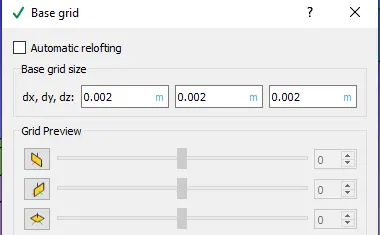
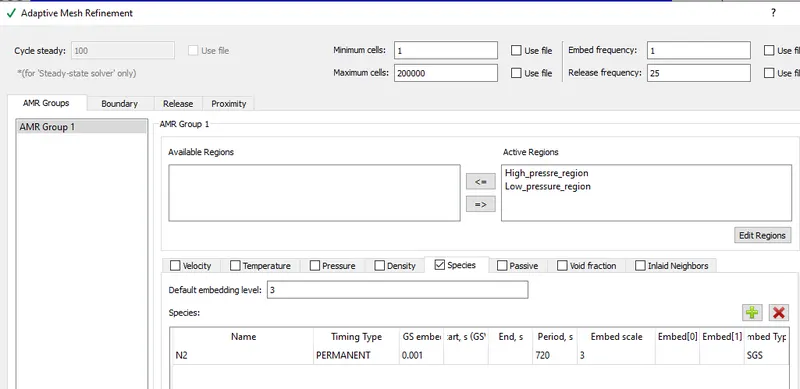
Adaptive Mesh Refinement:
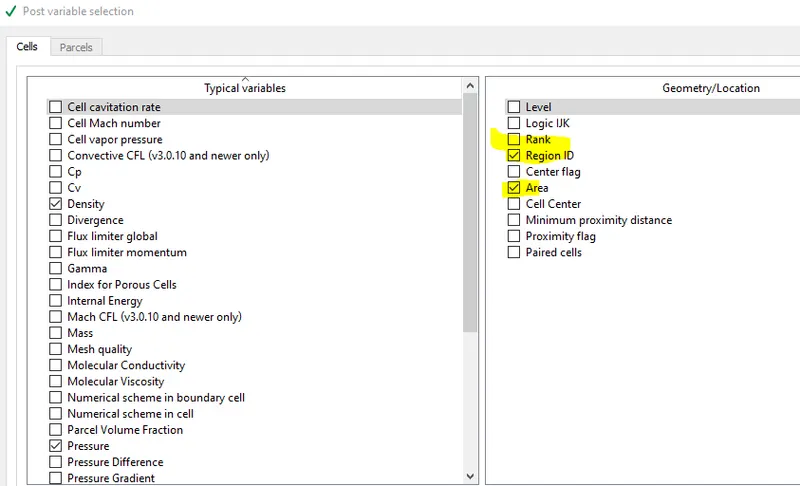
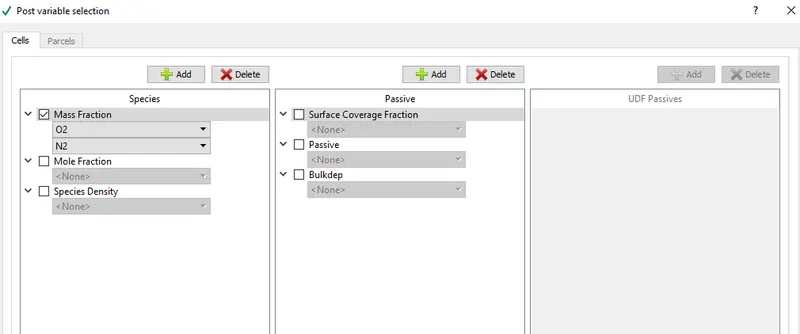
9. Post-Processing:
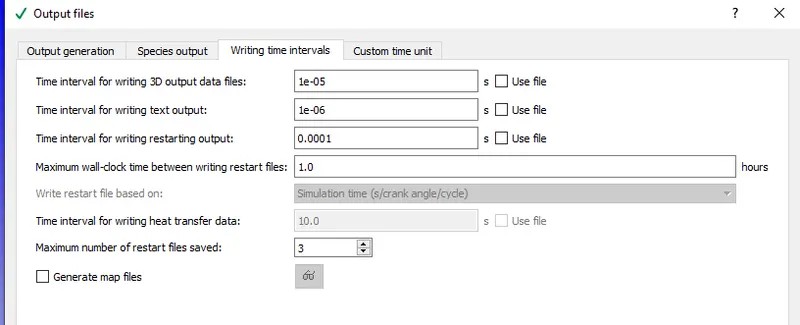
10. Output Files:
3. RESULTS AND DISCUSSION:
PLOTS and CONTOUR:
Generated Mesh:

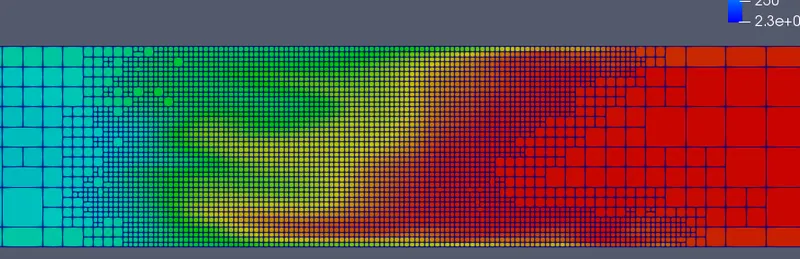
Adaptive Mesh Refinement Contour:
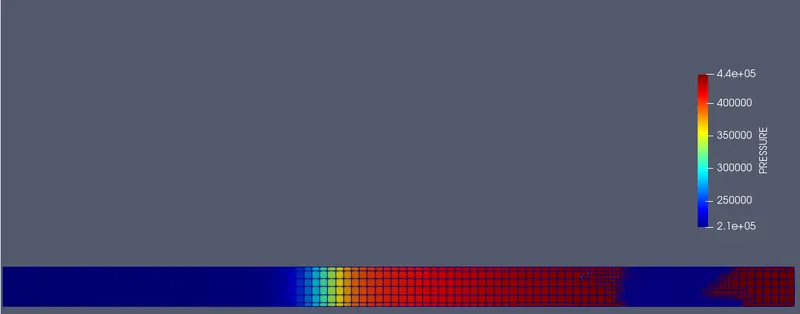
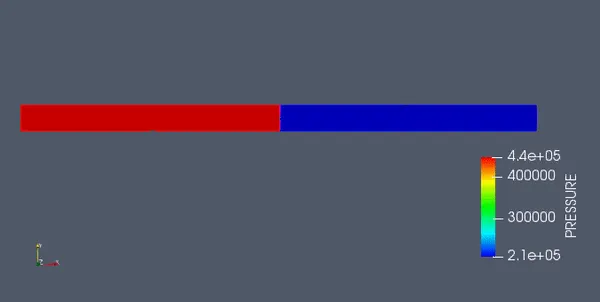
Pressure Contour:
Simulation Link: https://youtu.be/l2uTI-SbmBs
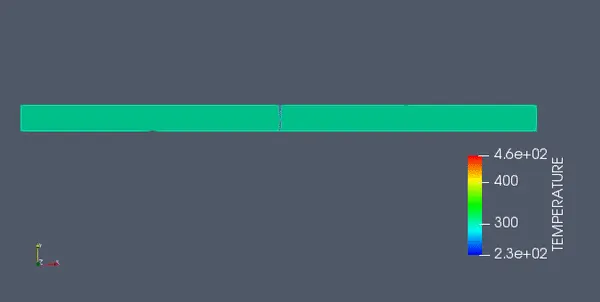
Temperature Contour:
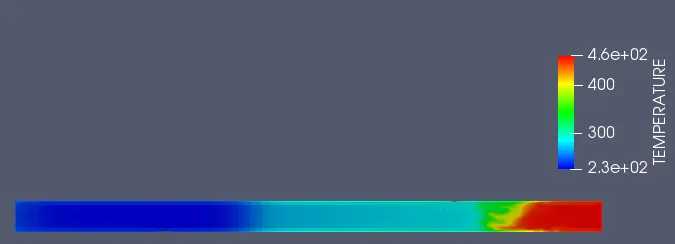
Simulation Link: https://youtu.be/2X3TeehZwLE
Velocity Contour:
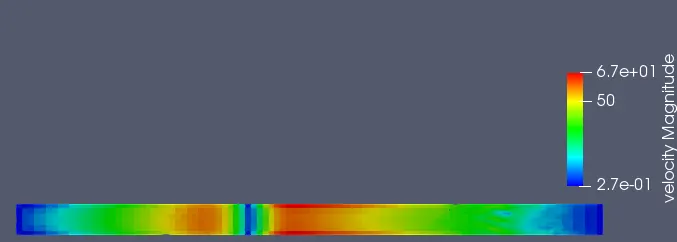
Simulation Link: https://youtu.be/1PUDJeNaTYM
Inference: It is clear from the contours that the Low pressure gas or driven gas undergoes compression and expansion due to variation in pressure and temperature caused by formation of shock waves. Due to compression, the pressure in the low pressure region increases since high pressure gas expands into low pressure region. Subsequently the temperature increases in low pressure region and decreases in high pressure region.
Plot:
Temperature Plot
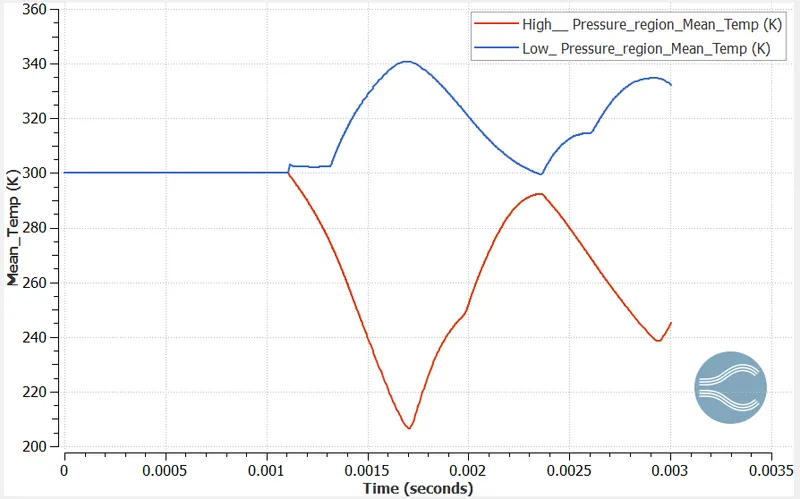
Inference: It is envisaged from the plot that till 0.01 sec the temperature remains 300K but after the diaphragm has burst at 0.01 sec the gas molcules move from high pressure region to low pressure region. This results in decrease in temperature of high pressure region and increase in temperature of low pressure region.
Pressure Plot:
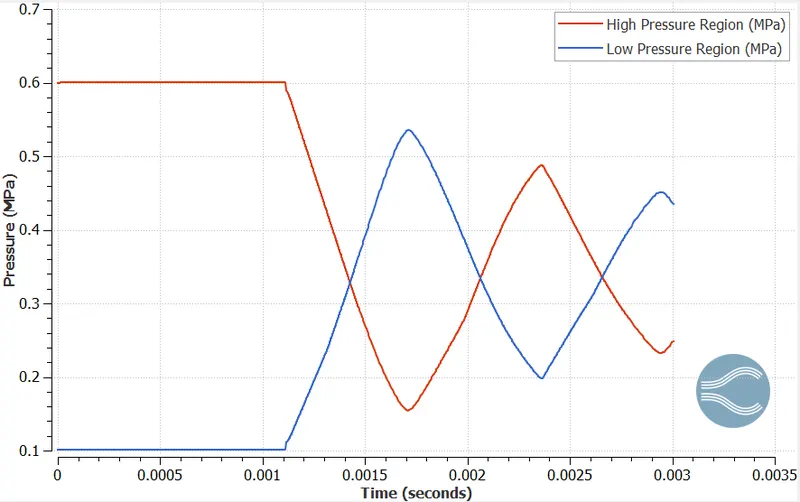
Inference: It is envisaged from the plot that till 0.01 sec the pressure at LP region is 1 bar and HP region is 6 bar as set in Intialization condition but after the diaphragm burst at 0.01 sec the gas molcules interact and move from high pressure region to low pressure region. This results in formation of shock waves that reflect back and forth leading to pressure profile shown in the plot.
Cell Count:
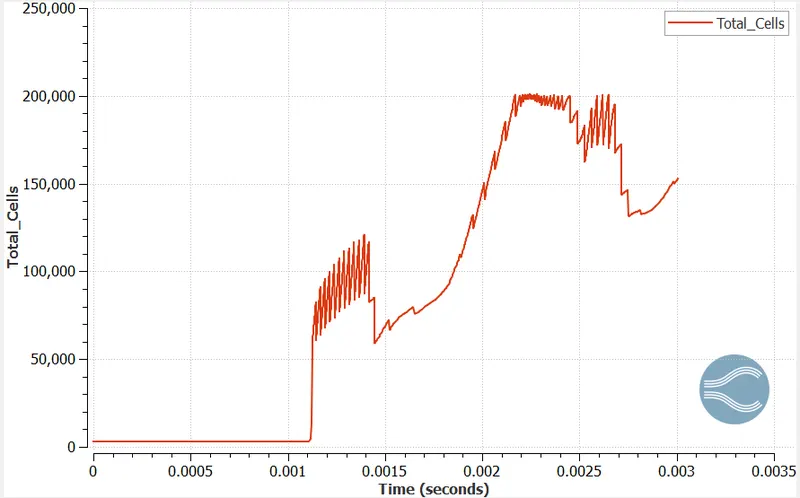
Inference: It is envisaged from the plot that till 0.01 sec the cell count is constant but after the diaphragm burst at 0.01 sec the gas molcules interact and move from high pressure region to low pressure region. This results in activation of Adaptive Mesh Refinement feature and sudden increase in cell count is observed.
4. CONCLUSION: The study of transient analysis of shock tube using Converge and Paraview was simulated successfully.