Week 7: Shock tube simulation project
Aim:
- Setup a transient shock tube simulation
- Plot the pressure and temperature history in the entire domain
- Plot the cell count as a function of time
Shock Tubes are maily used for the study of chemical kinetics.
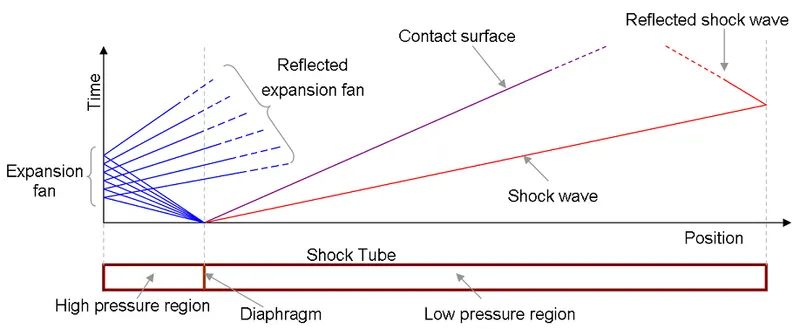
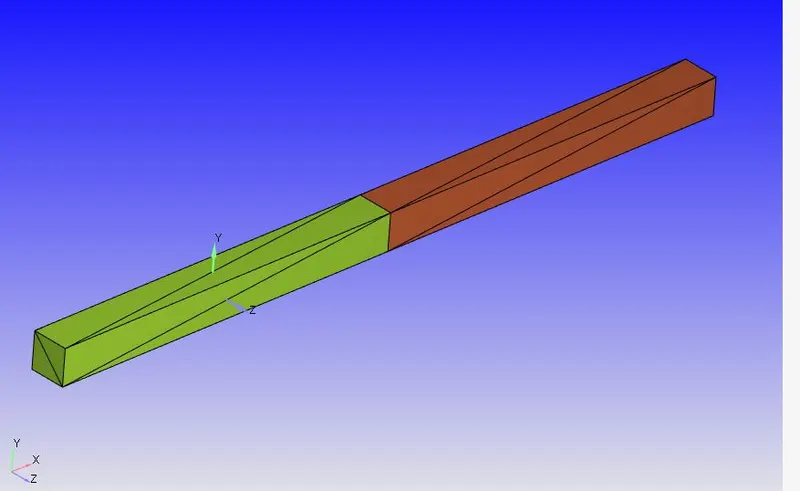
Geometry:
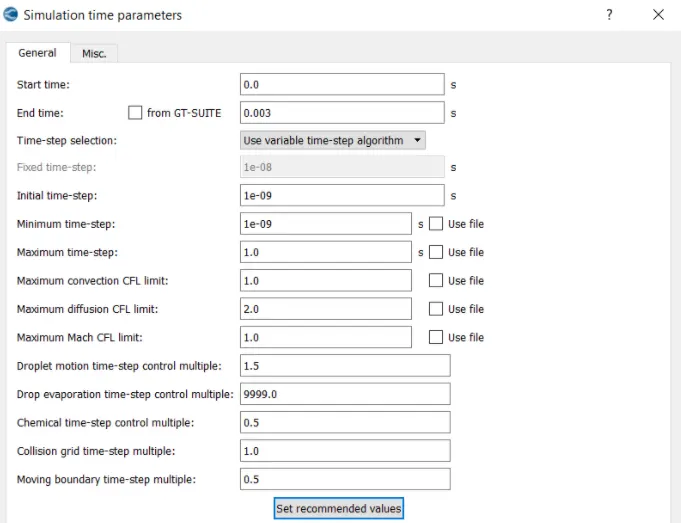
Simulation Parameters:
Regions:
- High Pressure Region(N2)
- Low Pressure Region(O2)
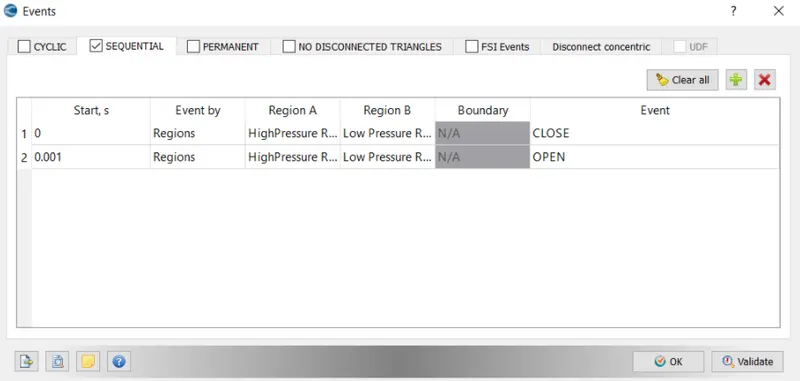
Events:
Turbulance Model: RNG k-epsilon
Grid Control:
Base Mesh: 1 mm
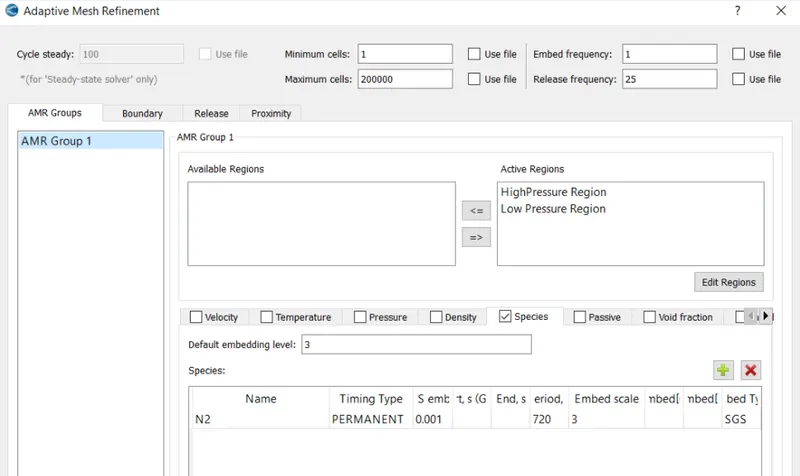
AMR:
Results:
Cell Count:
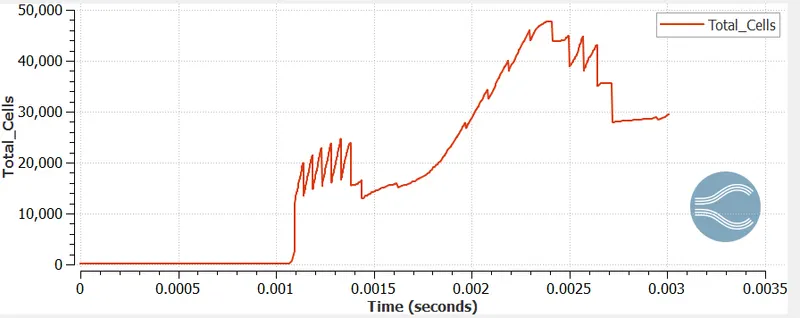
As the diaghram ruptures, due to AMR the numbers of cells continously increases and decreases, till the shock wave would die out.
Pressure:
Temperature:
As seen from the animation , both the temperature and pressure increases as decreases periodically on the left and right of the diaghram, basically due to the transfer of energy from the high pressure regions to the low pressure regions again and again because of collisions, untill the shock wave dies out.