Week 7: Shock tube simulation project
OBJECTIVE: To setup and simulate a shock tube simulation in converge CFD
LITERATURE REVIEW:
The shock tube is an instrument used to replicate and direct blast waves at a sensor or a model in order to simulate actual explosions and their effects, usually on a smaller scale. Shock tubes (and related impulse facilities such as shock tunnels, expansion tubes, and expansion tunnels) can also be used to study aerodynamic flow under a wide range of temperatures and pressures that are difficult to obtain in other types of testing facilities. Shock tubes are also used to investigate compressible flow phenomena and gas phase combustion reactions. More recently, shock tubes have been used in biomedical research to study how biological specimens are affected by blast waves.
A simple shock tube is a tube, rectangular or circular in cross-section, usually constructed of metal, in which a gas at low pressure and a gas at high pressure are separated using some form of diaphram. See, for instance, texts by Soloukhin, Gaydon and Hurle, and Bradley.The diaphragm suddenly bursts open under predetermined conditions to produce a wave propagating through the low pressure section. The shock that eventually forms increases the temperature and pressure of the test gas and induces a flow in the direction of the shock wave. Observations can be made in the flow behind the incident front or take advantage of the longer testing times and vastly enhanced pressures and temperatures behind the reflected wave.
The low-pressure gas, referred to as the driven gas, is subjected to the shock wave. The high pressure gas is known as the driver gas. The corresponding sections of the tube are likewise called the driver and driven sections. The driver gas is usually chosen to have a low molecular weight for safety reasons, with high speed of sound, but may be slightly diluted to 'tailor' interface conditions across the shock. To obtain the strongest shocks the pressure of the driven gas is well below atmospheric pressure (a partial vaccum is induced in the driven section before detonation).
Applications of a shock tube apparatus
In addition to measurements of rates of chemical kinetics shock tubes have been used to measure dissociation energy and molecular relaxtion rate they have been used in aerodynamic tests. The fluid flow in the driven gas can be used much as a wind tunnel, allowing higher temperatures and pressures therein replicating conditions in the turbine sections of jet engines. However, test times are limited to a few milliseconds, either by the arrival of the contact surface or the reflected shock wave.
They have been further developed into shock tunnels, with an added nozzle and dump tank. The resultant high temperature hypersonic flow can be used to simulate atmospheric rentry of spacecraft or hypersonic craft, again with limited testing times.
Shock tubes have been developed in a wide range of sizes. The size and method of producing the shock wave determine the peak and duration of the pressure wave it produces. Thus, shock tubes can be used as a tool used to both create and direct blast waves at a sensor or an object in order to imitate actual explosions and the damage that they cause on a smaller scale, provided that such explosions do not involve elevated temperatures and shrapnel or flying debris. Results from shock tube experiments can be used to develop and validate numerical model of the response of a material or object to an ambient blast wave without shrapnel or flying debris. Shock tubes can be used to experimentally determine which materials and designs would be best suited to the job of attenuating ambient blast waves without shrapnel or flying debris. The results can then be incorporated into designs to protect structures and people that might be exposed to an ambient blast wave without shrapnel or flying debris. Shock tubes are also used in biomedical research to find out how biological tissues are affected by blast waves.
There are alternatives to the classical shock tube; for laboratory experiments at very high pressure, shock waves can also be created using high-intensity short-pulse lasers.
Setup and Simualtion Variables
For this simulation there were some particular variables that we had to take for the setup and for the simulation.
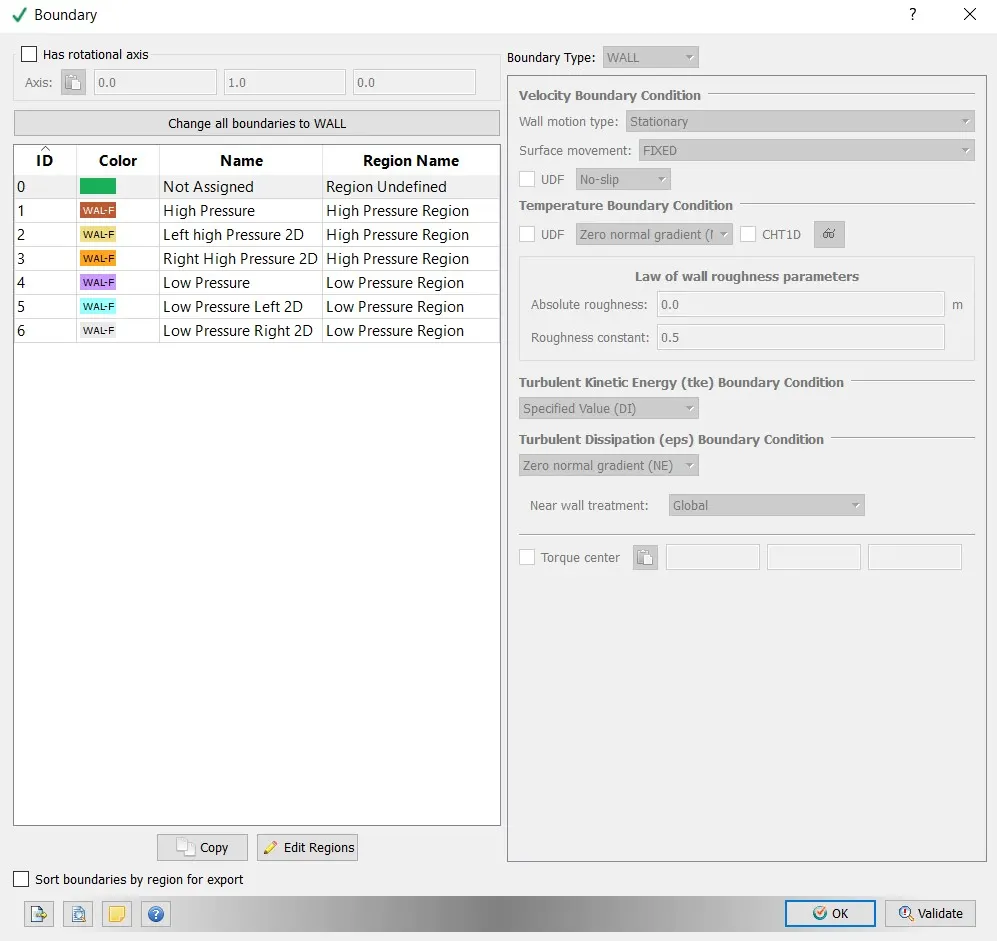
For this simulation we had to create a all wall slip boundaries. For these boundaries we created 2 side walls as well.
Primarily these boundaries are divided into 2 parts
1. High Pressure Region
2. Low Pressure Region
In this simulation we have to work on mixing the N2 in the high pressure region with the O2 in the low pressure region.
We created 2 regions and assigned to the boundaries respectively.
Now for the simulation to work we need to show that when the diaphram breaks there is a mixing at that particular moment.
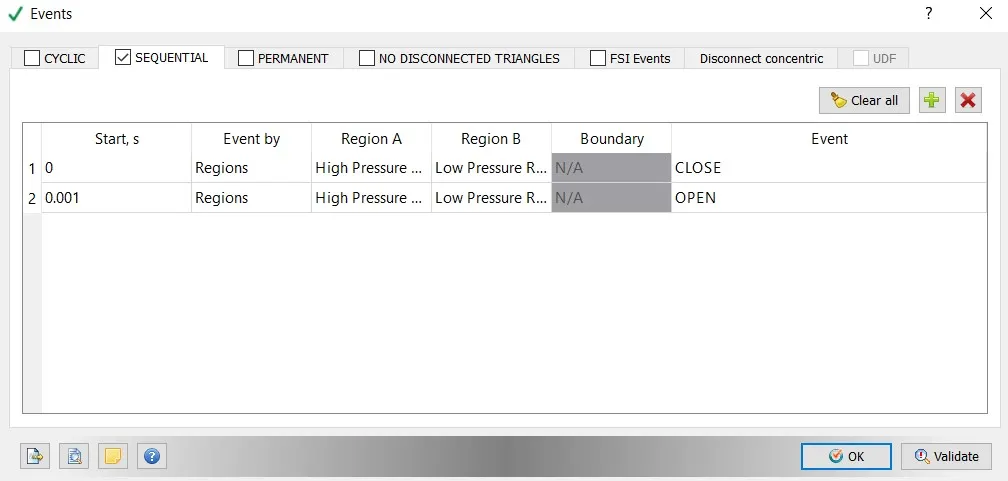
We created an event where the diaphram is closed at 0 seconds i.e. at the start of the simulation. But at 0.001 s there diaphram breaks and thus stated as open.
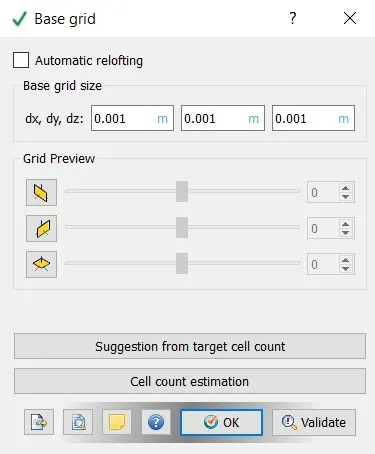
Grid size is taken as 1mm.
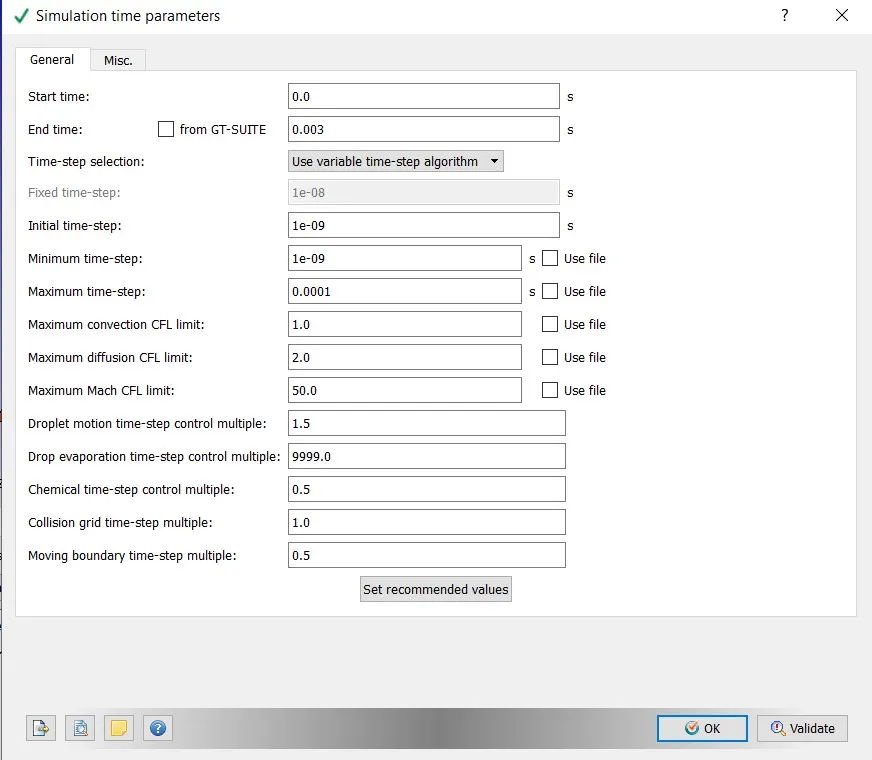
These are the values for the simulation time parameters.
Notice that we have taken the maximum time step as 1e-5 s as this wpuld prevent an energy error. When the diaphram breaks the time step is approx 1ms which is more than the maximum time step which would prevevnt our solution from diverging at the start of the simulation.
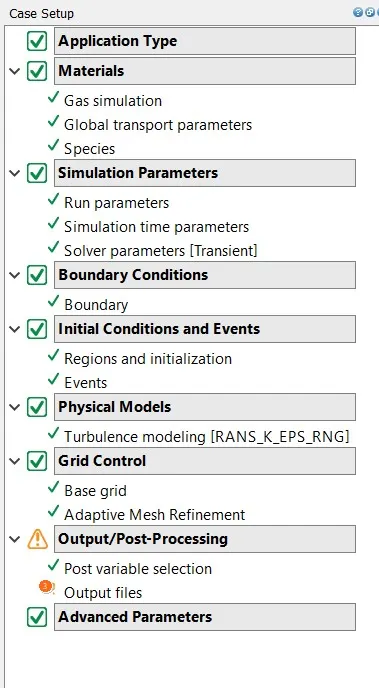
Case setu[p completed after assigning all the variables to the simulation.
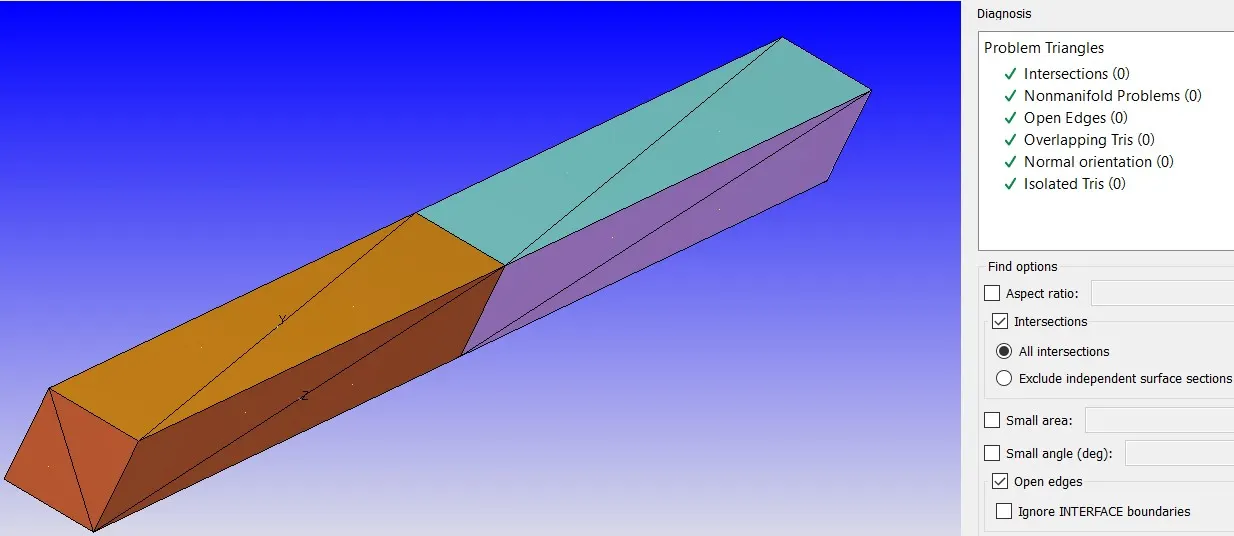
Initially we had non-manifold errors which were found on diagnostics.
On close observation we found that there was a physical grid made at the intersection of the high and low pressure region. This was creating non-manifold problems.
Simulation Run
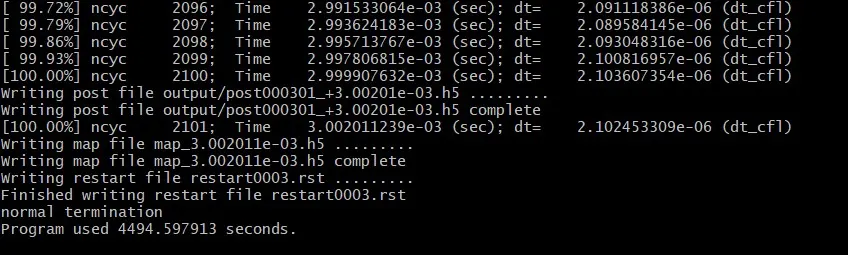
The simulation took about 4500 s as the mesh used is 1mm which is suppose toi be very fine mesh and i have also increased the input files to be 300 for the simulations.
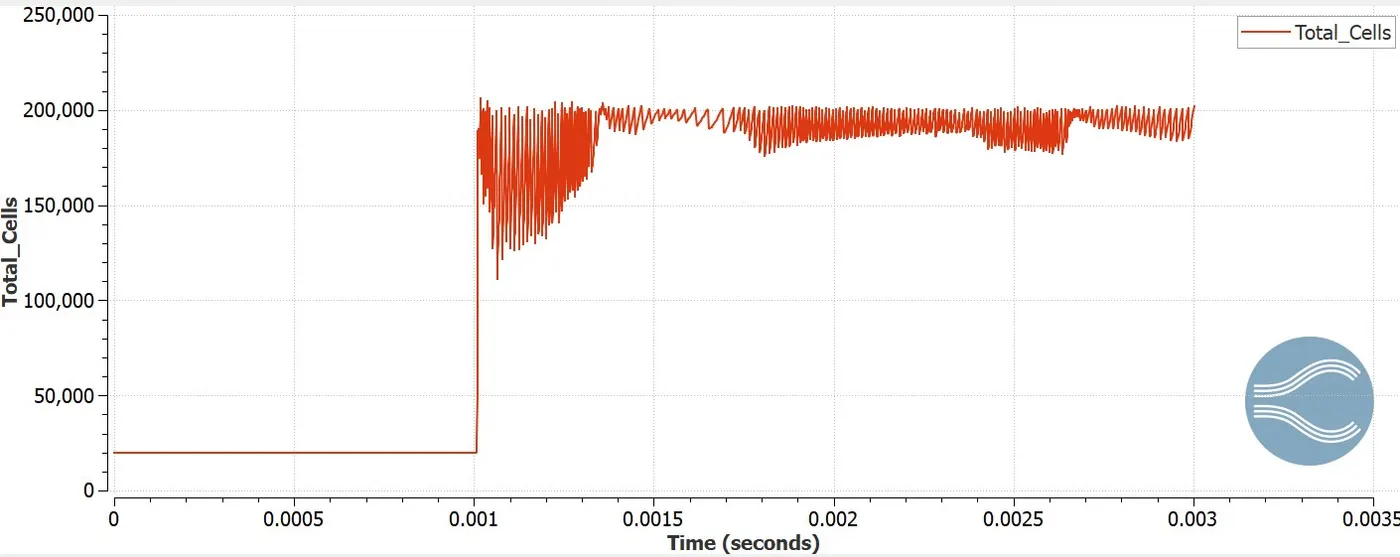
The total cell count for this simulation went up to about 200000.
This is due to the fine mesh size or grid size that has been chosen for this simulation.
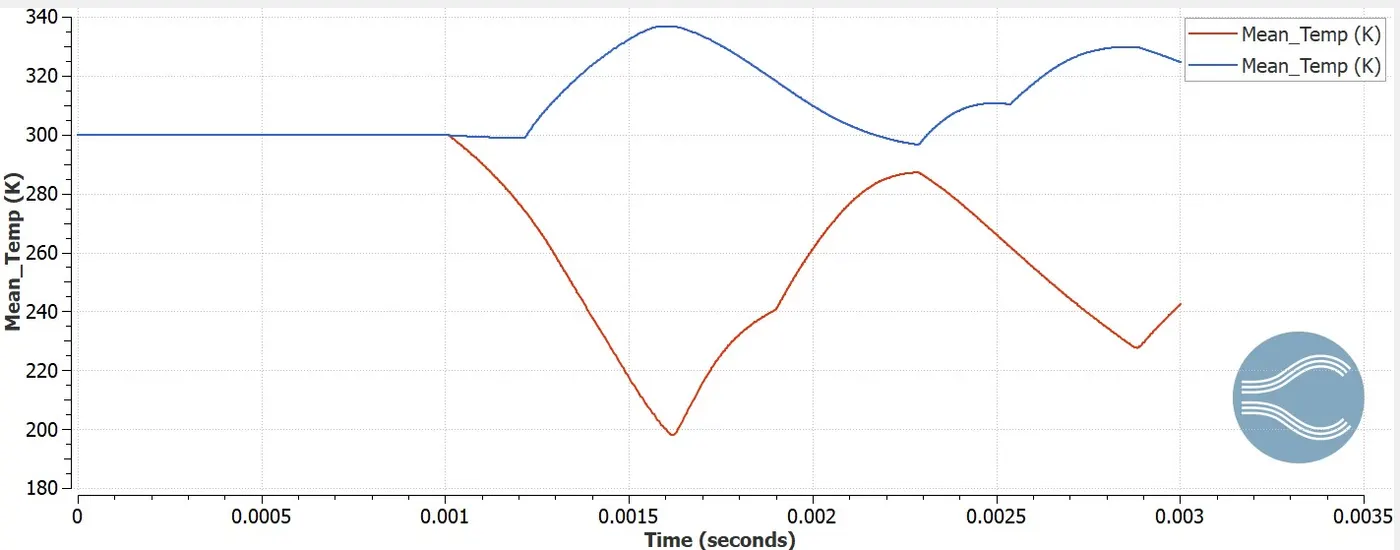
The above plot shows the mean temperature at the inlet and outlet. The Blue line shows the temperature at the hoigh pressure side and the blue at the low pressure side.
In the Plot we can see that the temperature from the low and high side remains constant at about 300 k but as the diaphram breaks at about 0.001 s the temperature at both end starts to increase and decrease according to the mixing of o2 and n2; the species we have taken.
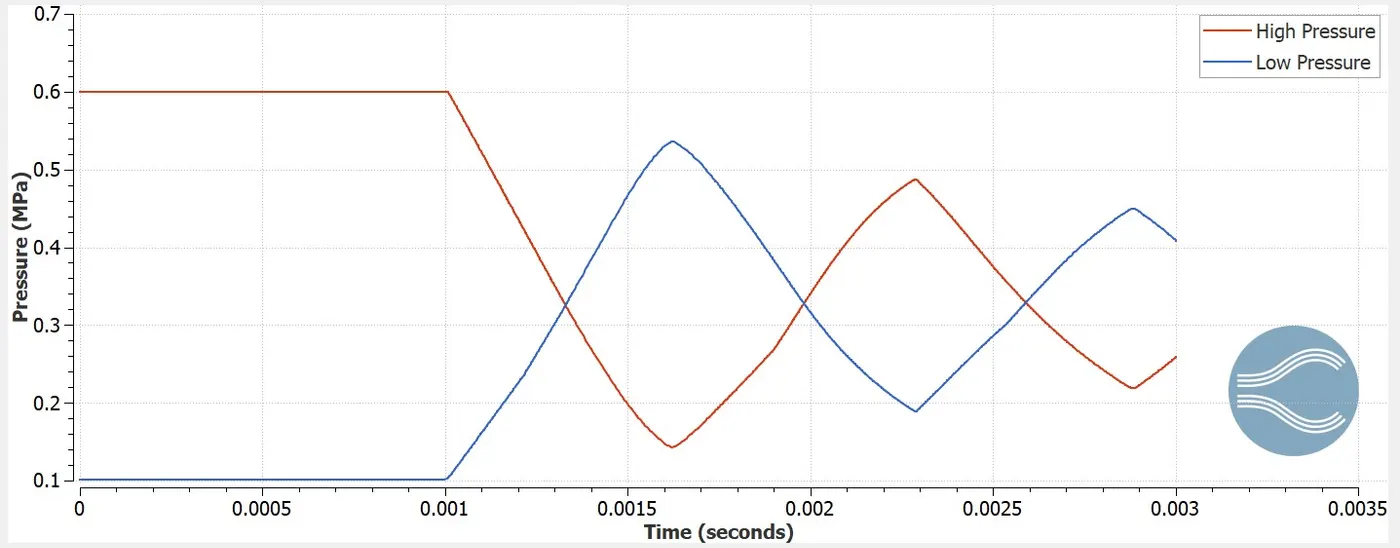
The above plot shows the pressure at both the endws of the shock tube.
We can see again that the pressure remains constant at botht eh ends at the start but as the diaphram breaks and the species mix we can see a drop and increase in the pressure as both ends. This happens as the waves from high pressure end get mixed with the low pressure end and then go back as being pushed back from the low pressure end.
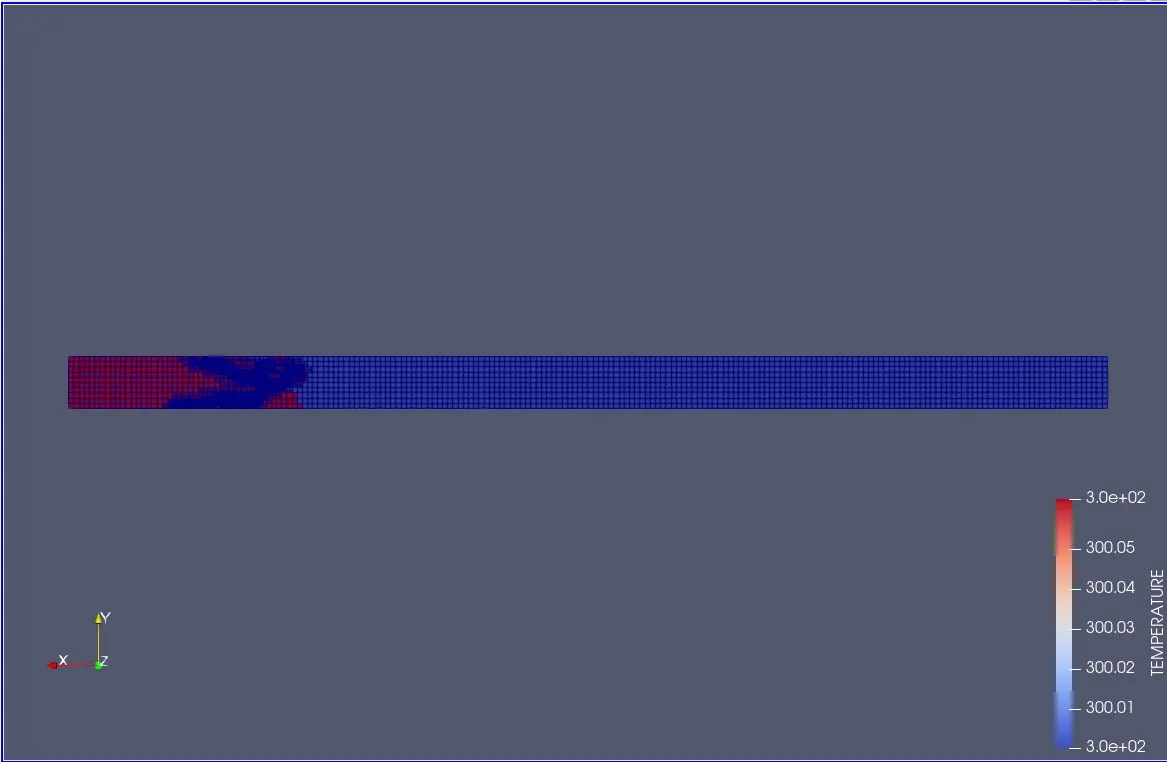
The above image shows the temperature contour last frame where the wave comes back to the high pressure end.
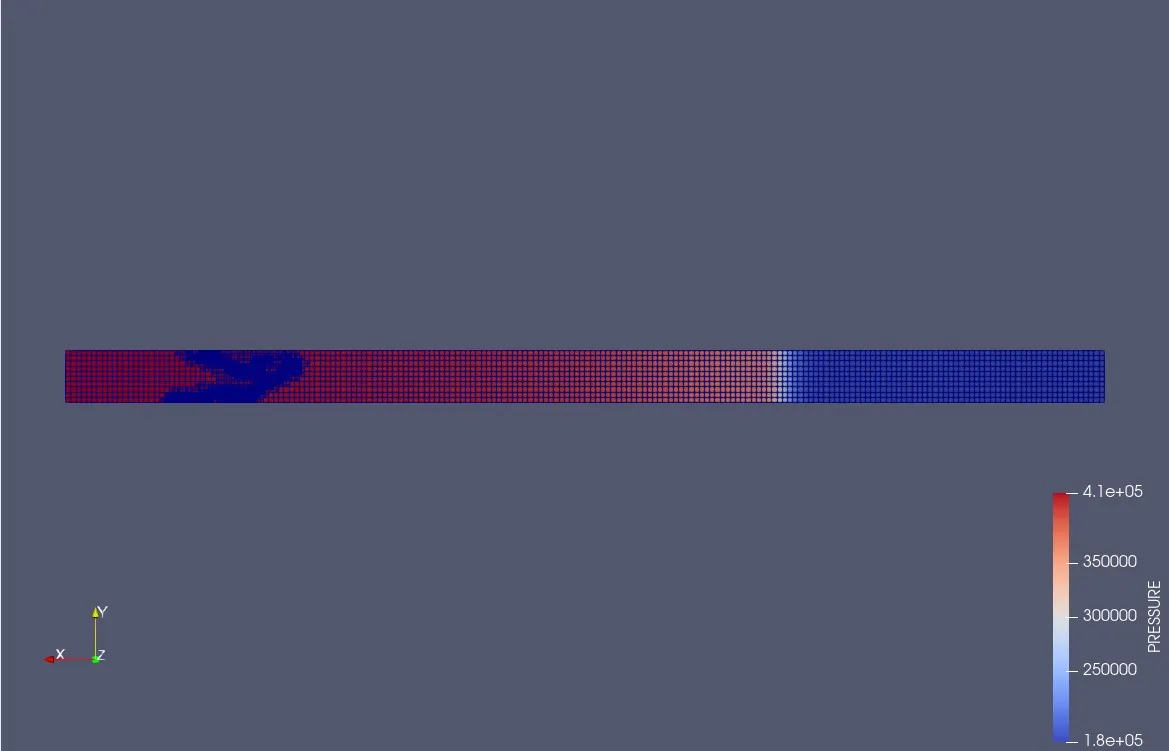
In the above pressure contour we can see the formation of the waves at the high pressure end at the last frame.
The below videos are animations of the Temperature and pressure animations of the contours given above.
CONCLUTION
The simulation has been run on cygwin and the observations have been mentioned in the report.
The mixing of the species produces waves that travel to and fro during the simulation producing shock waves that are used to measure the shocks as apparatus.
The link for the google files is :
https://drive.google.com/drive/folders/12UopsxfZWvkabipMXVQ6_vr1cvlPZQ-2?usp=sharing