Week 7 - Auto ignition using Cantera
OBJECTIVES :- To solve the challenge of Auto ignition by using Python with cantera.
PROBLEM STATEMENTS :-
PART-A]
Use the same reactor network code as shown in the video to simulate the auto ignition Time for methane under the following conditions, (Simulation time = 10 Secs).
Plot the variation of Auto ignition time of methane with a constant temperature of 1250k and pressure varying from 1 to 5 atm.
Plot the variation of auto ignition time of methane with a constant pressure of 5 atm and temperature varying from 950k to 1450k.
NOTE :- Auto ignition time is the time when the temperature of the reactor is Initial temperature plus 400K.
“Time of auto ignition delay = Time of initial temperature + 400k”.
PART-B]
Further observe and print the rate of change of molar concentration of the given elements “H2O, O2, OH” with respect to the time, (simulation time = 10 secs).
Explain the behavior of the graph for 2 cases,
When temperature is 1000k and pressure 5 bar
When temperature is 500k and pressure is 5 bar
INTRODUCTIONS & THEORY :-
The auto ignition temperature or kinding point of a substance is the lowest temperature in which it spontaneously ignites in a normal atmosphere without an external source of ignition, such as flame or spark. This temperature is required to supply the activation energy needed for combustion.
Following are the general questions regarding auto ignition are as follows-
- How does auto ignition occur ?
Ans :- Auto ignition, the spontaneous ignition of a fuel air mixture, happens when initially slow thermal reactions have a large enough chain branching component to sustain and accelerate oxidation.
- What is auto ignition in IC engine ?
Ans. :- Auto ignition is the self ignition of the air/fuel mixture before the spark has fired. This can be caused by hot combustion residuals or hot parts of the cylinder wall. Auto ignition leads to high temperatures and pressure and also can be harmful to the engine.
- What is auto ignition gas stove ?
Ans.:- An automatic ignition for a gas stove is an electronic device that automatically ignites a gas burner. It’s integrated into the burner setup of a gas stove range. When turning the knob of a modern gas stove, it triggers an electrical spark to ignite the gas in the burner.
- Can gasoline ignites without a spark ?
Ans. :- You could heat the gasoline upto a high enough temperature that it could ignite spontaneously: without even a spark.
- Can you put out a cigarette in gasoline ?
Ans. :- Remember the vapours, not the liquid, ignite. That means a lit cigarette doesn’t have to be near the gasoline for it to catch fire (Note:- Studies show lighted cigarette don’t ignite gasoline, because it’s a smoldering ash at high temperature, gasoline will expand and eventually overflow.
- Do cars really explode ?
Ans.:- It might be relatively rare, but motor vehicles do explode and catch fire. Feist walked us through some of the most commen causes of vehicles fires and explosions : Battery: “The battery could blow up, which would sound and look like the car exploded”.
- What is auto ignition ?
Ans.:- The auto ignition temperature of a substance is the temperature at or above which a material will spontaneously ignite (catch fire) without an external spark or flame.
- Does auto ignition temperature vary with pressure ?
Ans. :- The temperature at which a chemical ignites decreases as the pressure or oxygen concentration increases. It is usually applied to a combustible fuel mixture substances which spontaneously ignite in a normal atmosphere at naturally ambient temperatures are termed pyrophoric.
- What is lowest ignition temperature ?
Ans. :- For the first question Coal is a answer, second one is hydrogen, third one is biogas and in general, the self ignition auto ignition temperature is lowest temperature at which a fuel like petrol or diesel spontaneously ignites in normal atmosphere without an external source of ignition.
- What is the difference between piloted ignition and auto ignition ?
Ans. :- Ignition by piloted ignition occurs when the rate of pyrolysis is sufficient to allow the establishment of a diffusion flame, when a spark or small pilot flame is introduced into the boundary layer close to to irradiate surface (Silcock 1995). Auto ignition requires very high intensities to occur.
- What is difference between pre ignition and detonation ?
Ans. :- Pre ignition is an abnormal combustion event. Pre ignition is the ignition of the air fuel charge while the piston is still compressing the charge. Detonation as the name suggests, is an explosion of the fuel air mixture inside the cylinder.
- What are the effect of knocking ?
Ans. :- The usage of hydrogen in compression ignition engine leads to production of knocking or detonation because of its lower ignition energy, wider flammability range, and shorter quenching distance. Knocking combustion causes major engine damage, and also reduces the efficiency.
- Do gas stove have an automatic shut off ?
Ans. :- Some new stoves have auto cutoffs if they don’t detect a flame. You shall have to buy a whole new stove though. I know on my gas cooktop it will shut off the gas if there’s no flame. But mine has a piezoelectric spark ignition, not a pilot light.
- Can alcohol self ignite ?
Ans. :- No, alcohol flasks or alcohol based hand sanitizer left inside vehicles can ignite with the sun heat. Explaination: The self ignition point of the substance (when it burns even without contact with a spark or flame) is more than 300 degree celcius, according to specielists heard by Aos Fatos.
- At what temperature does gasoline ignite ?
Ans. :- The flash point of a volatile material is the lowest temperature needed to evaporate enough fluid to form a combustible concentration of gas. Gasoline has a flash point of -45 degree farhanite and an auto ignition temperature of 536 degree farhanite.
- At what temperature oxygen ignite ?
Ans. :- This result in a neon burning, convectively bound flame front that moves towards the core. The motion of the flame is what eventually leads to oxygen burning. In approximately 3 years, the flames temperature reaches about 1.83 billion kelvins, enabling the oxygen burning process to commence.
- Can Cigarette ash start a fire ?
Ans.:- As most smocking related fires occur in living rooms and bedrooms, it is best to smoke outside. Cigerrete buts or ashes can ignite many things in a home, such as curtains, beds, books …etc.
- How explosive is jet fuel ?
Ans. :- Commercial jet fuel is a pale yellow liquid with petroleum odor. It has an auto ignition temperature of 410 degree farhanite (210 degree celcius). It’s explosive limits are from 0.6 to 4.7 percent by volume in air.
- Can a cigarette start a grass fire ?
Ans. :- Fire fighters are reminding smokers not to throw cigarette buts out of their car windows after seeing an increase in grass fires caused by cigarettes and with dry conditions, the fire could spread quickly damaging the environment.
The applications of controlled auto-ignition Gasoline Engines –The challenges and solutions :-
Controlled auto ignition (CAI) combustion, also known as Homogeneous charge Compression ignition (HCCI), has the potential to simultaneously reduce the fuel consumption and nitrogen oxides emissions of gasoline engines. However, narrow operating region in loads and speeds is one of the challenges for the commercial application of CAI combustion. The effect of intake charge boosting, charge stratification and spark assisted ignition on the operating range in CAI mode was reviewed. Stratified flame ignited (SFI) hybrid combustion is one form to achieve CAI combustion under the conditions of highly diluted mixture caused by the flame in the stratified mixture with the help of a spark plug. CAI combustion in two stroke gasoline engine can be used to enhance the torque of a four stroke gasoline engine with the same displacement at the same indicated mean effective pressure. Poppet valved two stroke gasoline engines with normal valve lift and variable valve timing device, and uniflow two stroke engines with gas exchange process completed by intake ports on the bottom of cylinder wall and overhead exhaust poppet valves are promising to achieve CAI combustion in a wide operating range. Hence, CAI combustion in two stroke gasoline engine is a feasible solution for it’s commercial application to vehicles.
STEP WISE PROCEDURES OF CODE :-
There have different cases for writing code but, I write here common steps to involved in writing code.
- First off all imported all different modules used in the code like sys, numpy, cantera and matplotlib.
- Then define gas solution
- Then define temperature & pressure.
- Use for loop and define temperature, pressure and molar concentrations.
- Use the reactor as IdealGasReactor and simulation reactor as ReactorNet.
- Time range in between 0.0 to 10.0 microseconds i.e. 10000ms, which is time step size.
- Use the states as SolutionArray
- Solution tobe calculated at every 1e-3 sec
- Integrate system to the time given
- Then creating if loop for finding the ignition delay
- If new temperature is greater than or equal to 400 + old temperature, then and then print ignition delay.
- Plots two graphs are (states.t, states.T) and (Temp, Ignition delay).
PART- A
Code at constant Pressure :-
import sys
import numpy as np
import cantera as ct
import matplotlib.pyplot as plt

gas = ct.Solution("gri30.xml")
T_i = 950
T_e = 1450
Temp = np.linspace(T_i,T_e,11)
Ignition_delay = []
P = 5*101325  # Pressure should be defined in Pascal. Cantera uses SI unit
for T in Temp:

	gas.TPX = T,P,{'CH4':1,'O2':2, 'N2':7.52}
	r = ct.IdealGasReactor(gas) # Ideal gas reactor is the class and r is instance of it
	sim = ct.ReactorNet([r]) # Creating the simulation object
	time = 0.0
	T_old = T
	states = ct.SolutionArray(gas,extra=['time_in_ms','t']) # As gases are in different temperature and pressure at instance
	i=1
	for i in range(10000): #Time step size = 10s
		time+=1e-3 #Solution to be calculated at every 1e-3s
		sim.advance(time) #Integrate system to the time given
		states.append(r.thermo.state,time_in_ms = time*1e3, t=time)
		T_new = states.T
		T_new = T_new[i-1]

		#creating if loop for finding the ignition delay
		#(Time)ignition delay = (Time)initial temp + 400K
		if (T_new>=400+T_old):
			Ignition_delay.append(time)

			T_old = states.T
			T_old = T_old[i-1]

			print('Ignition_delay')

			plt.figure(1)
			plt.plot(states.t,states.T)


plt.legend(['Temp = ' + str(T) + '[k]' for T in Temp])
plt.xlabel('Time')
plt.ylabel('Temperature')
print('Ignition_delay = ',Ignition_delay)
plt.savefig("Temperature Vs Time")

plt.figure(2)
plt.plot(Temp,Ignition_delay,'-*')
plt.xlabel('Temperature in [K]')
plt.ylabel('Ignition_delay in [ms]')
plt.savefig("Ignition delay vs temperature")
plt.show()
Code at constant Temperature :-
import sys
import numpy as np
import cantera as ct
import matplotlib.pyplot as plt

gas = ct.Solution("gri30.xml")
P_i = 1*101325
P_e = 5*101325
Press = np.linspace(P_i,P_e,11)
Ignition_delay = []
T = 1250  # Pressure should be defined in Pascal. Cantera uses SI unit
for P in Press:

	gas.TPX = T,P,{'CH4':1,'O2':2, 'N2':7.52}
	r = ct.IdealGasReactor(gas) # Ideal gas reactor is the class and r is instance of it
	sim = ct.ReactorNet([r]) # Creating the simulation object
	time = 0.0
	T_old = T
	states = ct.SolutionArray(gas,extra=['time_in_ms','t']) # As gases are in different temperature and pressure at instance
	i=1
	for i in range(10000): #Time step size = 10s
		time+=1e-3 #Solution to be calculated at every 1e-3s
		sim.advance(time) #Integrate system to the time given
		states.append(r.thermo.state,time_in_ms = time*1e3, t=time)
		T_new = states.T
		T_new = T_new[i-1]

		#creating if loop for finding the ignition delay
		if (T_new>=400+T_old):
			Ignition_delay.append(time)

			T_old = states.T
			T_old = T_old[i-1]

			print('Ignition_delay')

			plt.figure(1)
			plt.plot(states.t,states.T)


# plt.legend(['Temp = ' + str(T) + '[k]' for T in Temp])
plt.xlabel('Time')
plt.ylabel('Temperature')
print('Ignition_delay = ',Ignition_delay)
plt.figure(2)
plt.plot(Press, Ignition_delay,'-*')
plt.xlabel('Pressure in [Pa]')
plt.ylabel('Ignition_delay in [ms]')
plt.show()
plt.show()
PART- B
Here molar concentrations are “H2O, O2 & OH” with respect to time.
Code at Temp = 1000k & 5 bar :-
import sys
import numpy as np
import cantera as ct
import matplotlib.pyplot as plt

Temp = [1000]
for T in Temp:
	gas = ct.Solution("gri30.xml")
	P = 5*101325
	gas.TPX = T,P,{'CH4':1,'O2':2, 'N2':7.52}
r = ct.IdealGasReactor(gas) # Ideal gas reactor is the class and r is instance of it
sim = ct.ReactorNet([r]) # Creating the simulation object
time = 0.0
T_old = T
states = ct.SolutionArray(gas,extra=['time_in_ms','t']) # As gases are in different temperature and pressure at instance
i=1
for i in range(10000): #Time step size = 10s
	time+=1e-3 #Solution to be calculated at every 1e-3s
	sim.advance(time) #Integrate system to the time given
	states.append(r.thermo.state,time_in_ms = time*1e3, t=time)

#Plot rate of H2O Mole fraction
plt.subplot(1,3,1)
plt.plot(states.t, states.X[:, gas.species_index("H2O")])
plt.xlabel("Simulation time")
plt.legend(["H2O-Mole fraction"])
plt.title("Rate of concentration of H2O")

#Plot Rate of O2 Molar fraction
plt.subplot(1,3,2)
plt.plot(states.t, states.X[:,gas.species_index("O2")])
plt.xlabel("Simulation time")
plt.legend(["O2-Mole fraction"])
plt.title("Rate of concentration of O2")

#Plot rate of OH Molar fraction
plt.subplot(1,3,3)
plt.plot(states.t, states.X[:, gas.species_index("OH")])
plt.xlabel("Simulation time")
plt.legend(["OH-Molefraction"])
plt.title("Rate of concentration of OH")
plt.suptitle("Rate of change of concentration of H2O, O2 & N2 at" + str(T) + "[Kelvin")
plt.savefig("Plot for 1000k")
plt.show()
Code at Temp = 500k & 5 bar :-
import sys
import numpy as np
import cantera as ct
import matplotlib.pyplot as plt

Temp = [500]
for T in Temp:
	gas = ct.Solution("gri30.xml")
	P = 5*101325
	gas.TPX = T,P,{'CH4':1,'O2':2, 'N2':7.52}
r = ct.IdealGasReactor(gas) # Ideal gas reactor is the class and r is instance of it
sim = ct.ReactorNet([r]) # Creating the simulation object
time = 0.0
T_old = T
states = ct.SolutionArray(gas,extra=['time_in_ms','t']) # As gases are in different temperature and pressure at instance
i=1
for i in range(10000): #Time step size = 10s
	time+=1e-3 #Solution to be calculated at every 1e-3s
	sim.advance(time) #Integrate system to the time given
	states.append(r.thermo.state,time_in_ms = time*1e3, t=time)

#Plot rate of H2O Mole fraction
plt.subplot(1,3,1)
plt.plot(states.t, states.X[:, gas.species_index("H2O")])
plt.xlabel("Simulation time")
plt.legend(["H2O-Mole fraction"])
plt.title("Rate of concentration of H2O")

#Plot Rate of O2 Molar fraction
plt.subplot(1,3,2)
plt.plot(states.t, states.X[:,gas.species_index("O2")])
plt.xlabel("Simulation time")
plt.legend(["O2-Mole fraction"])
plt.title("Rate of concentration of O2")

#Plot rate of OH Molar fraction
plt.subplot(1,3,3)
plt.plot(states.t, states.X[:, gas.species_index("OH")])
plt.xlabel("Simulation time")
plt.legend(["OH-Molefraction"])
plt.title("Rate of concentration of OH")
plt.suptitle("Rate of change of concentration of H2O, O2 & N2 at" + str(T) + "[Kelvin")
plt.savefig("Plot for 500k")
plt.show()
RESULTS :-
Here we analysed two reports for two different parts-
PART-A
Below we can see the plot of methane under the variation of temperature and constant pressure, the below plots gave the variation of temperature given time.
Observing the plot the temperature increases, as well as ignition delay decreases. At initial temperature needs more time to auto ignite. That we can see below the graph, if the temperature is low, ignition delay is high, and the initial temperature is high, ignition delay is low. As compared to the pressure the ignition delay is faster because of temperature high. It may help to the auto ignition.
CASE-1 :- At constant pressure-
1. Ignition delay vs temperature :-
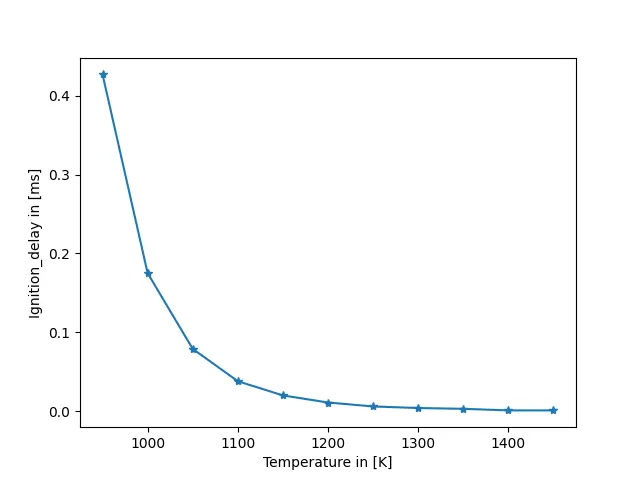
Above figure predicts that, ignition delay vs temperature. The graph change is in parabolic. As temperature increases, ignition delay decreases and vice versa. At the start ignition delay decreases very fastly and later on tends to constant. Due to sudden increase in temperature, ignition delay is occure because of unpropar mixture of air fuel or incomplete combustion of air fuel mixture.
2. Temperature vs time :-
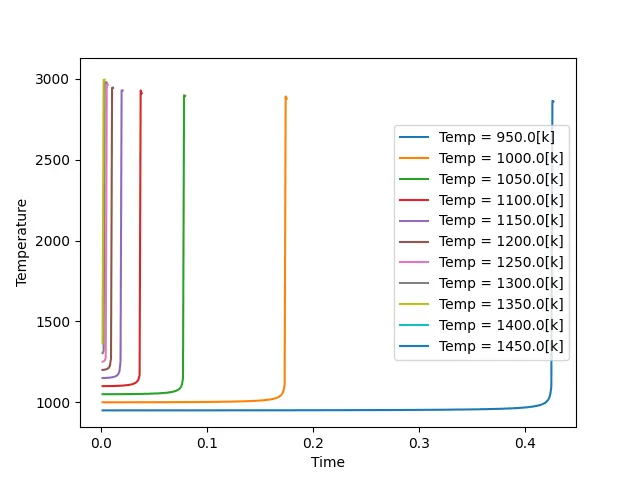
From above figure we can see that, temperature variation at different time. We can see that, temperature change is constant for every time. Here, we analyse that, ignition delay at each time is constant. From left to right, ignition delay increases but, temperature remain constant.
At the start, temperature delay is increases as time decreases.
CASE-2 :- At constant temperature-
1. Ignition delay vs pressure :-
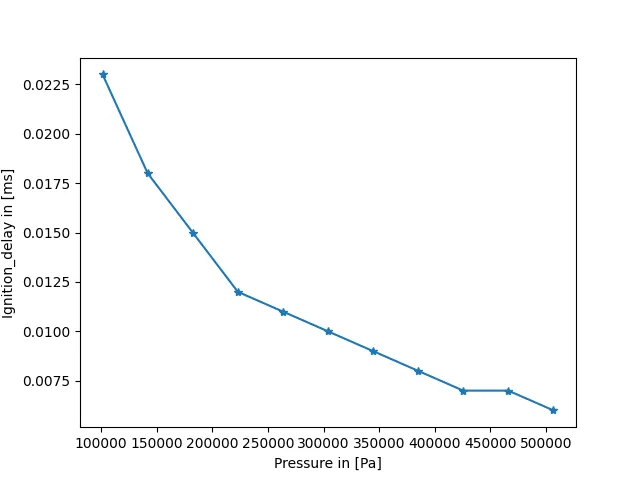
Above figure depicts that, the graph Ignition delay vs pressure. As ignition delay decreases, pressure increases and vice versa. At start ignition delay decreases very fast but, as pressure increases ignition delay decreases dradually. This change is called logarithmic change.
As we know that, temperature is inversaly proportional to the pressure. At the start of igntion delay, temperature is maximum and that why pressure is minimum. Ignition delay decreases slowly as pressure increases.
2. Temperature vs time :-
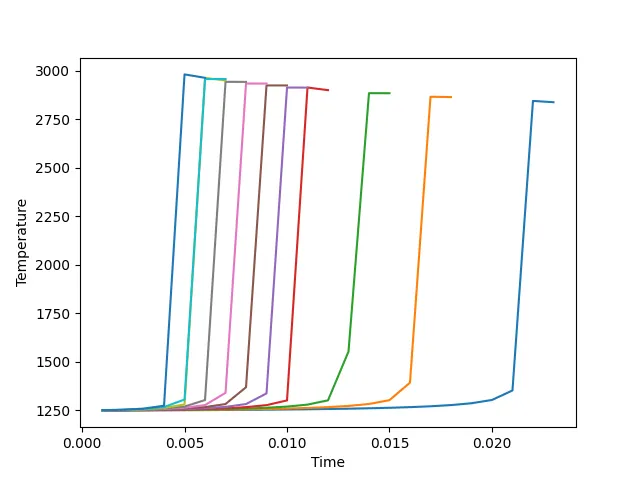
The above graph depicts that, the temperature change is constant for different time scale. At initial time temperature change linearly but, as time increases temperature change logarithically due to delay time. From above figure we can analyse that due to very small delay time temperature change remains constant. From left to right temperature delay time increases linearly.
PART-B
In this case, further observe and print the rate of change of molar concentrations of the given elements H2O, O2 & OH with respect to the time (i.e. simulation time = 10 secs).
CH4 + 2(O2 + 7.52N2) = CO2 + 2H2O + 7.52N2
CASE-1 :-
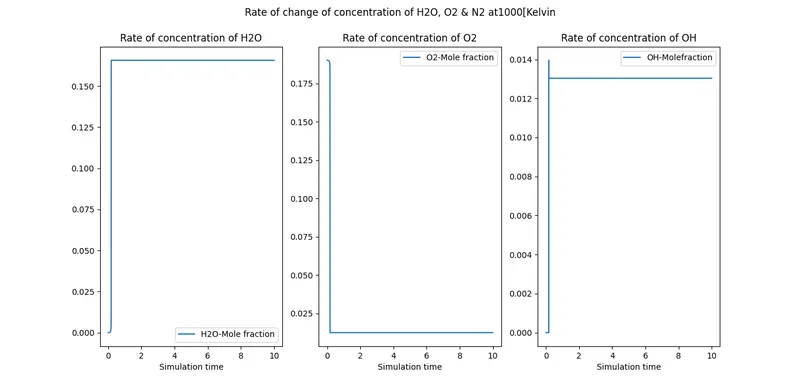
In this case, calculate the molar fraction of product species using cantera.
In the above figure we can see that the rate of the molar fraction of H2O, O2 & OH at 1000k.
The first plot tells the mole fraction of H2O it is respectively very less before auto ignition. As we discussed before the reaction of methane and air it's form the product of H2O and it's starting very less after ignition takes place it becomes increases and somewhere it's gets to stability this is called equilibrium chemistry.
The second plot is to define the mole fraction of O2 it's respectively decreases because it is air and react with fuel and get oxidized.
The third plot tells the mole fraction of OH it is respectively very less before auto ignition. As we discussed before the reaction of methane and air it's form the product of OH and it's starting very less after ignition takes place it becomes increases and somewhere it's gets to stability this is called equilibrium chemistry.
- In first case, H2O mole fraction is maximum at start but it remain constant at peak point for all simulation time.
- In second case, O2 mole fraction minimum at start but it remain constant at lowest point for all simulation time.
- In third case, OH mole fraction is maximum at start and later on remains constant just below the peak point of the start for all simulation time.
CASE-2 :-
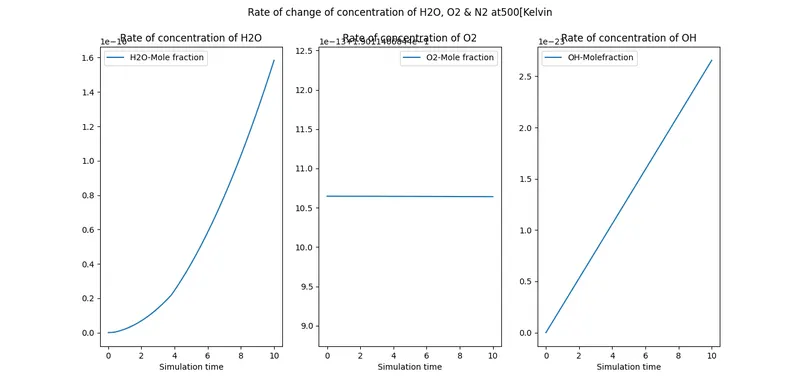
In this case, the calculated molar fraction of H2O, O2 and OH at 500k, the rate mole fraction is very less as compared to the 1000k because the initial temperature was very low. The first plot we see that very slowly auto ignition takes place and the second plot 'O2' Is not completely automise bcause the initial temperature was very low.
- In first case, H2O mole fraction increases parabolically from zero to 1.6 for all simulation time.
- In second case, O2 mole fraction remains constant at 10.7 for all simulation time.
- In third case, OH mole fraction increases linearly from zero to 2.7 for all simulation time.
CONCLUSIONS :-
From above code and it's results we can concluded following points i.e. ignition delay.
1. Ignition delay for constant pressure :-

2. Ignition delay for constant temperature :-

From above output we can clearly analyse that ignition delay is decreases as temperature or pressure increases and vice versa.
- Ignition delay is maximum for constant pressure and it decreases fastly.
- Ignition delay is comparitevely lower for constant temperature and it decreases slowly.
- Ignition delay is occure due to temperature or pressure difference also incomplete burning of air fuel mixture or lean or reach mixture.
In this way, I write the code for different casses like constant temperature or constant pressure. From that code, plot the graph and write result and conclusions as shown in above figure. Also, compare ignition delay time for constant temperature and constant pressure.