Fuel cell powered vehicle model
Objective: To Model a fuel cell powered electric vehicle in MATLAB and analyse on the obtained results.
Theory:
What is a fuel cell ?
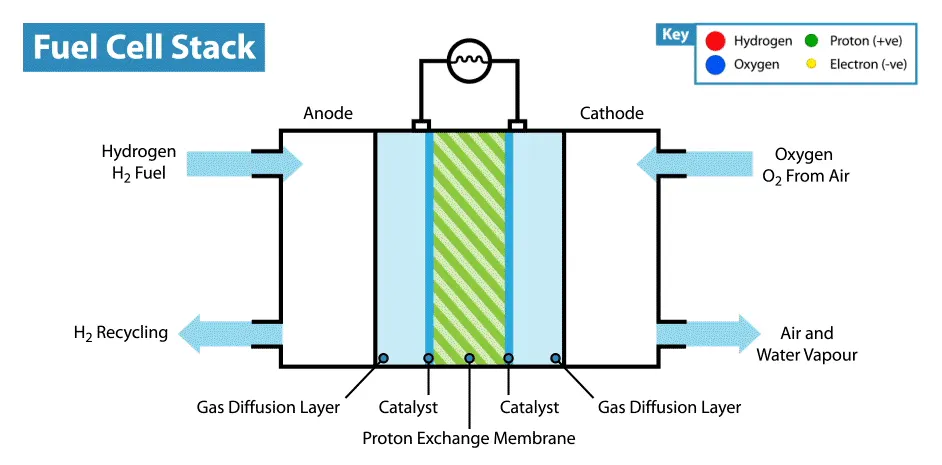
A fuel cell uses the chemical energy of hydrogen or another fuel to cleanly and efficiently produce electricity. Fuel cells are unique in terms of the variety of their potential applications; they can provide power for systems as large as a utility power station and as small as a laptop computer.
Working of a fuel cell:
Fuel cells work like batteries, but they do not run down or need recharging. They produce electricity and heat as long as fuel is supplied. A fuel cell consists of two electrodes—a negative electrode (or anode) and a positive electrode (or cathode)—sandwiched around an electrolyte. A fuel, such as hydrogen, is fed to the anode, and air is fed to the cathode. In a hydrogen fuel cell, a catalyst at the anode separates hydrogen molecules into protons and electrons, which take different paths to the cathode. The electrons go through an external circuit, creating a flow of electricity. The protons migrate through the electrolyte to the cathode, where they unite with oxygen and the electrons to produce water and heat.
How do fuel cell electric vehicle work using hydrogen ?
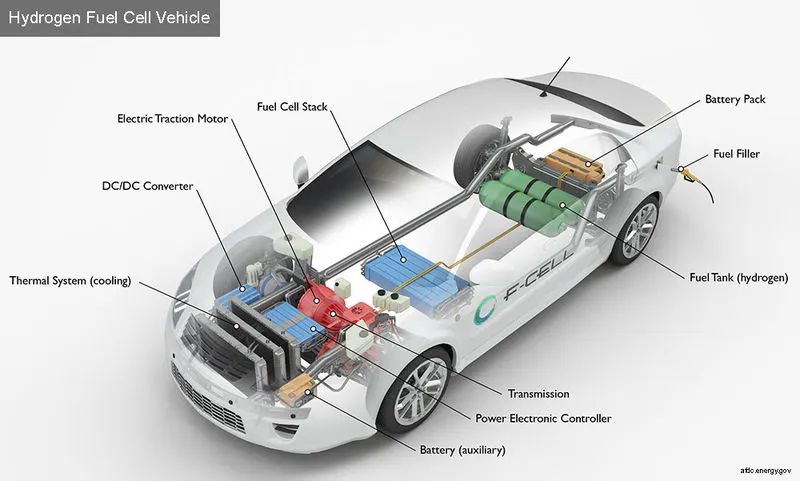
Like all electric vehicles, fuel cell electric vehicles (FCEVs) use electricity to power an electric motor. In contrast to other electric vehicles, FCEVs produce electricity using a fuel cell powered by hydrogen, rather than drawing electricity from only a battery. During the vehicle design process, the vehicle manufacturer defines the power of the vehicle by the size of the electric motor(s) that receive electric power from the appropriately sized fuel cell and battery combination. Although automakers could design an FCEV with plug-in capabilities to charge the battery, most FCEVs today use the battery for recapturing braking energy, providing extra power during short acceleration events and to smooth out the power delivered from the fuel cell with the option to idle or turn off the fuel cell during low power needs. The amount of energy stored onboard is determined by the size of the hydrogen fuel tank. This is different from an all-electric vehicle, where the amount of power and energy available are both closely related to the battery's size.
Procedure:
By Typing power_fuel_cell in the matlab command window we get the below model to analyse the results.
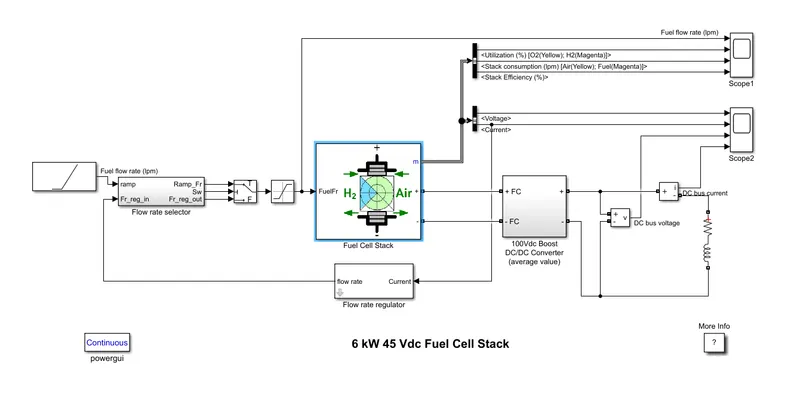
Fuel Cell Stack:
The Fuel Cell Stack block implements a generic model parameterized to represent most popular types of fuel cell stacks fed with hydrogen and air.
The block represents two versions of the stack model: a simplified model and a detailed model.
The above model represents the 6 kW 45 Vdc Fuel Cell Stack.
Plottings Obtained for this model:
for fuel stack
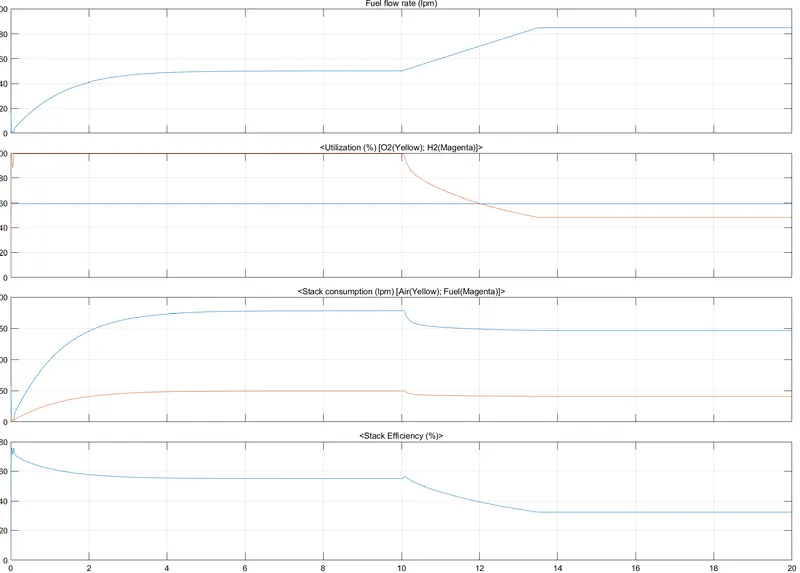
Here from the above fuel stack plotting we have four different sub-plots in it namely fuel flow rate, utilization of oxygen and hydrogen, stack consumption of air and fuel, and stack efficiency percent.
starting with the fuel flow rate it starts from it's initial point 10 and maintained a slight increment in it's flow following the path. In the case of consumption of oxygen and hydrogen. Oxygen was utilized more compared to hydrogen and rate of utilization of hydrogen was constant at a rate of 80. In the case of stack consumption of air and fuel. Fuel has a more consumption rate compared than air in the case of stack consumption. In the case of stack efficiency the percentage of stack efficiency got fall down from the point 75% to 10% on the basis of it's working.
for voltage and current
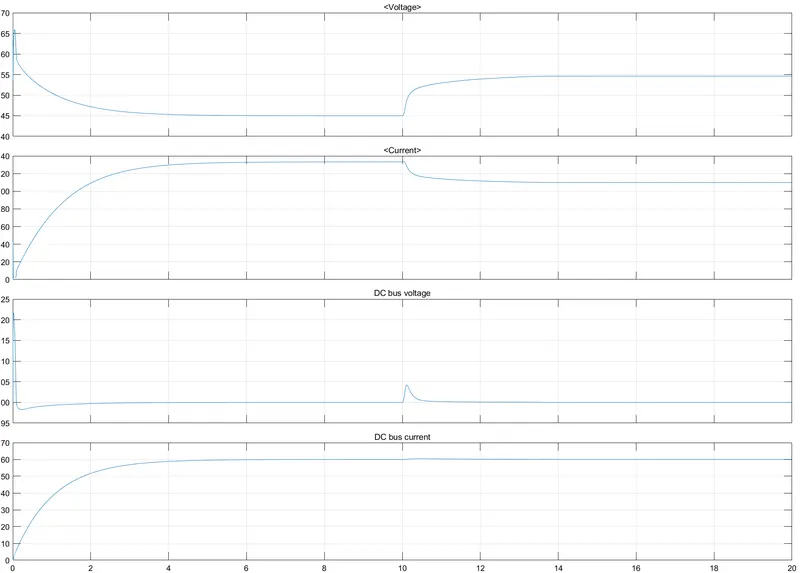
Here from the above voltage and current plotting we have four different sub-plots in the plot namely Voltage, Current, DC Bus voltage, DC bus currrent.
Starting with the Voltage the measurement of the voltage took place from the initial point 55 and flactuated in between the cycle and had a setback at the same point in the final. In the case of current measurement it started eith the point 40 and had a rise up to 130 according to the efficiency and ended up at a point 110. In the case of DC Bus voltage it measuring the instantaneous voltage between two electric nodes whereas in the case of DC Bus current it is measuring the instantenous current flowing in the electrical block whereas in this case it is from the initial pont 0 to the final point 60.
Now, In order to model a fuel cell stack for a vehicle we require a certain data which is nothing bur drive cycle data. Here in this case now we import the UDDS drive cycle data and compare the fuel stack efficiency with the vehicle.
Replacing Signal Builder with ramp block
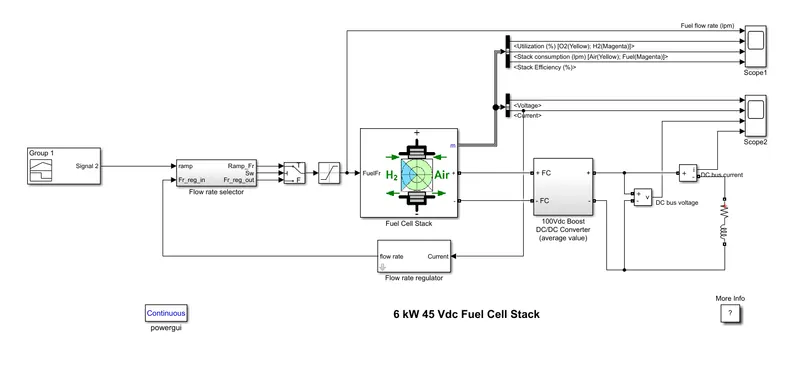
Blocks used to build the model:
Signal Builder:
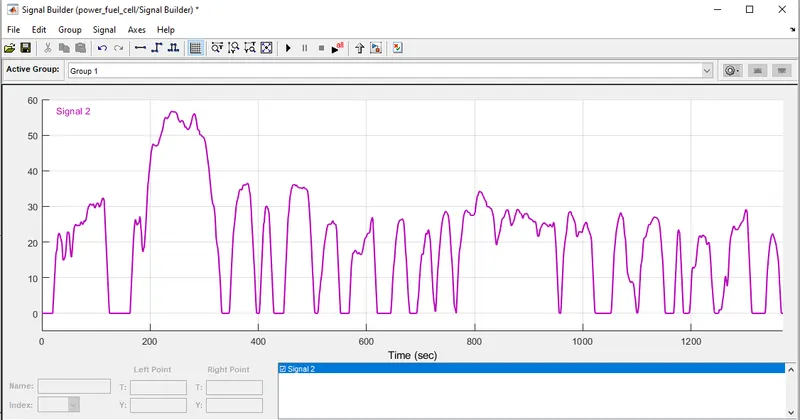
The Signal Builder block allows you to create interchangeable groups of piecewise linear signal sources and use them in a model. You can quickly switch the signal groups into and out of a model to facilitate testing. In the Signal Builder window, create signals and define the output waveforms.In this case we have have imported our UDDS drive cycle data in it.
Switch:
The Switch block passes through the first input or the third input signal based on the value of the second input. The first and third inputs are data input. The second input is a control input.
Saturation:
The Saturation block produces an output signal that is the value of the input signal bounded to the upper and lower saturation values. The upper and lower limits are specified by the parameters Upper limit and Lower limit.
Fuel Cell Stack:
The Fuel Cell Stack block implements a generic model parameterized to represent most popular types of fuel cell stacks fed with hydrogen and air.
The block represents two versions of the stack model: a simplified model and a detailed model.
The above model represents the 6 kW 45 Vdc Fuel Cell Stack.
Voltage Measurement:
The Voltage Measurement block measures the instantaneous voltage between two electric nodes. The output provides a Simulink signal that can be used by other Simulink blocks.
Current Measurement:
The Current Measurement block is used to measure the instantaneous current flowing in any electrical block or connection line. The Simulink output provides a Simulink signal that can be used by other Simulink blocks.
Bus Selector:
The Bus Selector block outputs the elements we select from the input bus. The block can output the selected elements separately or in a new virtual bus.
Series RLC Branch:
The Series RLC Branch block implements a single resistor, inductor, or capacitor, or a series combination. we Use the Branch type parameter to select elements we want to include in the branch. Negative values are allowed for resistance, inductance, and capacitance.
Scope:
The Scope allows us to adjust the amount of time and the range of input values displayed. we can move and resize the Scope window and can modify the Scope's parameter values during the simulation.
Continuous powergui:
The powergui block allows us to choose one of these methods to solve our circuit:
-
Continuous, which uses a variable-step solver from Simulink
-
Discretization of the electrical system for a solution at fixed time steps
-
Continuous or discrete phasor solution
Plottings obtained after replacing with Drive cycle data:
Plotting obtained for fuel flow rate, Utilization of H2 and O2, Stack consumption of air and fuel, stack efficiency.
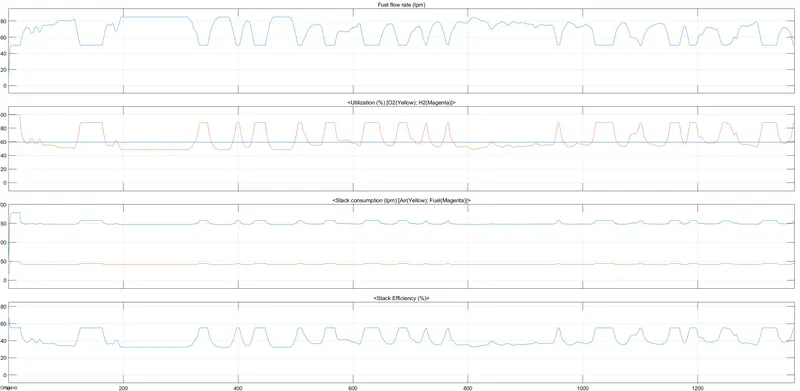
Fuel flow rate: The fuel flow rate of the fuel cell stack has been plotted on the basis of drive cycle given to it as a reference with the time and speed of the vehicle. so in this case fuel flow rate of the fuel cell stack is started from the initial point 0 to the final point 50 and fluctuations in between up and down according to the speed and time reference alloted in the drivecycle
Hydrogen and Oxygen Used in %: The hydrogen and oxygen utilization is based on the drive cycle given to it as a reference with and time and speed. whereas in this case oxygen is utilized more compared to the hydrogen. oxygen has started initially from the point 100 and fluctuated in between and reached final position at a point of 90. whereas in the case of hydrogen it was constant through out the utlization with a stable point 60 from the initial to the final.
Stack consumption of Air and fuel: Here in the case of stack consumption of air and fuel the stack consumption of fuel flow rate is more compared to the stack consumption of the air with the reference of the drive cycle data of time and speed given to it.
Stack efficiency: The stack efficiency is the over all efficiency of the fuell cell performance in terms of percentage. In this case the plotting defines the stack efficiency of the fuel cell overall from initial point to the final point.
Plottings obtained for Voltage, current, DC Bus voltage, DC Bus current
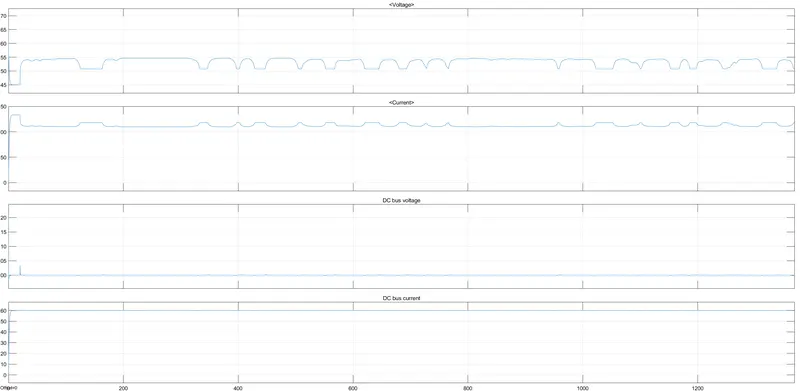
Voltage: This plotting defines the voltage used in a vehicle according to the drive cycle reference given to it and the voltage rate is measures accordingly.
Current: The rate of current is also measured in this according to the drive cycle data given to it as a reference and current measurement took place accordingly.
DC Bus Voltage: This plot is defining the voltage measurement of the instantaneous voltage between the two electric nodes in the cycle.
DC Bus Current: This plot is defining the current measurement of the instantaneous current flowing in an electrical block or in a conection line.
Conclusion: Therefore, The fuel cell is modelled in a MATLAB and analyzed the obtained results.
Drive cycle data reference link:
https://www.epa.gov/sites/production/files/2015-10/uddscol.txt
The above link denotes the drive cycle data taken as reference in order to run the simulation for this power fuel cell model.