Week 6 Fuel cell powered vehicle model
Aim:- Fuel cell powered vehicle model
Object:-
Make a MATLAB model of fuel cell powered electric vehicle and comment on results.
What is a fuel cell electric vehicle?
FCEVs use a propulsion system like that of electric vehicles, where energy stored as hydrogen is converted to electricity by the fuel cell. Unlike conventional internal combustion engine vehicles, they produce no harmful tailpipe emissions.
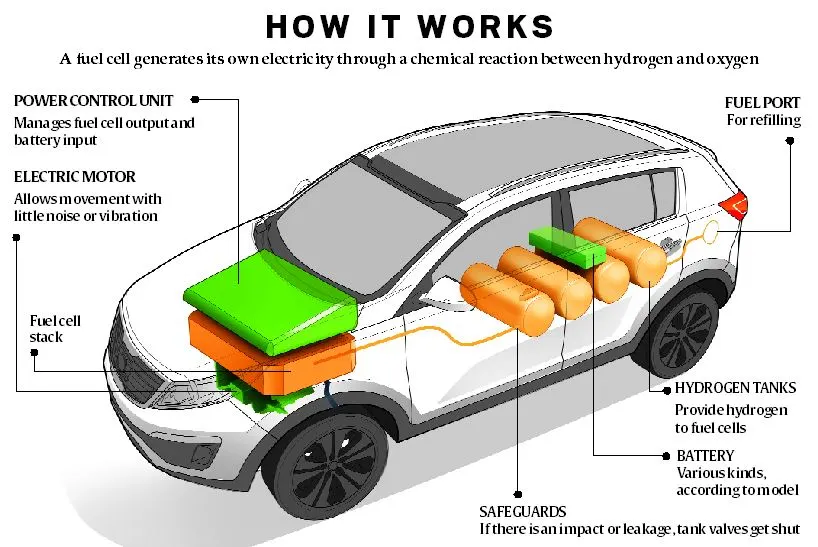
The most common type of fuel cell for vehicle applications is the polymer electrolyte membrane (PEM) fuel cell. In a PEM fuel cell, an electrolyte membrane is sandwiched between a positive electrode (cathode) and a negative electrode (anode). Hydrogen is introduced to the anode, and oxygen (from air) is introduced to the cathode. The hydrogen molecules break apart into protons and electrons due to an electrochemical reaction in the fuel cell catalyst. Protons then travel through the membrane to the cathode.
Fuel cells have been used in various kinds of vehicles including forklifts, especially in indoor applications where their clean emissions are important to air quality, and in space applications. The first commercially produced hydrogen fuel cell automobile, the Hyundai Tucson FCEV, was introduced in 2013, Toyota Mirai followed in 2015 and then Honda entered the market. Fuel cells are being developed and tested in trucks, buses, boats, motorcycles and bicycles, among other kinds of vehicles.
Fuell Cell Model:-
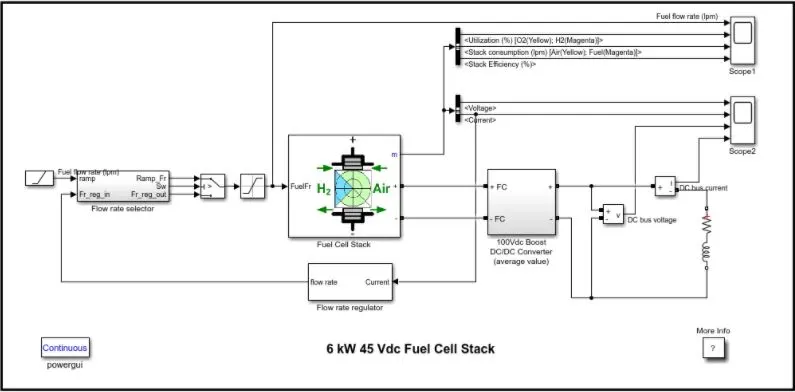
Let us understand each of the block in brief to get clear.
1. Ramp:
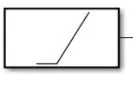
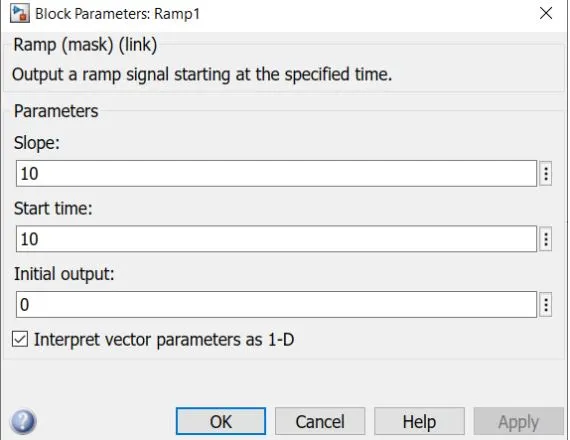
Generate constantly increasing and decreasing signal. The ramp block generates a signal that starts at a specified time and value and changes by a specified rate. The blocks Slope, Start Time and Initial Time parameters determine the characteristics of the output signal. All must have the same dimension after scalar expansion.
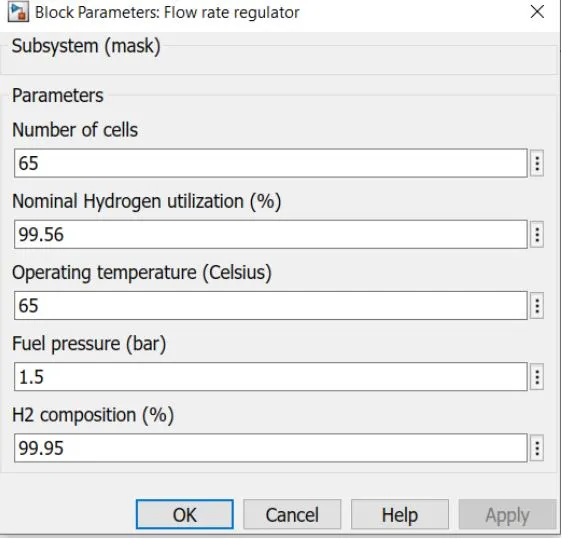
2. Flow Rate Regulator:
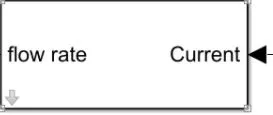
Flow Rate Regulate the Flowrate of our input by taking output as a feedback.
2. Flow Rate Selector:
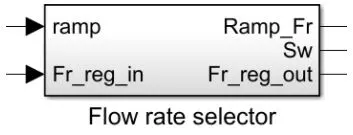
As per the name, it selects the and proceed out the required output, for any input to understand this block more clearly.
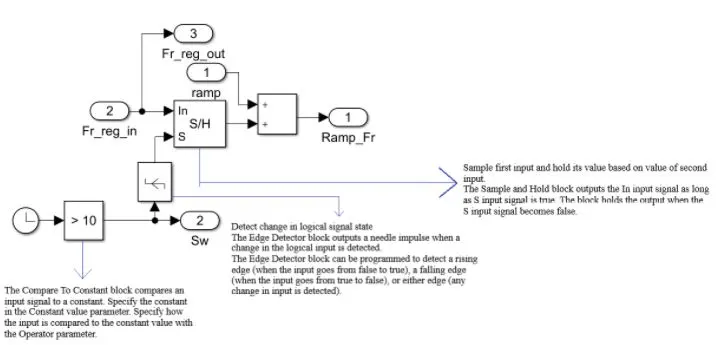
The circuit have a clock which output the current simulation time A compare to constant block is setted up, which let the signal start after 10 seconds as it is usinf >10 operator and pass it to the Edge Detector which detect the change of 10. Now the signal goes into Sample and Hold block where the holds it and pass it according to the values. Here circuit have 2(Fr_reg_in) for input, if it does not satisfy, then will go into 3(Fr_reg_out).
4. Swicth:
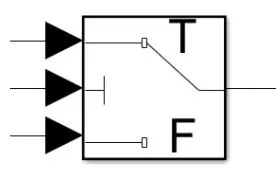
Combine multiple signals into single signal. The switch block passes through the first input or the third input signal based on the value of the second. The first and third inputs are data input. The second input is a control input. Specify the condition under which the block passes the first input using the Criteria for passing first input and threshold parameters.
5. Saturation:
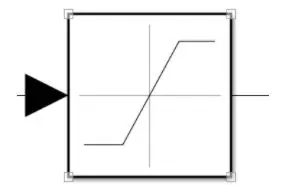
Limit input signal to the upper and lower saturation values. The Saturation block produces an output signal that is the value of the input signal bounded to the upper and lower saturation values. The upper and lower limits are specified by the parameters Upper Limit and Lower Limit.
We are taking Upper limit as 95 and Lower limit as 0.
6. Fuel Cell Stack:
The Fuell Cell Stack implements a generic model parameterized to represent most popular types of fuel cell stack fed with hydrogen and air. The block represents two versions of the stack model a simplified model and a detailed model. You can switch between the two models by selecting the level in the mask under Model details level in the blok dialog box
Here, we are taking detainled model level. with a pre-defined model of PEMFC-6KW-45Vdc, see the Parameters of the fuell cell stack.
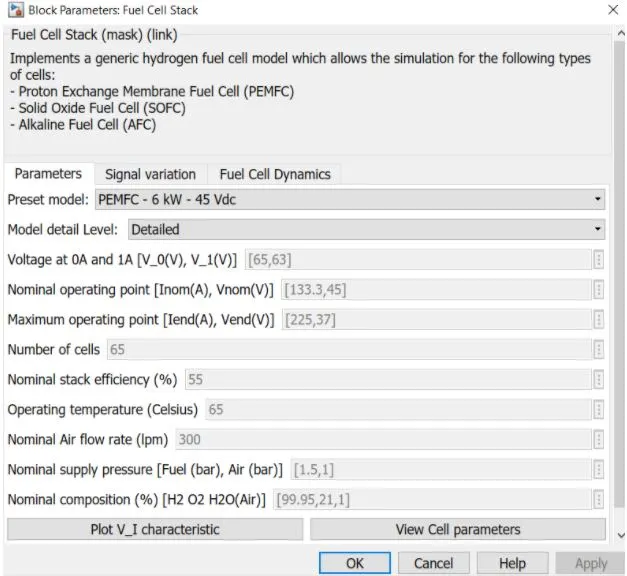
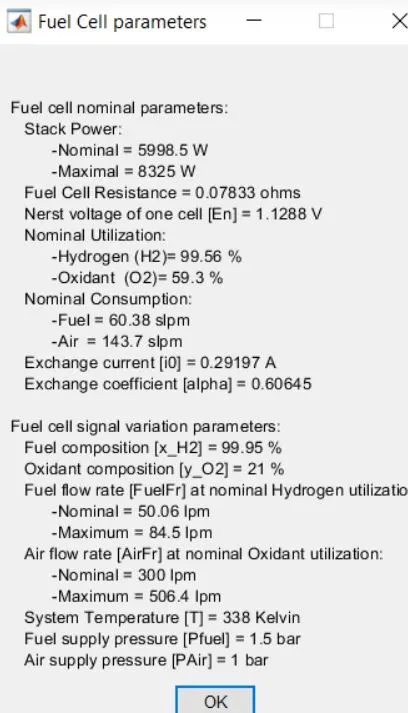
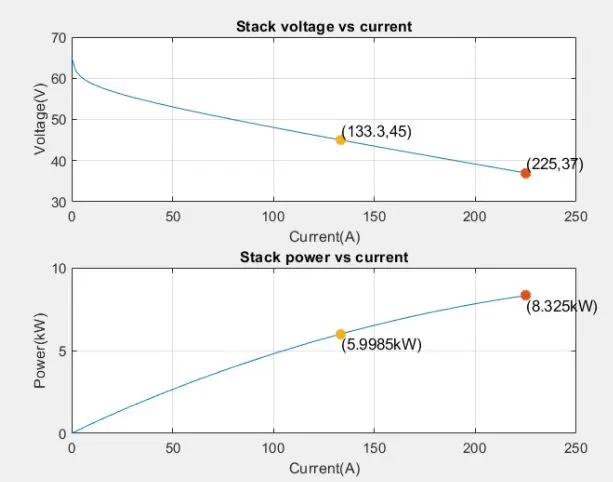
The Nominal operating point is taken as(V,I)=(133.3,45) & (P,I)= (5.9985, 133.3)
Similarly, Maximum operating points (V,I)=(225,37) & (P,I) = (8.325,225)
7. DC/DC Boost Converter:
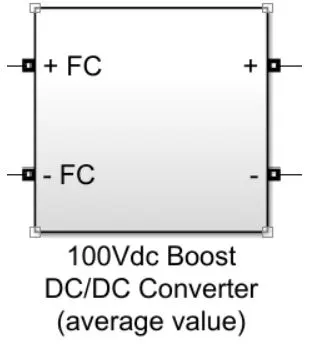
A DC/DC Boost Converter Boosts the Voltage by, Compromising Current.
OUTPUT SIMULATED RESULTS:
Taking Simultion Run Time: 20 Sec.
At t=0 s, the DC/DC converter applies 100Vdc to the RL load (the initial current of the load is 0A). The fuel uilization is set to the nominal value of 99.56%. The current increases to the value of 133A. The flow rate is automatically set in order to maintain the nominal fuel utilization. Observe the DC bus voltage scope-2 which is very well regulated by the converter. The peak voltage of 122Vdc at the begning of the simulation is caused by the transient state of the voltage regulator.
At t=10s, the fuel flow rate is increased from 50 liters per minute to 95lpm during 3.5s reducing by doing so the hydrogen utilization. This caused an increasing of the Nernst voltage so the fuell cell current will decrease. Therefore the stack consumption and the efficiency will decrease scope-1.
Scope-1
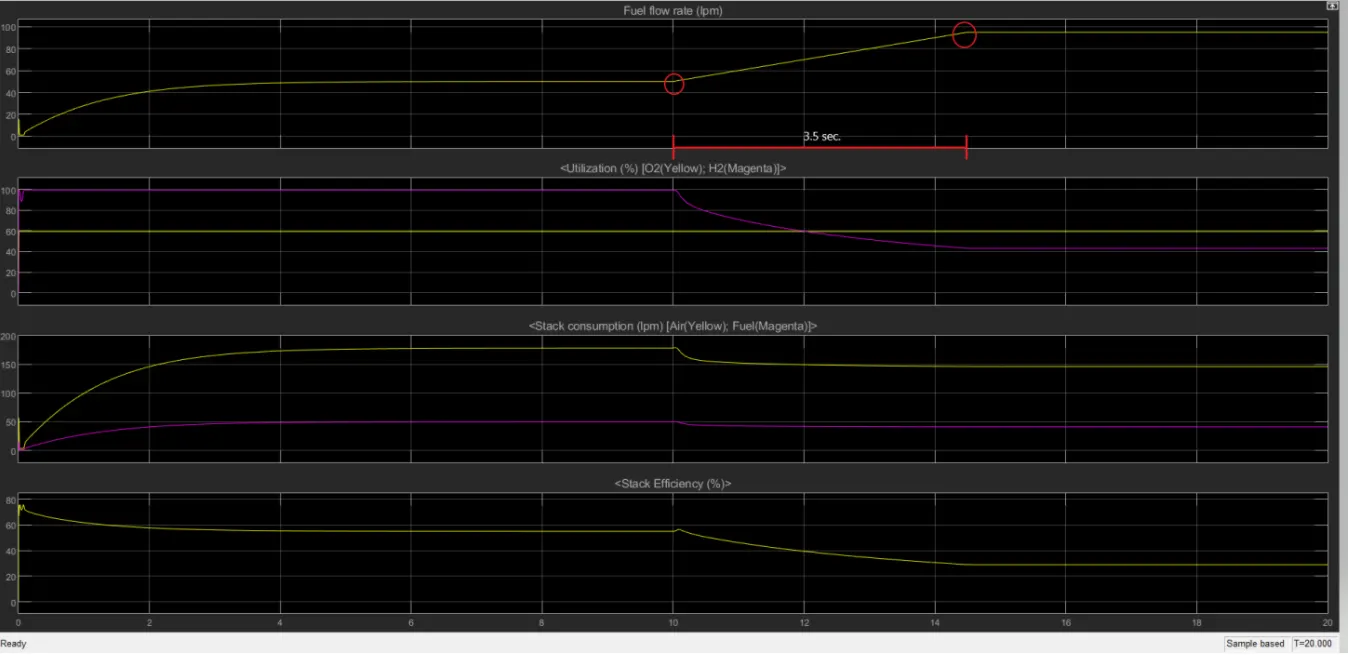
1. FLOW RATE(lpm): From 0 to 10 sec. of the time, the flow rate starts increasing and remains constant, until it reaches 50 lpm. After 10sec. of the time. The flow rate increases upto 95lpm which is attrained in 3.5 sec. of the total time.
We are controlling the voltage and current required for the system by changing the flow rate of the Hydrogen and oxygen.
2. UTILIZATION(%): As the Flow rate is increased to 95lpm, there can be seen a reduction in the utilization of Hydrogen 100% to 42%. Whereas, Oxygen remains constant with value of 60%.
3. STACK CONSUMPTION(lpm): We can see in the plot that, upto 10 sec. the oxygen and hydrogen consumption gradually increases and remains constant upto 10 sec. again after 10 sec. the hydrogen and oxygen consumption decreases and remains constant.
4. STACK EFFICIENCY(%): At time t = 0 due to transient state the efficiency first increases and then decreases and remains constant, with the constant stack consumption. Efficiency again, decreases and remains constant after 10 sec.
Scope-2
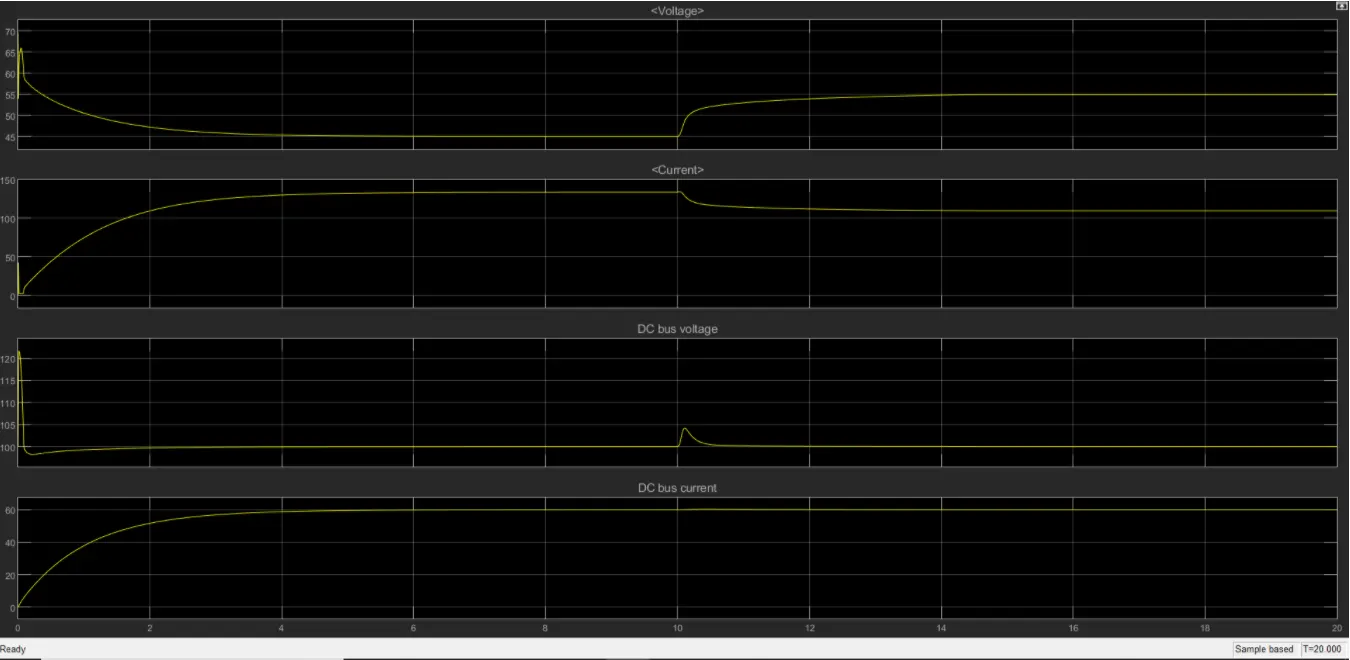
1. VOLTAGE AND CURRENT: Both voltage and current changes its values due transient state. We can see voltage gets down and remains constant, whereas current goes up gradually and remains constant. Upto 10 sec. of simulation. After 10 sec with the increases in flow rate voltage of the system incraeses and to compensate with that current value got decreased.
2. DC BUS VOLTAGE AND CURRENT: The only change in voltage and current can be seen at transient state of the system. Otherwise, there is no change in the DC Bus Voltage, as DC/DC Converter of 100Vdc is taken into consideration.