Week 6 - Data analysis
AIM :
To Write code in PYTHON that can solve data visualization, compatibility check and basic performance calculation.
OBJECTIVE:
To perform Data Analysis.
Plot a graph between any two Column vectors.
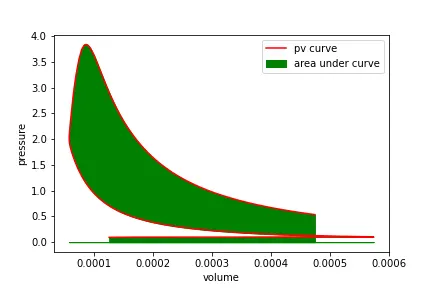
Calculate the area under the P-V diagram.
Calculate the power output of this engine.
Calculate engine specific fuel consumption.
CODE:
import matplotlib.pyplot as plt
import numpy as np
# Initializing empty lists for storing the data
value1 = []
value2 = []
pressure = []
volume = []
label1 = ""
label2 = ""
# Enter the name of the CONVERGE output file
file_name = input("Enter the file name in .out format: ")
# Checking the file name and conditions
if file_name == 'engine_data.out':
with open(file_name, 'r') as file:
lines = file.readlines()
# Extracting labels and units from specific lines
labels = lines[2].split()
units = lines[3].split()
print('List of parameters available for plotting:')
for i, (label, unit) in enumerate(zip(labels[1:], units[1:]), start=0):
print(f"{i}. {label} {unit}")
# User input for parameters for x and y axes
a = int(input("Enter the parameter index for the x-axis: "))
b = int(input("Enter the parameter index for the y-axis: "))
# Reading data and appending to respective lists
for line in lines[5:]: # Start reading from the 6th line
data = line.split()
value1.append(float(data[a]))
value2.append(float(data[b]))
pressure.append(float(data[1]))
volume.append(float(data[7]))
#calculating the area under the P-V diagram using trapz(y,x)
area=np.trapz(pressure,volume)*1000
print('Area under the P-V diagram: ',area,'J')
#calculating the power output of the engine (assuming a RPM of 1500 and 4-stroke)
N = 1500 #engine RPM
n = 2 #no. of revolution per cycle in four stroke engine
power=(area*N)/(n*746)
print('Power: ',power,'HP')
#calculating the engine specific fuel consumption (assuming it consumes 20gm of fuel in one stroke)
fc = 20 #fuel consumed per cycle in micro gram
ffr = (fc*(N/n))/1000000 #fuel flow rate
sfc= ffr/power
print('fuel flow rate: ',ffr,'g/m')
print('Specific Fuel Consumption: ',sfc,'g/hp-m')
# Assigning labels for axes
label1 = labels[a + 1] + f" {units[a + 1]}"
label2 = labels[b + 1] + f" {units[b + 1]}"
# Plotting the data
plt.plot(value1, value2)
plt.xlabel(label1)
plt.ylabel(label2)
plt.title(f"Plot of {label2} vs {label1}")
plt.savefig(f"{label2}vs{label1}.png")
plt.show()
#plotting area under PV
plt.plot(volume,pressure,color='red',label='pv curve')
plt.fill_between(volume, pressure,color='green',label='area under curve')
plt.xlabel("volume")
plt.ylabel("pressure")
plt.legend()
plt.savefig("area under PV curve")
plt.show()
else:
print('File not recognized. Please provide a valid CONVERGE output file')
RESULT:
plotting list and output results for area under the pv curve, power, specific fuel consumption.
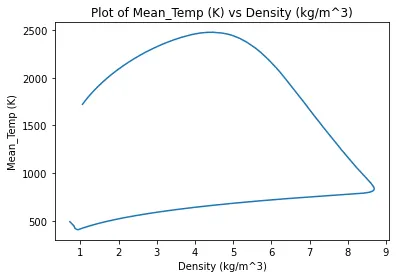
Mean_Temp (K) VS Density (kg/m^3)
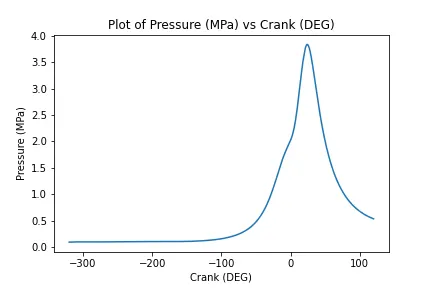
Pressure (MPa) VS Crank (DEG)
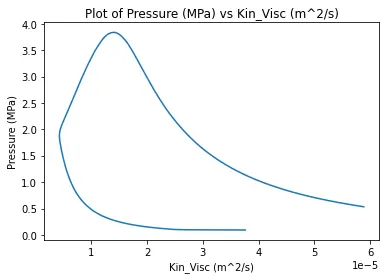
Pressure (MPa) VS Kin_Visc (m^2/s)
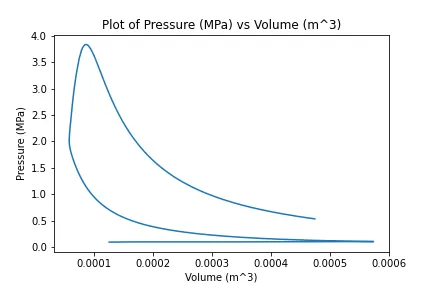
Pressure (MPa) VS Volume (m^3)
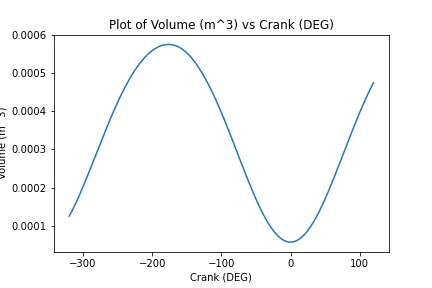
Volume (m^3) VS Crank (DEG)
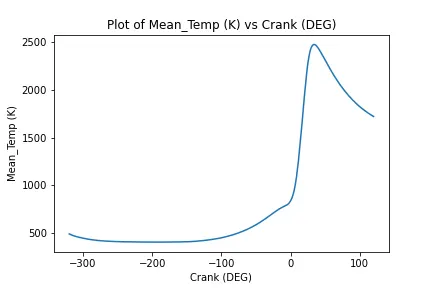
Mean_Temp (K) VS Crank (DEG)
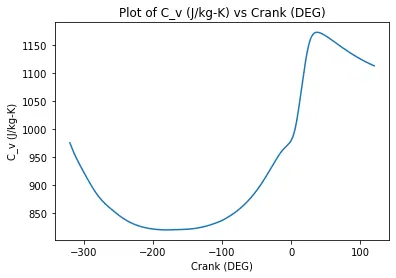
C_v (J/kg-K) VS Crank (DEG)
C_p (J/kg-K) VS Crank (DEG)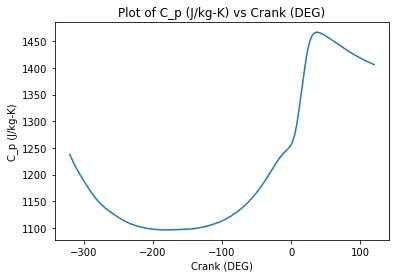
Area under PV curve
RESULT :
Hence the data analysis using the large no. of data points and the visualization graph is shown according to the user inputs.