Week 6 - Data analysis
Ans:- Data visulize;-
"""
Demonstratiing file parsing in python
"""
#import modules
import matplotlib.pyplot as plt
#Basic intialization
line_count=1
crank=[]
pressure=[]
temprature=[]
#file parsing
for line in open('engine_data.out'):
if'#' not in line:
crank.append(float(line.split()[0]))
pressure.append(float(line.split()[1]))
temprature.append(float(line.split()[4]))
line_count=line_count+1
# figure
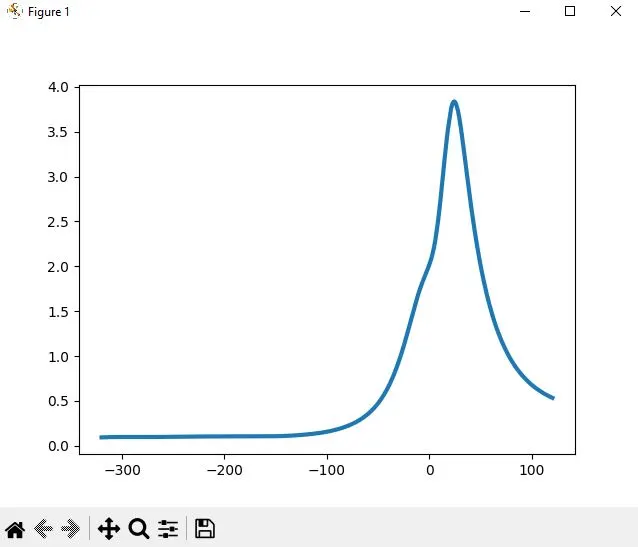
plt.plot(crank,pressure,linewidth=3)
plt.show()
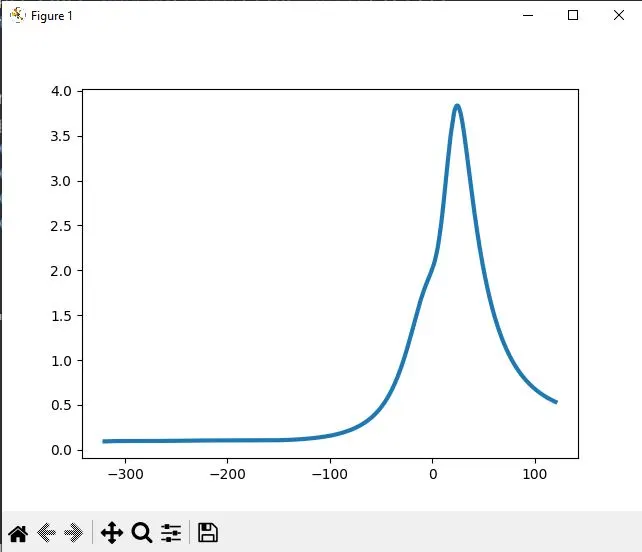
plt.plot(crank,temprature,linewidth=4)
plt.show()
Results:-
2nd program :-
import matplotlib.pyplot as plt
import numpy as np
import sys
# Function to check file compatibility
def is_valid_file(filename):
try:
with open(filename, 'r') as f:
header = f.readline()
if "CONVERGE" not in header: # Check if it's a valid CONVERGE file
print("File not recognized. Please provide a valid CONVERGE output file.")
return False
return True
except Exception as e:
print(f"Error reading file: {e}")
return False
# Function to parse the file and extract data
def parse_file(filename):
data = []
labels = []
with open(filename, 'r') as f:
# Extract labels from the header (assuming it's the second line)
labels = f.readline().split() # Modify this based on file structure
for line in f:
if '#' not in line: # Ignore comments
data.append([float(x) for x in line.split()])
return np.array(data), labels
# Function to plot the data
def plot_data(data, labels, col1, col2):
try:
x_data = data[:, col1 - 1]
y_data = data[:, col2 - 1]
plt.figure()
plt.plot(x_data, y_data, label=f"{labels[col1 - 1]} vs {labels[col2 - 1]}")
plt.xlabel(labels[col1 - 1])
plt.ylabel(labels[col2 - 1])
plt.title(f"{labels[col1 - 1]} vs {labels[col2 - 1]}")
plt.legend()
plt.grid(True)
plt.savefig(f"{labels[col1 - 1]}_vs_{labels[col2 - 1]}.png")
plt.show()
except Exception as e:
print(f"Error plotting data: {e}")
# Function to calculate area under the P-V curve (assuming columns 2 and 8 for P and V)
def calculate_area(data, p_col, v_col):
P = data[:, p_col - 1]
V = data[:, v_col - 1]
area = np.trapz(P, V)
return area
# Function to calculate power and specific fuel consumption
def calculate_performance(data, p_col, v_col, rpm, fuel_mass):
# Area under P-V diagram (in joules per cycle)
area = calculate_area(data, p_col, v_col)
# Power calculation (assuming 4-stroke engine, so power per 2 revolutions)
power_output = (area * rpm) / (2 * 60) # Convert to Watts
# Specific fuel consumption (SFC) = fuel mass / power output
sfc = (fuel_mass * 1e-6) / power_output # fuel mass in grams
return power_output, sfc
# Main function
def main():
# Input: filename, columns, RPM, fuel consumption
filename = 'engine_data.out' # replace with input filename
col1, col2 = 1, 8 # replace with dynamic input for plotting
rpm = 1500
fuel_mass = 20 # in micrograms
# Check file compatibility
if not is_valid_file(filename):
sys.exit()
# Parse the file and get data
data, labels = parse_file(filename)
# Plot the data
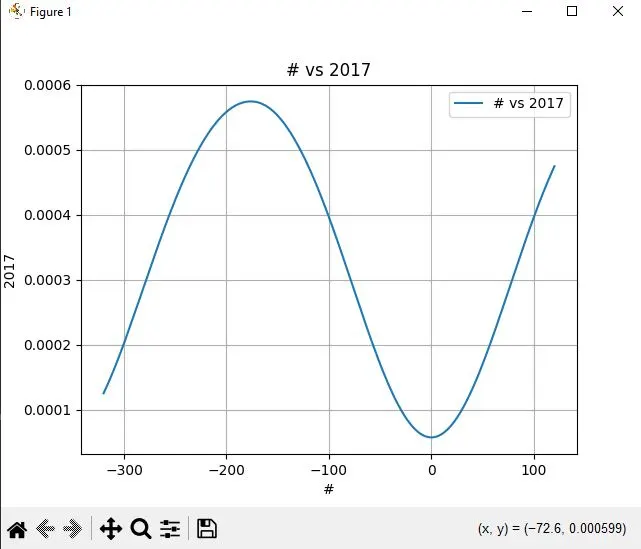
plot_data(data, labels, col1, col2)
# Calculate performance
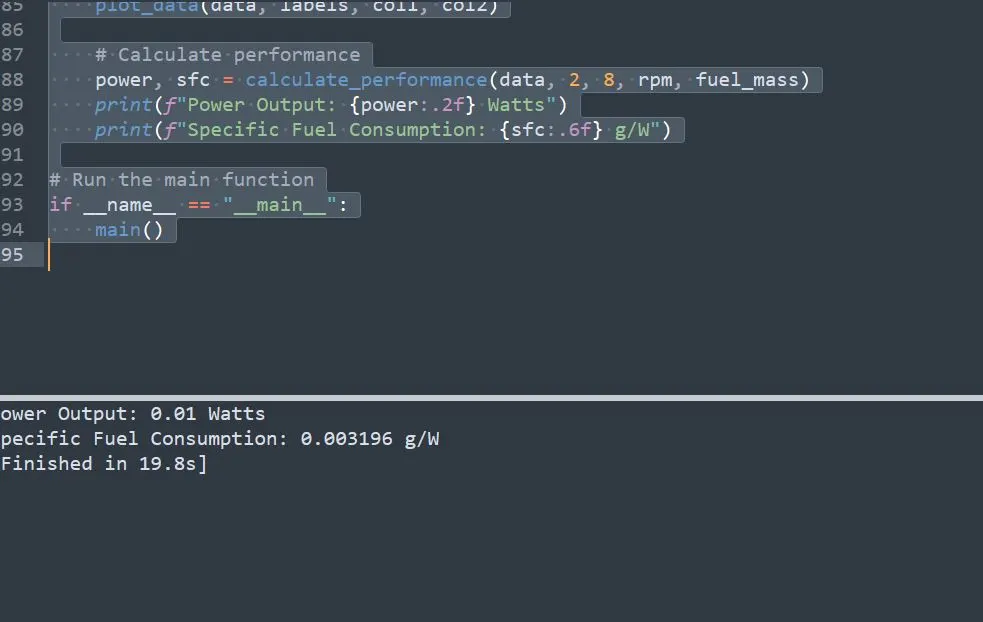
power, sfc = calculate_performance(data, 2, 8, rpm, fuel_mass)
print(f"Power Output: {power:.2f} Watts")
print(f"Specific Fuel Consumption: {sfc:.6f} g/W")
# Run the main function
if __name__ == "__main__":
main()
Results :-