Write a python code to analyse the engine data and make various plots.
Aim:
- Write a python code to analyse the data given & obtain plots from the file.
- Calculate the area under the P-V diagram. P is in column 2 and V is in column 8.
- Calculate the power output of this engine. Assume that RPM is 1500
- Calculate its specific fuel consumption.
Theory:
Data analysis- Data analysis is defined as a process of cleaning, transforming, and modeling data to discover useful information for business decision-making. The purpose of Data Analysis is to extract useful information from data and taking the decision based upon the data analysis.
Whenever we take any decision in our day-to-day life is by thinking about what happened last time or what will happen by choosing that particular decision. This is nothing but analyzing our past or future and making decisions based on it. For that, we gather memories of our past or dreams of our future. So that is nothing but data analysis. Now same thing analyst does for business purposes, is called Data Analysis.
Types of Data Analysis: Techniques and Methods- There are several types of data analysis techniques that exist based on business and technology. The major types of data analysis are:
- Text Analysis
- Statistical Analysis
- Diagnostic Analysis
- Predictive Analysis
- Prescriptive Analysis
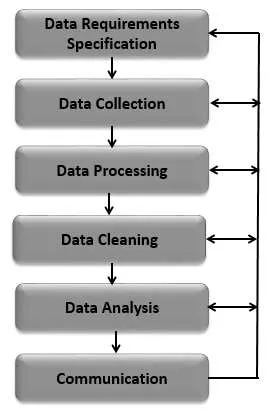
Data Analysis Process- Data Analysis Process is nothing but gathering information by using proper application or tool which allows you to explore the data and find a pattern in it. Based on that, you can take decisions, or you can get ultimate conclusions.
Data Analysis consists of the following phases:
- Data Requirement Gathering
- Data Collection
- Data Cleaning
- Data Analysis
- Data Interpretation
- Data Visualization
First of all, you have to think about why do you want to do this data analysis? All you need to find out the purpose or aim of doing the Analysis. You have to decide which type of data analysis you wanted to do! In this phase, you have to decide what to analyze and how to measure it, you have to understand why you are investigating and what measures you have to use to do this Analysis.
- Data Requirement Gathering- First of all, you have to think about why do you want to do this data analysis? All you need to find out the purpose or aim of doing the Analysis. You have to decide which type of data analysis you wanted to do! In this phase, you have to decide what to analyze and how to measure it, you have to understand why you are investigating and what measures you have to use to do this Analysis.
- Data Collection- After requirement gathering, you will get a clear idea about what things you have to measure and what should be your findings. Now it's time to collect your data based on requirements. Once you collect your data, remember that the collected data must be processed or organized for Analysis. As you collected data from various sources, you must have to keep a log with a collection date and source of the data.
- Data Cleaning- Now whatever data is collected may not be useful or irrelevant to your aim of Analysis, hence it should be cleaned. The data which is collected may contain duplicate records, white spaces or errors. The data should be cleaned and error free. This phase must be done before Analysis because based on data cleaning, your output of Analysis will be closer to your expected outcome.
- Data Analysis- Once the data is collected, cleaned, and processed, it is ready for Analysis. As you manipulate data, you may find you have the exact information you need, or you might need to collect more data. During this phase, you can use data analysis tools and software which will help you to understand, interpret, and derive conclusions based on the requirements.
- Data Interpretation- After analyzing your data, it's finally time to interpret your results. You can choose the way to express or communicate your data analysis either you can use simply in words or maybe a table or chart. Then use the results of your data analysis process to decide your best course of action.
- Data Visualization- Data visualization is very common in your day to day life; they often appear in the form of charts and graphs. In other words, data shown graphically so that it will be easier for the human brain to understand and process it. Data visualization often used to discover unknown facts and trends. By observing relationships and comparing datasets, you can find a way to find out meaningful information.
Basic Calculation Formulas
- A = Area under the P-V curve = Work done per cycle (J)
- Power output = A*n*10^6 W
- n = Number of cycles per second
- n = N/(2*60) For 4-stroke engine
- n = N/60 For 2-stroke engine (N = Rotations per minute)
- SFC (Specific Fuel consumption) = Fuel consumed in kg/hr/Power output in kW
PYTHON CODE:
# Data analysis of engine data

# Importing all the libraries
import numpy as np
import matplotlib.pyplot as plt
from scipy.integrate import simps

#File name as an input from user
filename = input("Enter the name of CONVERGE output filename with the extension(.out): ")

# Compatability check & checking if the file is a valid CONVERGE output file
try:
	f = open(filename)
	f.close()
except FileNotFoundError :
	print('This is not a valid CONVERGE output file.n')
	exit()

# Checking if data is present in the CONVERGE output file
i=0
for line in open(filename):
	if '#' not in line:
		break
	i = i+1

j = 0
for line in open(filename):
	j = j+1
	if j>i:
		break

if j==i:
	print('nN data present in the file.n')
	exit()


# Data extraction & getting number of columns i.e. number of variables
i=0
for line in open(filename):
	if i==2:
		c = line.split() # Storing unit of variables in list c
		i = 0
		break
	if i==1:
		b=line.split() # Storing names of variables in list b
		i = i + 1


	if 'column' in line.split():
		a = line.split() # Storing column numbers of variables in list a
		i = 1


a.remove( "column")  # Removing column from list a
a.remove( "#")   # Removing # from list a
a = np.array(a,dtype=np.int)   # Converting data to integer
b.remove("#")  # Removing # from list b
c.remove("#")  # Removing # from list c
num_col = len(a)  # Number of columns/Number of variables


# Getting Data
num_data = 0      # Initializing Number of data points counter
data = np.arange(0, num_col)
for line in open(filename):
	if '#' not in line:
		d = line.split()  # Storing current data line as a list in d
		d = np.array(d, dtype=np.float32) # Converting list data to float array
		data = np.vstack([data, d])  # 5tacking the float array d in data matrix
		num_data = num_data + 1
data = np.delete(data,0,0) # Deleting the first row used to initilize the array


# Data visualizer
print('n========================================================================')
print('nnInput map ')
for i in a:
	print('n{} for {}'.format(i,b[i-1]))

x = 'n'
print('n========================================================================')
x = input ("Do you want a plot between any two variables? (y/n): ")
while (x.lower() =='y'):
	cn1 = input( "Enter the column number of the variable along x-axis(Refer Input map above): ")
	cn2 = input("Enter the column number of the variable along y-axis (Refer Input map above): ")
	cn1 = int(cn1)
	cn2 = int(cn2)
	plt.figure()
	plt.plot(data[:,cn1-1],data[:,cn2 -1])
	plt.xlabel('{} {}'.format(b[cn1-1],c[cn1-1]))
	plt.ylabel('{} {}'.format(b[cn2-1],c[cn2-1]))
	plt.title('{} {} vs {} {}'.format (b[cn2-1],c[cn2-1],b[cn1-1],c[cn1-1]))
	z = "n"
	z = input("Do you want to save the plot? (y/n):" )
	if(z.lower()=='y'):
		plt.savefig("{}-{}.png".format (b[cn2-1],b[cn1-1]))
	plt.show()
	print('n========================================================================')
	x = input ("Do you want to plot any other two variables? (y/n): ")
print('n=============================================================================')


x ='n'
x = input("Do you want a single variable plot? (y/n): ")
while(x.lower()=='y'):
	cn = input ("Enter the column number of the variable (Refer Input map above): ")
	cn = int(cn)
	plt.figure()
	plt.plot(np.arange(0, num_data), data[:,cn-1])
	plt.xlabel('Data point number')
	plt.ylabel('{} {}'.format(b[cn-1],c[cn-1]))
	Z = "n"
	z = input ( "Do you want to save the plot? (y/n):" )
	if(z.lower()=='y'):
		plt.savefig("{}.png".format(b[cn-1]))
	plt.show()
	print('n=============================================================================')
	x = input ("Do you want ary other single variable plot? (y/n): ")
print('n==========================================================================')


# Basic performance calculation
print('PERFORMANCE OF ENGINE')
b1 = [i.lower() for i in b]
pressure_column = b1.index('pressure')
volume_column = b1.index('volume')
pressure = data[:,pressure_column]
volume = data[:,volume_column]
A = 0  # Area under the P-V curve
A = simps(pressure, volume, even='first')*np.power(10,6)    #  Work per cycle (J)
RPM = input('Enter the RPM of engine at which data was collected: ') # Rotations per min.
f = input('Enter the value of fuel consumed per cycle in micro-grams: ') # fuel consumtion micro-gram per hour
RPM = float(RPM)
f = float(f)
n = RPM/(2*60)  # Number of cycles per second for 4-stroke engine
P = A * n    # Power output (W) at speed N rad/s
f = (f*n*3600)/np.power(10,9) # fuel consumtion kg per hr
sfc = (f*1000)/P # Specific fuel consumtion (kg per hr/kW)
print ('Area under the P-V curve i.e. work done per cycle = {} J'.format(A))
print ('Power output at {} RPM = {} W'.format(RPM,P))
print ('Specific fuel consumption = {} kg/kW.hr'.format (sfc))
PYTHON Code Explanation:
# Importing all the libraries
- The required libraries including matplotlib.pyplot, from scipy.integrate import simps and numpy are imported
# Compatibility check
- The first compatibility test done using try and except function. This code takes the data from a user specified CONVERGE format file. It also checks the file for the correct format i.e. Compatibility.
- If the file is not a CONVERGE output data format then the code will throw an error statement “This is not a valid CONVERGE output file. Also, if the file format is correct but, there is no data present in the file then the code will prompt the user “No data present in the file”.
# Data extraction
- Extracting data along with the column name and column number from the CONVERGE output file. Complete data from the file is stored in a two dimensional array ‘data’. The Columns of data matrix/2D array contains the data for each individual parameter.
- Storing names of variables in list using line.split() in list a,b,c. Converting data to integer using dtype=np.int.
# Getting Data
- Storing current data line as a list in d & converting list data to float array. Now 5tacking the float array d in data matrix using ‘vstack’ and after that deleting the first row used to initialize the array
# Data visualizer
- Now providing an “Input map” to user so that we can use numbers as an input to designate the variables to be plotted.
- Ask user if plot between any two variables is required. If input is ‘y’ representing ‘yes’ then, ask for the numbers representing the variables to be plotted (Referring input map).
- Ask the user if the plot is to be saved. Then, show the plot. Above step is under while loop and runs until user gives an input ‘n’ to the question “Do you want to plot any other variable? (y/n): “.
# Basic performance calculation
- Extract volume and pressure data from matrix ‘data’ and store in array ‘volume’ and ‘pressure’ respectively.
- Next, numerically integrate pressure and volume data using ‘simps’ function (Function for numerical integration by Simpson’s rule) from scipy.integrate library. This integration is area under the P-V curve i.e. work done per cycle.
- Then, RPM of the engine at which the data was collected and fuel consumption in microgram per cycle is taken as user input. Next, the power produced by the engine at this RPM is calculated.
- Finally, the Specific fuel consumption is calculated and Area under the curve, Power output and Specific fuel consumption are displayed.
OUTPUT & RESULTS:
- For output we have to install SublimeREPL package control. The procedure for this is
- In the preference tab go to package control & type there 'Package control-install' & press enter.
- Now from the list of the various packages select SublimeREPL & press enter.
- Than to run the program go to Tools>SublimeREPL>Python>Python-RUN current file.
A) Firstly name of data file is given as input & this results in list of all the parameters in the file
B) Than for plot of PV diagram, we give yes input for the "Do you want a plot between any two variables? (y/n): " and than define the x-axis coloumn number to 8 (Volume from the list generated) and y-axis as 2 (Pressure) and also yes to save the figure.
C) Similarly for other plots we give inputs
- For plot between Cp & Mean Temperature- Give X-axis as number 5 (Mean_Temp) & Y-axis as 13 (Cp).
-
- For plot between Cv & Mean Temperature- Give X-axis as number 5 (Mean_Temp) & Y-axis as 14 (Cv).
- For plot between Crank & Pressure- Give X-axis as number 1 (Crank) & Y-axis as 2 (Pressure).
- For plot between Crank & Volume- Give X-axis as number 1 (Crank) & Y-axis as 8 (Volume).
D) For calculation give no input to both "Do you want a plot between any two variables? (y/n): " and "Do you want a single variables plot? (y/n): " And enter the value of RPM 1500 & engine fuel consumed to 20 micro grams.
Conclusion- The data was analysed and various plots are displayed in the results section & following outputs were obtained-
- Area under the P-V curve (work done per cycle) = 500.58645159307406 J
- Power output at 1500.0 RPM = 6257.330644913426 W
- Specific fuel consumption = 0.00014383129981018482 kg/kW.hr