Week 6 - Data analysis
Data analysis using Python.
AIM: To create a data visualizer tool.
Data visualizer:
- Your script should take column numbers as the input and plot the respective columns as separate images
- Each file should be saved by the name of the column
- The plot labels should be extracted from the file. If I request a plot between column 1 (crank angle) and column 8(volume), then the label information should automatically be extracted and must appear as labels in the plots. THIS SHOULD NOT BE DONE MANUALLY.
Compatibility check:
- Your code should exit gracefully if a non-compatible file is provided as an input. It should say something like "File not recognized. Please provide a valid CONVERGE output file"
Basic performance calculation:
- Calculate the area under the P-V diagram. P is in column 2 and V is in column 8.
- Calculate the power output of this engine. Assume that RPM is 1500
- This engine consumed 20 micrograms of fuel (per 1 stroke cycle). Calculate its specific fuel consumption.
About the Data file:
- There are 17 columns each containing respective information
- 1-crank,2-Pressure, 3-Max_Pressure, 4-Min_Pressure, 5-Mean_Temp, 6-Max_Temp, 7-Min_Temp, 8-Volume, 9-Mass'
'10-density, 11-integrated_HR, 12-HR_Rate, 13-C_p, 14-C_v, 15-Gamma, 16-kinetic Viscosity, 17-Dynamic Viscosity - In that file first 5 rows is the header of the file. Row 3 and 4 having engine parameters title and its units.
- Remaining rows contains values of engine parameters.
Procedure:
- Import necessary liberaries,
- For opening and reading file open command is used
- Try & except command is used to check if the statements are compatible or not
- The area under the curve is found with the help of trapz function
- After calculating areas under the curve power and specific fuel consumption is calculated
Installing and accessing RELP package
As sublime text is doesnot take in inputs directly, sublimeRELP pakage is installed in order to allow sublime to interact with user inputs.
Relp is accesed in the following order
Tools>SublimeRelp>python> python-run current file
Necessary inputs are given after this stage.
Python Code:
"""
Data visualizer
BY Saurabh Nambiar
"""


import matplotlib.pyplot as plt
from scipy.integrate import simps
import numpy as np
from numpy import trapz

#line to find file exists or not

try:
   file= open('engine_data.out')
   print('File opened successfully n')
except:
    print('File not recognized or present. Please provide a valid converge output')

#parameters given below for a plot


print('Chose any of the 2 parameters that you want to compare')
print('1-crank,2-Pressure, 3-Max_Pressure, 4-Min_Pressure, 5-Mean_Temp, 6-Max_Temp, 7-Min_Temp, 8-Volume, 9-Mass'
      '10-density, 11-integrated_HR, 12-HR_Rate, 13-C_p, 14-C_v, 15-Gamma, 16-kinetic Viscosity, 17-Dynamic Viscosity')

#getting input from the user

x=input('Please give required x axis data column number(1-17)' )
y=input('Please give required y axis data column number(1-17)' )

#declaring the inputs as integers

nx=int(x)
ny=int(y)

#used to store the values

column_1=[]
column_2=[]
count=1

#loop for taking the required data

for line in open('engine_data.out'):
    if count == 3:
        name_1=line.split()[nx]
        name_2=line.split()[ny]
    if '#' not in line:
        column_1.append(float(line.split()[nx-1]))
        column_2.append(float(line.split()[ny-1]))

    count=count+1

#Area under the curve that is work done

area=np.trapz( column_1, column_2)
print('area:{}m^2'.format(area))

#power output of the engine

#Calculating power output of the engine
rpm = 1500
power = area * 1e+06*rpm/(9550)
print('The power output of the engine is',power,'KW')

# Calculating specific fuel consumption
fuel_per_stroke = 20*1e-06
mass_flow_rate	= 2.99*1e-10 #mass flow rate in grams per second
Specific_Fuel_Consumption = mass_flow_rate/(power)
print('The specific fuel consumption is ',Specific_Fuel_Consumption,'g/KW')

#plotting the values

plt.plot(column_2,column_1)
plt.xlabel(name_1)
plt.ylabel(name_2)
print('{} vs {}'.format( name_1,name_2))
plt.show()
Results:-
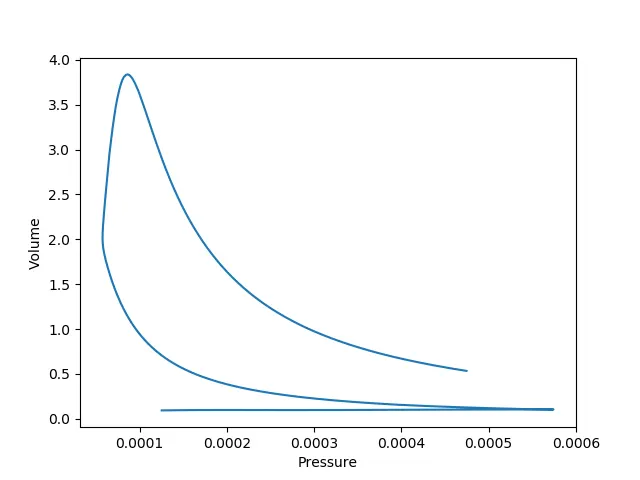
Preassure vs Volume Graph:-
Simulated Results
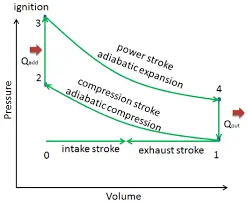
Ideal Graph
Observations and Conclusions
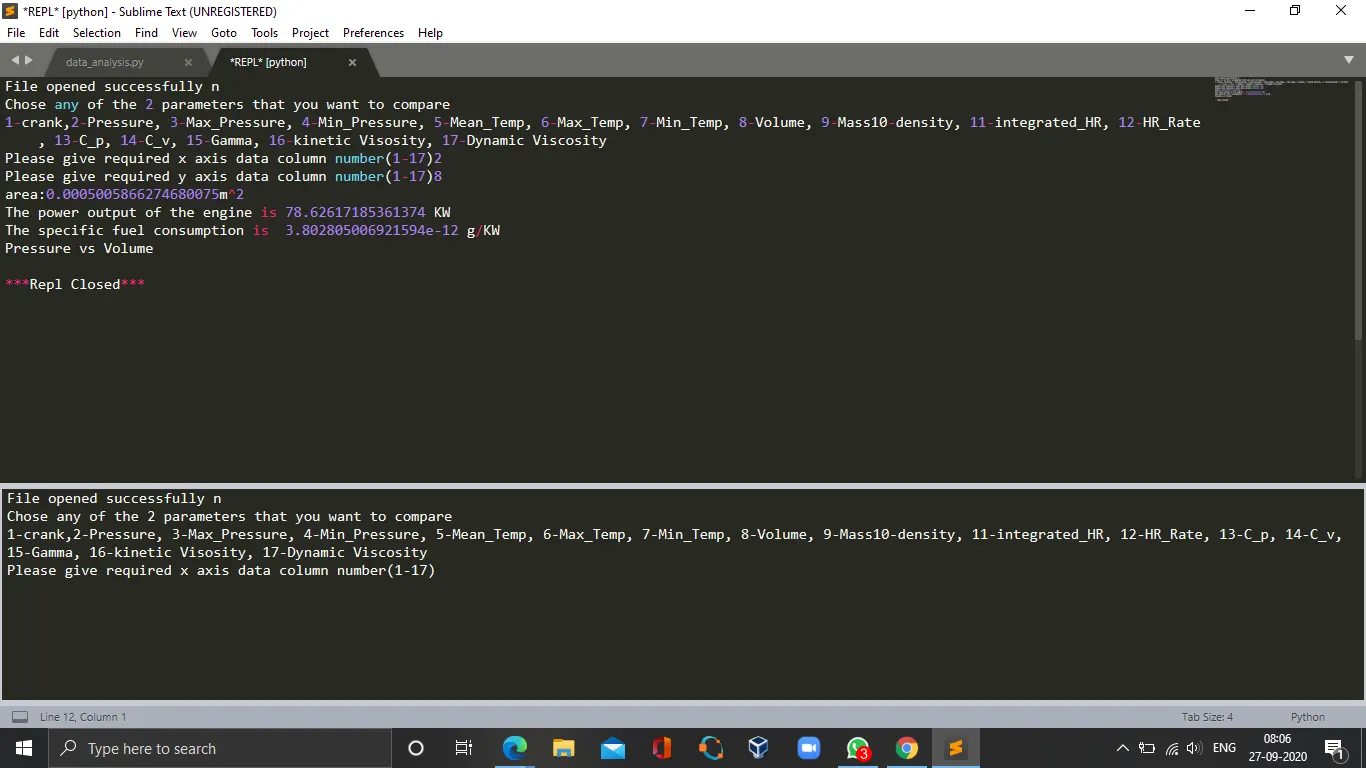
- We got the following Results for Area:0.0005005866274680075m^2, the power output of the engine is 78.62617185361374 KW, the specific fuel consumption is 3.802805006921594e-12 g/KW.
- The code ran without errors, (this was made possible by using RELP package).
- The results of the simulation were identical to ideal condition which made sure that the results so obtained are accurate.