Week 6 - Data analysis
%ANSWER
'''
Demonstrating file parsing in python
'''
# data analysis

import math
import numpy as np
import matplotlib.pyplot as plt
from scipy.integrate import simps
from tabulate import tabulate

# file parsing with uer input
# file input
File = input("Enter the name of CONVERGE output filename with extension (.out): ")

# checking if the file is a valid CONVERGE output file
try:
    f = open(File)
except FileNotFoundError:
    print('File not recognized. Please provide a valid CONVERGE output file')

# code to read the data line by line
# to fetch title of data file
titles = []
for line in open(File):
    if '#' in line:
        titles.append(line.split())
print(titles)
print(titles[1])
print(titles[2])
print(titles[3])

# to get column numbers from data file
serial = []
for sn in titles[1]:
    if '#' not in sn:
        if 'column' not in sn:
            serial.append(sn)
print(serial)

# to get parameter names from data file
parameters = []
for p in titles[2]:
    if '#' not in p:
        parameters.append(p)
print(parameters)

# to get si units from data file
units = []
for u in titles[3]:
    if '#' not in u:
        units.append(u)
print(units)

# printing parameters with units and column numbers
headers = ['Column No','Parameters','Units']
data = tuple(zip(serial, parameters, units))
print(tabulate(data,headers=headers))

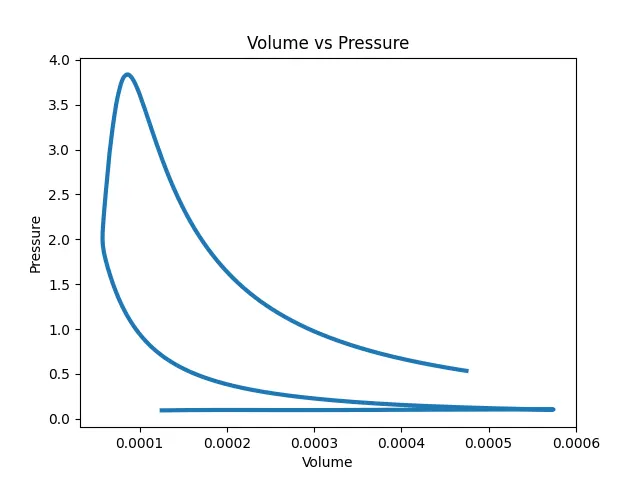
# plotting of parameters by knowing column number
a = int(input('Enter column no of 1st parameter:'))  # for volume 8
b = int(input('Enter column no of 2nd parameter:'))  # for pressure 2
print('\n')

# To generate labels automatically for plots
x_1 = parameters[a-1]
y_1 = parameters[b-1]

# To store required value to plot
value_1 = []
value_2 = []

# To calculate work done from p-V curve
pressure = []
volume = []

# creating a loop to get required values from data file
for line in open(File):
    if '#' not in line:
        value_1.append(float(line.split()[a-1]))
        value_2.append(float(line.split()[b-1]))
        pressure.append(float(line.split()[1]))
        volume.append(float(line.split()[7]))

filename = x_1 + ' vs ' + y_1 + '.png'
title = x_1 + ' vs ' + y_1

# Plotting
plt.plot(value_1, value_2, linewidth=3)
plt.xlabel(x_1)
plt.ylabel(y_1)
plt.title(title)
plt.savefig(filename)
plt.show()

# to calculate area under p-V diagram
Area = simps(pressure, volume)
print('Area under p-V curve:' +str(Area))
print('Work done by engine:' +str(Area*1e6))
print('n')

# to calculate power output of engine
rpm = int(input('Enter the engine RPM:'))  # RPM = 1500
rps = rpm/60
Power_strokes = rps/2 # no of power strokes in revolution of crank-shaft
power = (Area*1e6)*Power_strokes/1000  # power in kW
print('Power output of engine is:' +str(power)+ 'kW')
print('\n')

# to calculate specific fuel consumption
r = int(input('Enter specific fuel consumption per kg per sec:')) # 20 micro grams of fuel (per 1 stroke cycle)
bsfc = (r/power)*3600
print('Specific fuel consumption of the engine:' +str(bsfc)+ 'kg/kWhr')
Terminal
Enter the name of CONVERGE output filename with extension (.out): engine_data.out
[['#', 'CONVERGE', 'Release', 'Build', '2.3.29/', 'Dec', '13,', '2017', 'Run', 'Date:Sat', 'Jan', '13', '15:08:31', '2018'], ['#', 'column', '1', '2', '3', '4', '5', '6', '7', '8', '9', '10', '11', '12', '13', '14', '15', '16', '17'], ['#', 'Crank', 'Pressure', 'Max_Pres', 'Min_Pres', 'Mean_Temp', 'Max_Temp', 'Min_Temp', 'Volume', 'Mass', 'Density', 'Integrated_HR', 'HR_Rate', 'C_p', 'C_v', 'Gamma', 'Kin_Visc', 'Dyn_Visc'], ['#', '(DEG)', '(MPa)', '(MPa)', '(MPa)', '(K)', '(K)', '(K)', '(m^3)', '(kg)', '(kg/m^3)', '(J)', '(J/time)', '(J/kg-K)', '(J/kg-K)', '(none)', '(m^2/s)', '(N*s/m^2)'], ['#']]
['#', 'column', '1', '2', '3', '4', '5', '6', '7', '8', '9', '10', '11', '12', '13', '14', '15', '16', '17']
['#', 'Crank', 'Pressure', 'Max_Pres', 'Min_Pres', 'Mean_Temp', 'Max_Temp', 'Min_Temp', 'Volume', 'Mass', 'Density', 'Integrated_HR', 'HR_Rate', 'C_p', 'C_v', 'Gamma', 'Kin_Visc', 'Dyn_Visc']
['#', '(DEG)', '(MPa)', '(MPa)', '(MPa)', '(K)', '(K)', '(K)', '(m^3)', '(kg)', '(kg/m^3)', '(J)', '(J/time)', '(J/kg-K)', '(J/kg-K)', '(none)', '(m^2/s)', '(N*s/m^2)']
['1', '2', '3', '4', '5', '6', '7', '8', '9', '10', '11', '12', '13', '14', '15', '16', '17']
['Crank', 'Pressure', 'Max_Pres', 'Min_Pres', 'Mean_Temp', 'Max_Temp', 'Min_Temp', 'Volume', 'Mass', 'Density', 'Integrated_HR', 'HR_Rate', 'C_p', 'C_v', 'Gamma', 'Kin_Visc', 'Dyn_Visc']
['(DEG)', '(MPa)', '(MPa)', '(MPa)', '(K)', '(K)', '(K)', '(m^3)', '(kg)', '(kg/m^3)', '(J)', '(J/time)', '(J/kg-K)', '(J/kg-K)', '(none)', '(m^2/s)', '(N*s/m^2)']
  Column No  Parameters     Units
-----------  -------------  ---------
          1  Crank          (DEG)
          2  Pressure       (MPa)
          3  Max_Pres       (MPa)
          4  Min_Pres       (MPa)
          5  Mean_Temp      (K)
          6  Max_Temp       (K)
          7  Min_Temp       (K)
          8  Volume         (m^3)
          9  Mass           (kg)
         10  Density        (kg/m^3)
         11  Integrated_HR  (J)
         12  HR_Rate        (J/time)
         13  C_p            (J/kg-K)
         14  C_v            (J/kg-K)
         15  Gamma          (none)
         16  Kin_Visc       (m^2/s)
         17  Dyn_Visc       (N*s/m^2)
Enter column no of 1st parameter:8
Enter column no of 2nd parameter:2


Area under p-V curve:0.0005005864474262364
Work done by engine:500.58644742623636
n
Enter the engine RPM:1500
Power output of engine is:6.257330592827954kW


Enter specific fuel consumption per kg per sec:20
Specific fuel consumption of the engine:11506.504080593915kg/kWhr