Week 6 - Data analysis
Aim: To wrie a code that des the fllowing -
Data visualizer
- The script should take column numbers as the input and plot the respective columns as separate images.
- Each file should be saved by the name of the column
- The plot labels should be extracted from the file and must appear as labels in the plots.
Compatability check
- The code should exit gracefully, if a non-compatible file is provided as an input. It should say something like "File not recognized. Please provide a valid CONVERGE output file"
Basic performance calculation
- Calculate the area under the P-V diagram. P is in column 2 and V is in column 8.
- Calculate the power output of this engine. Assume that RPM is 1500
- This engine consumed 20 micro grams of fuel (per 1 stroke cycle). Calculate its specific fuel consumption.
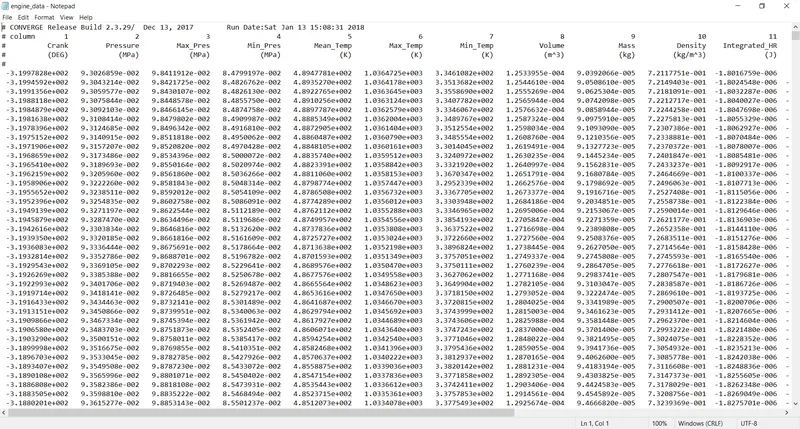
Given: 'CONVERGE' data file
Code:
import matplotlib.pyplot as plt
import math
import numpy as np

filename = input("Enter the name of the file: ")

if filename == 'engine_data.out':
	print('The file is Valid.')
else:
	print ("Invalid File!")
	exit()

#Check for compatibility

def check_compatibility(fn):
	if 'CONVERGE' not in fn:
		print('Kindly provide the CONVERGE output file for further action.')
		exit()
	else:
		print('Compatitbility check successfully completed.')

data = []
for line in open(filename):
	if '#' in line:
		data.append(line.split())
check_compatibility(data[0])

col_no = []
col_val = []
col_units = []
num_of_columns = len(data[1])
heading = len(data[2])

z = data[1].index('column')
for i in range(z,num_of_columns-1):
	col_no.append(i)

for j in data[2]:
	if j is not '#':
		col_val.append(j)

for k in data[3]:
	if k is not '#':
		col_units.append(k)

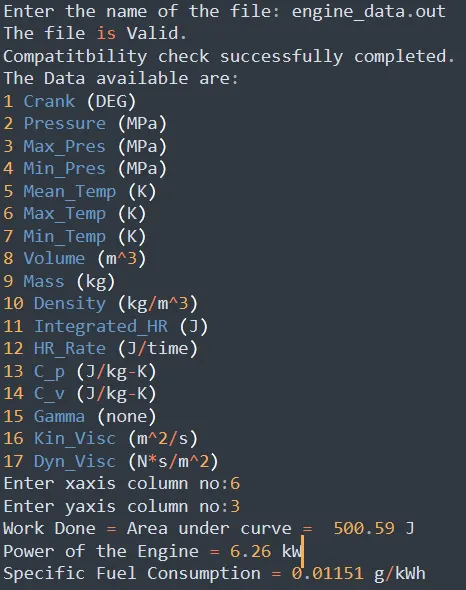
print('The Data available are:')

for a in range(0,len(col_no)):
	print(col_no[a],col_val[a],col_units[a])

xaxis = int(input('Enter xaxis column no:'))-1
yaxis = int(input('Enter yaxis column no:'))-1

x = []
y = []

for line in open(filename):
	if '#' not in line:
		x.append(float(line.split()[xaxis]))
		y.append(float(line.split()[yaxis]))

plt.plot(x,y,linewidth=1.5)
plt.xlabel(col_val[xaxis])
plt.ylabel(col_val[yaxis])
plt.show()

pressure = []
vol = []

for line in open(filename):
	if '#' not in line:

		pressure.append(float(line.split()[1]))
		vol.append(float(line.split()[7]))

#Work Done
Pressure = 1e6*np.array(pressure)
Volume = np.array(vol)
area = np.trapz(Pressure,Volume)
print('Work Done = Area under curve = ',round(area,2), 'J')

#Power output of Engine
cyclepersec = 750/60
power = area*(cyclepersec/1000)
print('Power of the Engine =',round(power,2),'kW')

#Specific Fuel Consumption
mass_flow = 20e-6
sfc = mass_flow*3600/power
print('Specific Fuel Consumption =',round(sfc,5),'g/kWh')
Explanation:
- Import matplotlib.pyplot, math and numpy modules.
- Request the name of the file from the user.
- Check for file name validity. If it is invalid then display an error message.
- Define a function for Compatibility Check where we check if the correct file has been provided by the user.
- If the correct file is provided, we open the file and read it.
- We append each line of the file which starts with '#' into an array called data. These are the lines without data and with headings.
- We now print the various headings with their respective units.
- Request the user for an input for x-axis and y-axis of the desired plot.
- Define empty arrays x & y and store the x-axis and y-axis data (of the user's choice) in them. The lines with relevant data in the given data file start without a '#'.
- Plot the fligure with extracted x and y axes data with respective axes labels.
- For Part 2, calculate the area under the curve using "trapz" from "numpy" module. This will provide the Work done (kJ).
- Calculate the Power output of the engine (kW) using the work done, given rpm is 1500.
- Calculate the Specific Fuel Consumption (g/kWh), given mass flow rate in 20microns.
- We round off all the above 3 paramters to 2 decimal points.
- Before executing, it is important to instal SublimeREPL Build System.
Output:
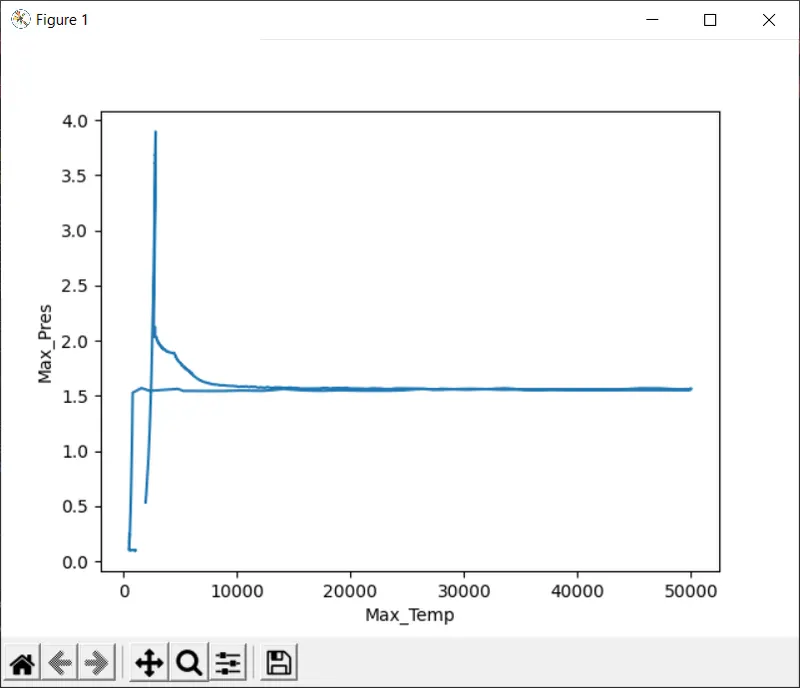
For example, lets table a Max. Pressure vs Max. Temperature plot: