Data analysis in PYTHON on a data file from CONVERGE
Reading and compiling data from CONVERGE data file:
- The libraries are imported
- A Converge data file is taken in as an input using the input command in python
- some quirky software feel lines are printed using the print command
- A timing module is imported to make it look more engaging and feel, and a time pause is used between some areas using the 'time. sleep' command.
- An 'if' loop is created to make the compatibility check. If the file name matches, It will start the rest of the operation, and if not, the program will run back to the file name part. This repeat mode is created by adding into the while loop.
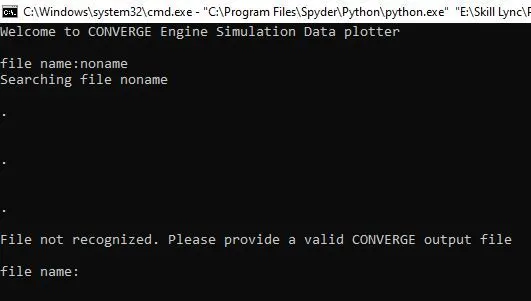
- When the right name is given, the program moves further.
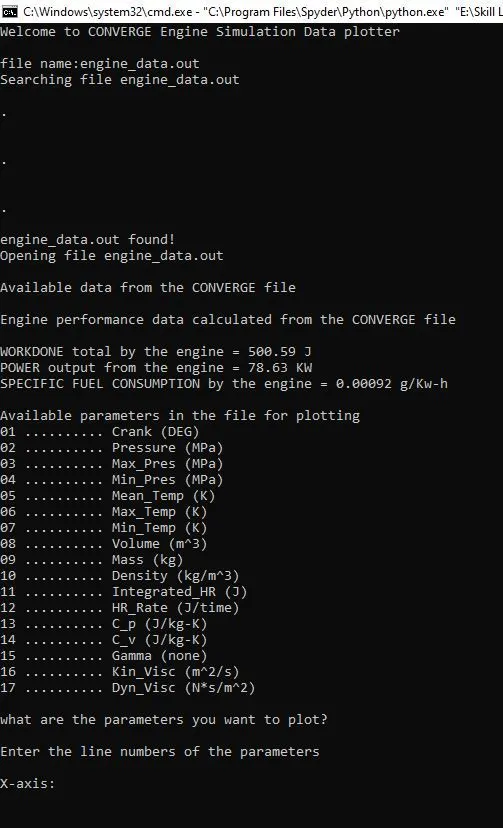
- At first, the headers of the documents are taken in. Then the first line and columns with the "Hashtag' are omitted, and only the data is taken and kept in an empty array. These are done with open data file command and counter operators.
- The important alone parameters that can be calculated, i.e., engine performance like Brake Specific fuel consumption, Work done, Power, are all calculated and displayed before the program moves on for the plotter.
- Work done is nothing but the Area under the PV diagram. This is done using the numpy's trapz command and converting the pressure into an array using np.array to match the list. The work done is converted to J, which is N-m.
- Power and brake-specific fuel consumption are done by a similar method.

- Then the column numbers and the respective parameters and their units are print with the print command
- an empty array is opened for the x and y-axis, respectively.
- The user is asked for their desired parameters to plot. They can choose it from the parameters' respective line number, and again this is done by the input command.
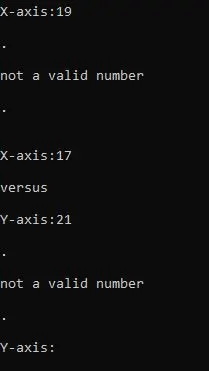
- A while loop is added separately for the x and y-axis because if a number not in the list is given as input erroneously, the program still starts from the x or y-axis, and the user does not want to go all the way to search the file again.
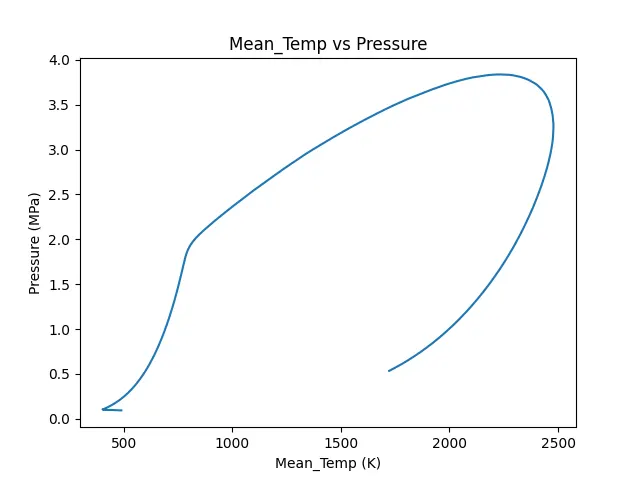
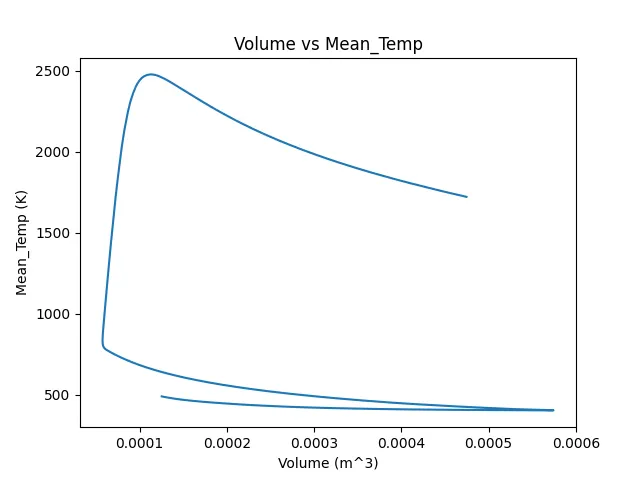
- Once the x and y-axis parameters are given, the program will choose the right path from the array corresponding to the value and show the graph. Matplot's plotting command does all these.
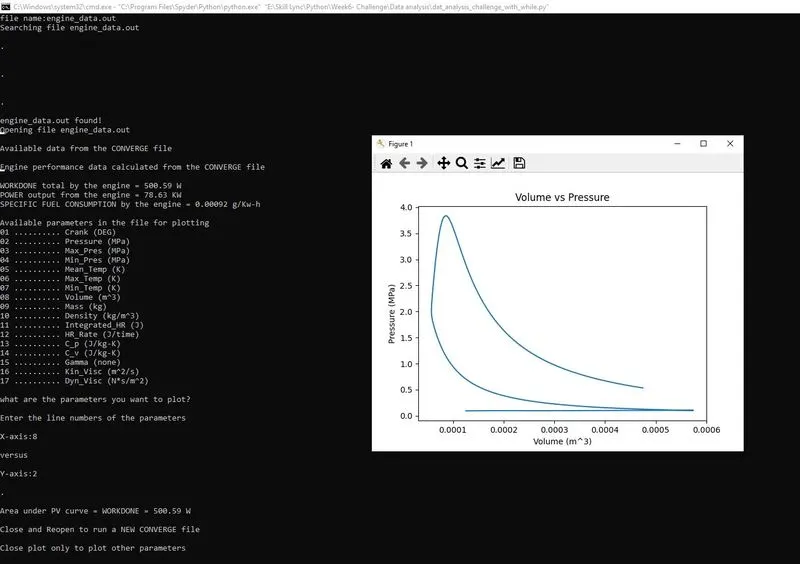
- The above image shows the program displaying the map for the given numbers, and also, the program is programmed to display the area under the curve, especially for the PV diagram. The area under the curve is nothing but the total work done by the engine. The area under the curve turned out to be 500.59 J or N-m.
- Also, the file name is printed with array functions, so each plot automatically has its respective plot name, x and y labels with respective units, and the plot gets saved in the file directory with the title as a name.
- Since every part is nested inside a while loop, the plot will not break and end, so once the plot is closed, the program returns to the x and y-axis values. So several plots can be made in a single run.
A video of the screen running the program can be found in the link: https://youtu.be/NrI8_bTjr08
PS: please watch in HD as the screen size is small and the video size is small.
Python code:
#importing libraries
import numpy as np
import matplotlib.pyplot as plt
import time

space = """
.
"""
print('Welcome to CONVERGE Engine Simulation Data plotter')
while True:
    #pulling in the data file
    data_file = input("nfile name:")
    print(f'Searching file {data_file}')
    print(space)
    time.sleep(0.1)
    print(space)
    time.sleep(0.1)
    print(space)
    time.sleep(0.1)
    if data_file == 'engine_data.out':
        print(f'{data_file} found!')
        time.sleep(1)
        print(f'Opening file {data_file}')
        time.sleep(1)
    else:
        print('File not recognized. Please provide a valid CONVERGE output file')
        continue

    #taking headers info
    header = []
    ct = 1
    for line in open(data_file):
        if '#' in line:
            if ct is not 1:
                if ct is not 5:
                    header.append(line.split())
            ct = ct + 1

    #getting the headers
    pn_samp = (header[0])
    pname_samp = (header[1])
    pu_samp = (header[2])

    part_number = (pn_samp[2:])
    part_name = (pname_samp[1:])
    part_unit = (pu_samp[1:])

    print('nAvailable data from the CONVERGE filen')
    time.sleep(1.1)
    print('Engine performance data calculated from the CONVERGE filen')
    time.sleep(1.1)

    fuel_one_cyc = 20*1e-6 # 20 micrograms/sec in grams/sec
    Press = []
    Vol = []
    turn = 1500*0.10472 #1RPM is 0.10472 rad/s #in rad/s

    for line in open(data_file):
        if '#' not in line:
            Press.append(float(line.split()[1]))
            Vol.append(float(line.split()[7]))

    Workdone = np.trapz((np.array(Press)*1e6),Vol) # in J which is N.m
    Power = (Workdone*turn)/1000 #in KW
    sfc = (fuel_one_cyc*3600)/Power

    print(f'WORKDONE total by the engine = {round(Workdone,2)} J')
    time.sleep(0.2)
    print(f'POWER output from the engine = {round(Power,2)} KW')
    time.sleep(0.2)
    print(f'SPECIFIC FUEL CONSUMPTION by the engine = {round(sfc,5)} g/Kw-h')

    time.sleep(1)

    print('nAvailable parameters in the file for plotting')
    time.sleep(1)
    for i in range(0,9):
        print(part_number[i].zfill(2),'..........',part_name[i],part_unit[i])
    for i in range(9,17):
        print(part_number[i].zfill(2),'..........',part_name[i],part_unit[i])

    time.sleep(1)

    #asking what to plot (the x and the y axis)
    print('nwhat are the parameters you want to plot?')
    time.sleep(0.1)
    print('nEnter the line numbers of the parameters')
    time.sleep(0.1)

    #getting the x and y axis
    while True:
        x_axis = []
        y_axis = []

        hor = int(input('nX-axis:'))-1 #because index starts from 0
        if hor > 17:
            print(space)
            print('not a valid number')
            print(space)
            continue
        else:
            print(' ')
            print('versusn')

        while True:
            ver = int(input('Y-axis:'))-1 #because index starts from 0
            if ver > 17:
                print(space)
                print('not a valid number')
                print(space)
                continue
            else:
                for line in open(data_file):
                    if '#' not in line:
                        x_axis.append(float(line.split()[hor]))
                        y_axis.append(float(line.split()[ver]))

            if hor == 7:
                if ver == 1:
                    print(space)
                    print(f'Area under PV curve = WORKDONE = {round(Workdone,2)} J')

            print('nClose and Reopen to run a NEW CONVERGE file')
            print('nClose plot only to plot other parameters')

            #plotting the required graph
            plt.plot(x_axis,y_axis)
            plt.xlabel(f'{part_name[hor]} {part_unit[hor]}')
            plt.ylabel(f'{part_name[ver]} {part_unit[ver]}')
            plt.title(f'{part_name[hor]} vs {part_name[ver]}')
            plt.savefig(f'{part_name[hor]}vs{part_name[ver]}.png')
            plt.show()
            break
        print('Enter the line numbers of the parameters')
        continue