Week 6 - Data analysis
Data Analysis Assignment:
Introduction: We have a data file providing engine details like crank angle, pressure, volume in different columns and aim of this challenge is to parse the file and collect the values in separate columns so that we can successfully plot values on the graph. The whole process will be automatically initiated once the user inputs the respective value for the item they need to plot.
Explanation: First we read the lines in the data file, separate out the line which consists of names of the columns and then make that into an array. We remove the ‘#’ from the line and append that array into another array. Once this is done, we can print all the values for the user and choose from and give an input. The list is shown in the example code. If the user chooses a value not in the list, it will automatically print an error displaying ‘value not recognized’.
After this when the user inputs two values, one for x axis and y axis.
The lists containing all values for crank angle, pressure, volume are separately appended.
Then these lines are plotted as per the input by user.
Code:
import math
import matplotlib.pyplot as plt
import numpy as np
from scipy.integrate import simps

print("Choose any of these:")

name=[]
name1=[]
name2=[]
#extracting the third line out of all these lines

for line in open('engine_data.out'):
	if '#'in line:
		name=line.split()
		name1.append(name)

#print(name1[2])

# removing # from the line array
for j in name1[2]:
 	if j is not '#':
 		name2.append(j)
#running this list to show the user
for k in range(0,17):
	print(k,'=',name2[k])


num1=int(input("Choose a value from the above list (to be plotted on x axis): "))
num2=int(input("Choose any value from the above list (to be plotted on y axis):"))
if num1 in range(0,17):
	print(name2[num1])
	print(name2[num2])
else:
	print('File not recognized. Please provide a valid CONVERGE output file:')
#writing the loop for plotting and extracting values for different columns


input1=[]
input2=[]

for line in open('engine_data.out'):
	if '#' not in line:
		input1.append(float(line.split()[num1]))
		input2.append(float(line.split()[num2]))
if num1==7:
	if num2==1:
		area=simps(input2,input1)
		print('work done by engine is',area)
		torque=area/(4*3.14)
		power=(torque*1500)/9.548
		print('power output of engine is',power)


plt.plot(input1,input2,linewidth=3)
plt.xlabel(name2[num1])
plt.ylabel(name2[num2])
plt.show()
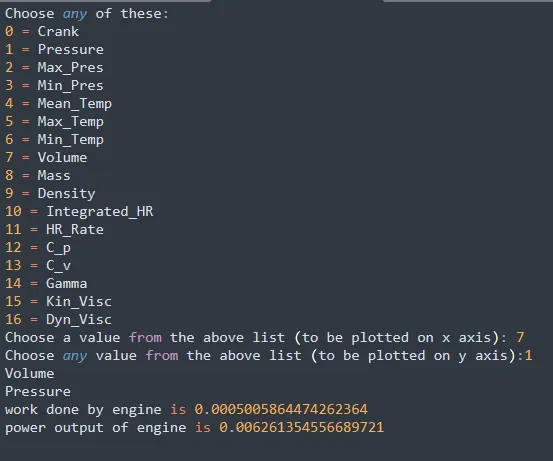
Example plot: This is how the console looks after running the code when we put pressure and volume.
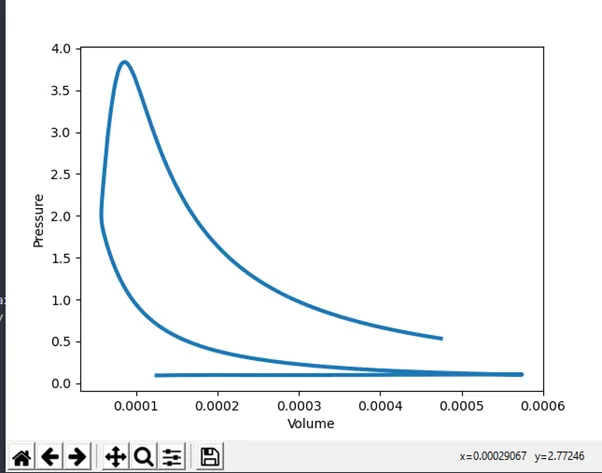
Plot for pressure and volume:
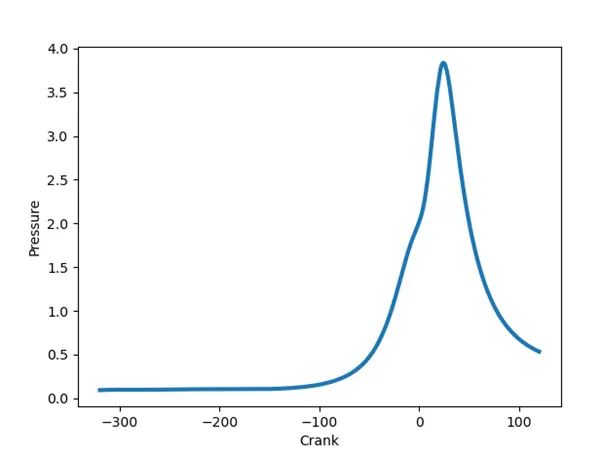
Similarly, plot for crank and pressure;
Considering it a 4-stroke engine which take 2 crankshaft revolutions to complete. It means 720 degrees, i.e., 4pi degree for each cycle. This means for one power stroke where fuel is consumed, it takes 4pi revolution for crankshaft.
For 4pi revolution=1 power stroke
Rpm=1500 i.e., 25 rotations per second.
1 rotation=2 pi revolution
25 rotations in one sec=50 pi revolutions in one sec
i.e., 12.5 power stroke in one sec
Fuel consumption in one power stroke=20 micro gram in one stroke
20x12.5 micro gram fuel i.e.,250 micro gram consumption in one second.
Specific fuel consumption- 250 micro gram per second
Area under curve in python is calculated using the scipy. Integrate module and then importing simps from that.
Area under p-V curve=0.000500586 kJ
Area=work done=torque x theta
Theta=4x3.14
Power =torque x rpm
Power output =0.006261354 KJ/sec
Conclusion: Hence the file is parsed. When the user inputs the column number, plot gets generated. For p-v curve, work done and power output also gets printed.