Data analysis For Engine using Python
Data Analysis for Engine using Python
Aim:
To be able to write the program to read the data, checking the data, calculating the workdone by the engine along with specific fuel consumption of the engine and plotting the graphs which are required for analysis.
Software Required:
1.Python
2.PyCham Community Edition
3.Sublime
Theory:
Data analysis is a process of inspecting, cleansing, transforming, and modeling data with the goal of discovering useful information, informing conclusions, and supporting decision-making. Data analysis has multiple facets and approaches, encompassing diverse techniques under a variety of names, and is used in different business, science, and social science domains. In today's business world, data analysis plays a role in making decisions more scientific and helping businesses operate more effectively.
Python is an increasingly popular tool for data analysis. In recent years, a number of libraries have reached maturity, allowing R and Stata users to take advantage of the beauty, flexibility, and performance of Python without sacrificing the functionality these older programs have accumulated over the years.
Program calculations and its explanation:
"""
program for file parsing in python
by thulasi ram
"""
import matplotlib.pyplot as plt
import numpy as np
from numpy import trapz

fname = input("Input_File_Name :  ")

if fname == 'engine_data.out':
	print('valid file')

else:

	print('invalid file')

	exit()

def compatibility_check(a):

	if 'CONVERGE' not in a:

		print('please provide converge output file to process')

		exit()

	else:

		print('compatibility check is successful')

		pass

FILE = []

for line in open(fname):

	if '#' in line:

		FILE.append(line.split())

compatibility_check(FILE[0])

noc = len(FILE[1])
head = len(FILE[2])
col_no = []
col_val = []
col_units = []

z = FILE[1].index('column')
for i in range(z,noc-1):

	col_no.append(i)

for j in FILE[2]:

	if j is not '#':

		col_val.append(j)

for k in FILE[3]:

	if k is not '#':

		col_units.append(k)

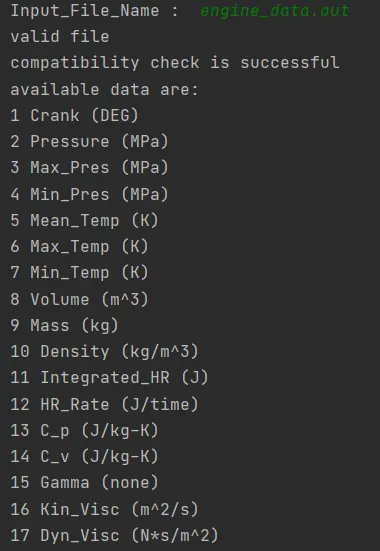
print('available data are:')

for a in range(0,len(col_no)):

	print(col_no[a],col_val[a],col_units[a])

xaxis = int(input('Enter xaxis column no:'))-1
yaxis = int(input('Enter yaxis column no:'))-1

x = []
y = []

for line in open(fname):

	if '#' not in line:

		x.append(float(line.split()[xaxis]))
		y.append(float(line.split()[yaxis]))

plt.plot(x,y,linewidth=1.5)
plt.xlabel(col_val[xaxis])
plt.ylabel(col_val[yaxis])
plt.show()

pressure = []
volume = []

for line in open(fname):
	if '#' not in line:

		pressure.append(float(line.split()[1]))
		volume.append(float(line.split()[7]))

Pressure = 1e6*np.array(pressure)
Volume = np.array(volume)
area = np.trapz(Pressure,Volume)
print('workdone =',area, 'joules')
cyclepersec = 750/60
power = area*(cyclepersec/1000)
print('power=',power,'kw')
mass_flow = 20e-6
sfc = mass_flow*3600/power
print('specific fuel consumption =',sfc,'g/kwh')
Explanation of the code:
In beginning we need to comment what the program is about and impoting the modules which are required for the entire program. Then write the code for importing the correct file which are require for the analysis and do compactabulity check throgh converge. If the compactability check is sucessful then write the empty arrays to (i.e., name,parameter & units) which are required. Finally write the code for calculating the work done, specific fuel consumption by the engine and graphs which are required for analysis.
FILE PARSING:
>Import the Plotting module:

We need to import the plotting module as shown in the above snap for plotting the different types of graphs for showing the variation with respect to two parameters like volume, pressure and temperature etc.
>Import the numpy module:

To give a power to each element of an array or to perform any mathematical operations (like addition or subtraction) either on every element of an array or between the arrays, we need to import the numpy library as shown above.
>Import the tarpz from numpy

To import the tarpz from numpy library as shown above to find out the area by trapezoidal numerical method.
> Checking the input file and compactibility:
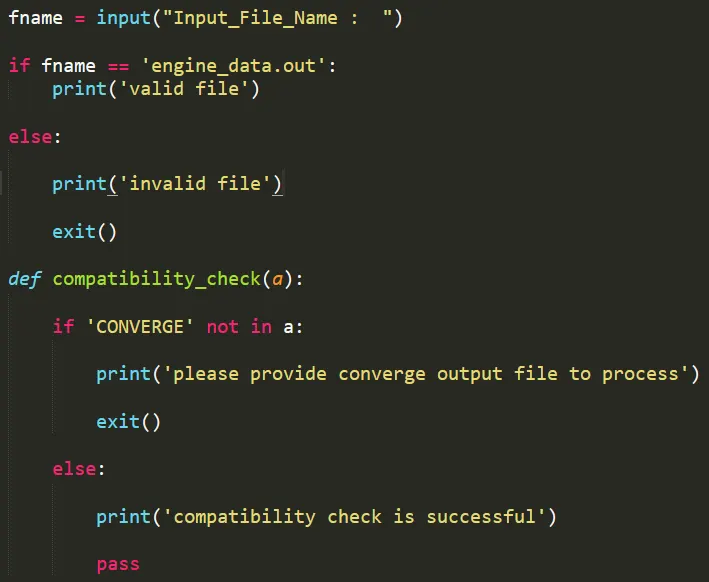
As per data analysis we need to import the correct file into the software and we need to read the entire file to analyze the data. So, we can input the correct file and checking the compactability through converge thus it will be pass as shown in above pic.
>Appending the converge data:
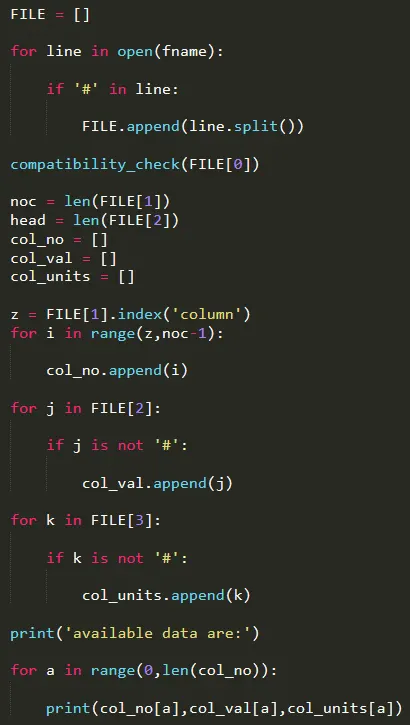
In beginning we need to check the converge is starting with the # key. Splitting the line by line using the split function. Assignning the splitted lines to the loop with variables i, j and k as shown in the above screenshot. Then finally append the data to the program. The program is about the method of indexing the specified value for analysis.
>>Program for asking the parameters for x-axis and y-axis for plotting the graphs:
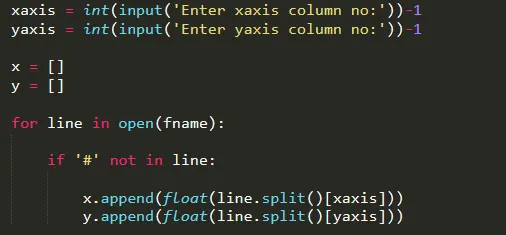
This about to create the input variables which we need to plotting for x-axis and y-axis. This is user friendly by the input variables it will recognize the data and giving the results which are required.
>>Calculating the required output:
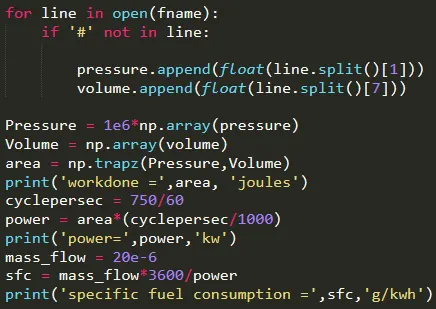
The above program is basic one in which the input the formulaes to find out the workdone, power and specific fuel consumption.
Output:

Graphs:
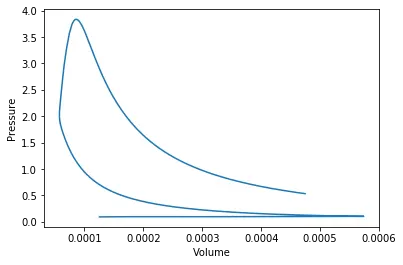
Pressure vs Volume:
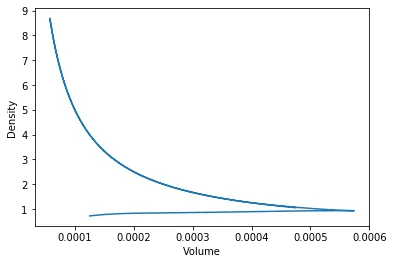
Density vs Volume:
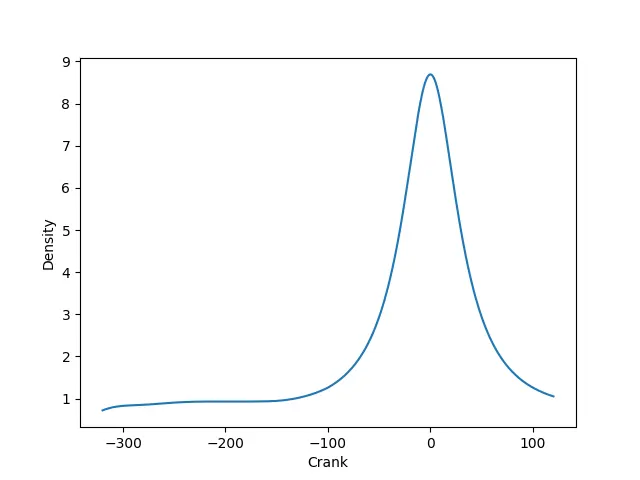
Density vs Crank:
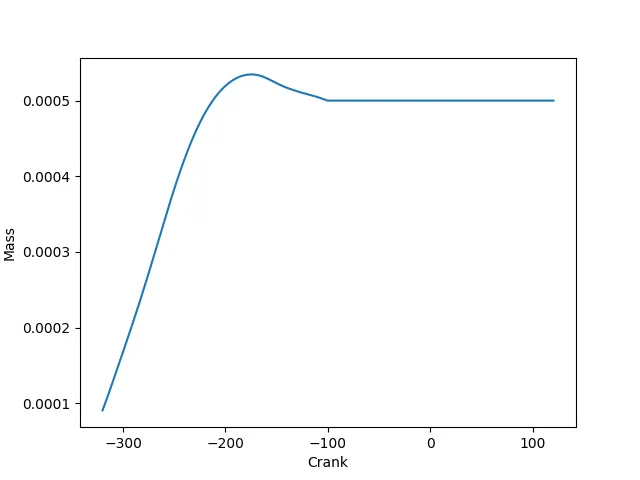
Mass vs Crank:
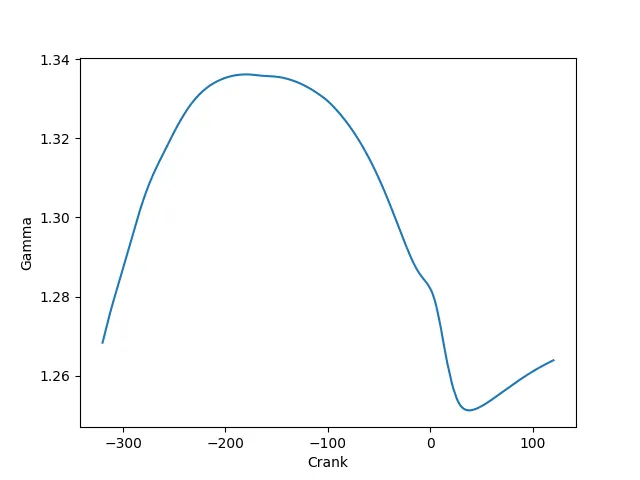
Gamma vs Crank:
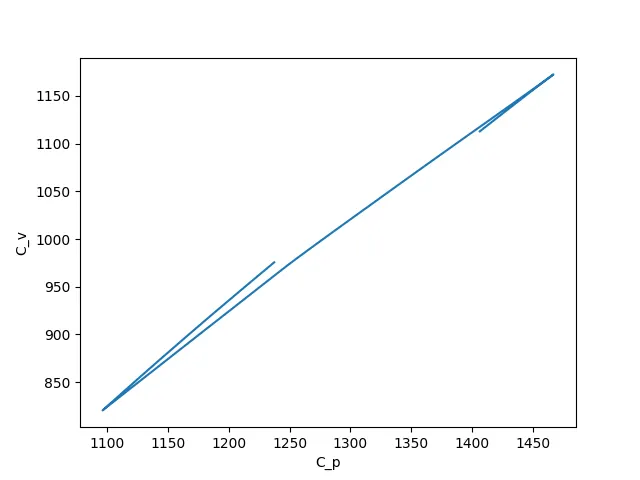
Cp vs Cv:
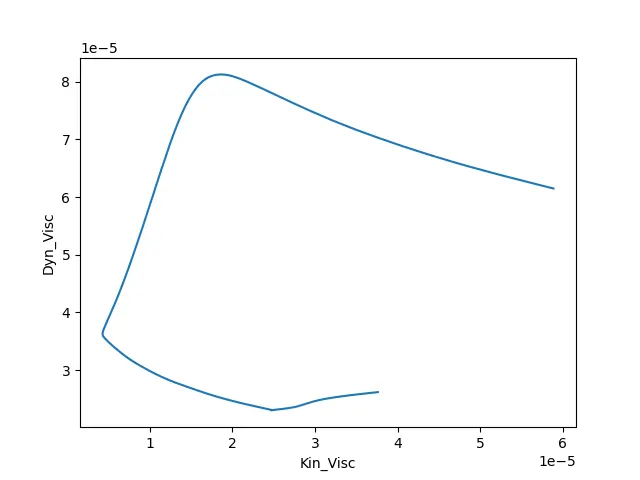
Kin_Visc vs Dyn Visc:
Result:
As per the given objective the program is executed sucessfully for reading, checking and analysing the data.