Week 6 - Data analysis
Data Analysis on a Converge Output File using Python
AIM:
- Compatibility check the input file
- Calculate the area under the P-V diagram from the input data
- Calculate power and Specific Fuel consumption
Briefing:
Given output file is from converging, which consists of the different parameters such as Pressure, Volume, Crank Angle, etc. The objective is to extract the data from the file and find the power, SFC, and work done from the data in the file.
Steps and Challenges:
- Firstly need to check for compatibility of the file using the if condition.
- Extracting the column labels using for loop.
- Taking the column numbers from the user for the x and y-axis from the plot.
- Storing the data in new arrays
- Finding out the power, work done, and SFC from the PV diagram data.
# Data Analysis Week 6

import numpy as np
import math
import matplotlib.pyplot as plt

print("Type in the converge file name")
file_name = input()

if(file_name == "engine_data.out"): # Compatability check


	Y = []
	X = []

	line_count = 0
	Labels = []
# To get the axis labels from the file
	for line in open('engine_data.out'): # going through the file line by line
		if line_count == 2: # labels are present in row 2
			Labels.append(line.split()) # storing the strings in labels array
		line_count = line_count + 1


	new_array = np.array(Labels)
	# print(new_array)
	new_array = np.delete(new_array,0,1) # removing the first string which is # from the array
	# print(new_array.shape)
	# print(new_array)
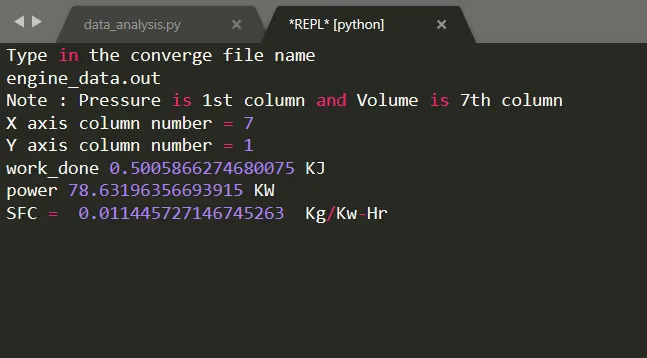
	print("Note : Pressure is 1st column and Volume is 7th column")

	i = int( input("X axis column number = ")) # req fro x axis row
	j = int( input("Y axis column number = ")) # req fro y axis column

	line_count = 0

	for line in open('engine_data.out'):

		if "#" not in line:

			X.append(float(line.split()[i])) # storing the values of ith column in the data set
			Y.append(float(line.split()[j]))


	if i == 7 and j == 1: # wkt pressure is column 1 and volume is 7th row

		work_done = np.trapz(Y,X) # function to find the area under the PV curve

		rpm = 1500  # given

		fuel_consp_per_stoke = 20 * pow(10,-6) # given

		print("work_done",work_done*1000,'KJ')

		power = (2*math.pi* rpm * work_done*1000)/60

		print('power',power,'KW')

		fuel_consp_per_min = fuel_consp_per_stoke * rpm * 0.5

		fuel_consp_per_hour = fuel_consp_per_min * 60

		SFC = fuel_consp_per_hour / power

		print("SFC = ", SFC , " Kg/Kw-Hr")

		plt.xlabel(new_array[0,i])
		plt.ylabel(new_array[0,j])

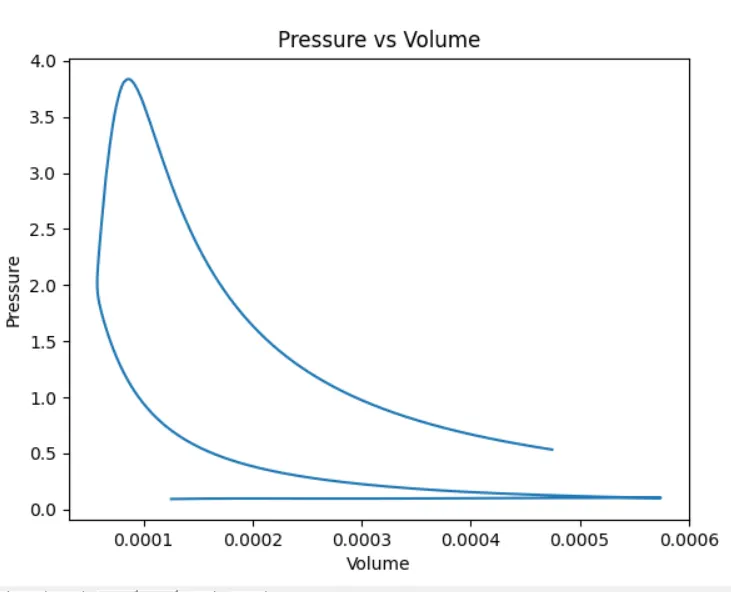
		plt.title('Pressure vs Volume')
		plt.plot(X,Y)
		plt.show()
	else:
		plt.xlabel(new_array[0,i])
		plt.ylabel(new_array[0,j])
		plt.plot(X,Y)
		plt.show()

else:

	print("Incompatible file type")
Results:
The Area under the given PV diagram, Power and SFC of the given engine with 1500 rpm is found out.