DATA ANALYSIS BY USING PYTHON
AIM :
To parsing a given file by format of data visualizer, compatability check and then finding basic engine performance calculation.
OBJECTIVE :
1) Compatability check for which whether file should be appropriated or not.
2) Create a python code for which plotting the graph as per given respective column inputs.
3) File name, labels and then plot title all should be done in automatically after providing an inputs.
4) Calculating the basic performance of engine like area under the PV curve, Power output from engine and specific fuel consumption.
INTRODUCTION :
We have to file parsing the given data file by using Python software, it should be cover all given conditions. They conditions are sorted below,
i) Data Visualizer :
1) Our python code should be take coulmn numbers as the input then it will plot the image correspondingly.
2) Each file sholud be saved automatically by the name of columns. A Plot labels should be extracted from the given file
3) Request for a plot between column x and column Y, then label information should automatically be extracted and must be appear as labels in the plots.
ii) Compatability check :
1) Code should be exit gracefully, if a non compatabilty file is provided as an input. Then, it should be say to us like "File has not recognized. Please provide a valid CONVERGE output file".
iii) Basic performance calculation :
1) Calculate the area under the PV diagram. P is an Column 2 and V is in coulmn 8.
2) Calculate the power output of this engine. Assume that RPM is 1500.
3) A engine consumed 20 micro grams of fuel (per 1 stroke cycle). Calculate its specific fuel consumption.
PYTHON CODE :
import matplotlib.pyplot as plt
import numpy as np
from numpy import trapz


# COMPATABILITY CHECKING
print('We are going to perform a file parsing')
print('First, We have to importing the appropriate data file')

filename = input('Enter the valid filename:')
if filename == 'engine_data.out':
	data = open(filename)
	print('Successfully opened valid CONVERGE output file')
else:
	print('File has not recognized, Please provide a valid CONVERGE output file')

# Important variables
X_axis = []
Y_axis = []
Pressure = []
Volume = []
Col_Num = []


Column_count = 1
for Terms in open('engine_data.out'):
	# Column Numbers
	if Column_count is 2:
		Column_Number = (Terms.split())
	# Extracting the thermodynamics properties
	if Column_count is 3:
		Parameters = (Terms.split())
	# Extracting the thermodynamics property unit
	if Column_count is 4:
		Units = (Terms.split())
	Column_count = Column_count + 1


print('Datas are availables for us to Known')
print('Column_Numbers', ':' ,'Thermodynamic_Properties', ':','Units')
Count = 1
for j in range(0,17):
	print(Column_Number[j+2], ':' , Parameters[j+1], ':', Units[j+1])
Count = Count + 1

# STARTING DATA VISUALIZATION
print('Provide the Column Numbers')
x = (int(input('Enter the Column Number for X axis : ')))
X = x-1
y = (int(input('Enter the Column Number for Y axis : ')))
Y = y-1


line_count = 1

for line in open('engine_data.out'):
	if '#' not in line:
		X_axis.append(float(line.split()[X]))
		Y_axis.append(float(line.split()[Y]))
		Pressure.append(float(line.split()[1]))
		Volume.append(float(line.split()[7]))

	line_count = line_count + 1


# BASIC ENGINE PERFORMANCE CALCULATION
# Calculating an Area under PV diagram curve
pressure = 1e6*np.array(Pressure)
volume = np.array(Volume)  # Unit conversation from megajoule to Joule
Workdone = np.trapz(pressure,volume)
print('Area under the PV diagram =',Workdone, 'joules')

# Calculating an Power
RPM = 1500
Power = Workdone*(RPM/60)
print('Power =', Power, 'watt')

# Calculating a Specific Fuel Consumption
# Mass of fuel consumption per cycle in Kilogram
mf = 2*10e-5
SFC = mf/Power

print('Specific Fuel Consumption =', SFC , 'g/Kw.hr')

plt.figure()
plt.plot(X_axis,Y_axis,linewidth = 2)
plt.xlabel(Parameters[X+1] + Units[X+1])
plt.ylabel(Parameters[Y+1] + Units[Y+1])
plt.title(Parameters[Y+1] + '  Vs  ' + Parameters[X+1])
plt.savefig(Parameters[Y+1] + '  Vs  ' + Parameters[X+1] + ' .png')
plt.show()
PROCEDURE :
1) Importing the needed module such as matplotlib, numpy and then trapz. A matplotlib module is used to plotting the graphs, Numpy module is used to working with arrays and import the trapz (trapezoidal) module from numpy is used to calculating area under the curve.
2) Make a code for compatability test by using 'if condition' function. Make sure save the data file at where place of appropriate directory.
3) Create a 'for loop' function for which extracting the column numbers,Thermodynamic parameters and then corresponding units from given data file.
4) By using 'input' function to allowing the user input to our script and also 'int' function to returns an integer number.
5) Create a another 'for loop' for reading the datas in line by line, then we extracting datas as per needs. Initially, we had created the empty array for which appending values from where in each counts.
6) Create a code for which calculating the area under thr PV curve, Power output of the engine and specific fuel consumption.
7) Create a figure, it should be automatically plotting the appropriate graph, labels and saving the file name.
STEP WISE EXPLANATION :

1) Importing the important modules which are needed to perform data analysis.
2) A 'Matplotlib.pyplot' module is represents as 'plt' and Numpy module which is represents as 'np'
3) Import the trapz function from 'numpy' library.
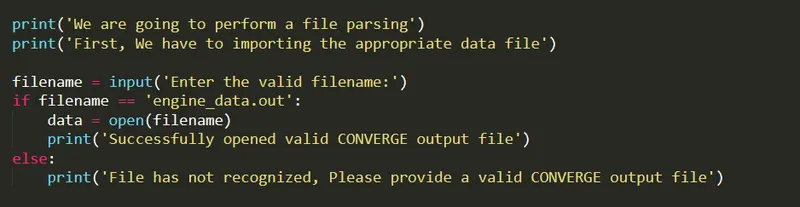
4) Print the some information which are used to understand the codes. By using 'input' function to allowing the user inputs.
5) By using 'if' function to finding whether a input data file is appropriate or not.
6) If a input file is correct, it prints "Successfully opened valid CONVERGE output file" or else a file is wrong, it prints "File has not recognized, Please provide a valid CONVERGE output file "
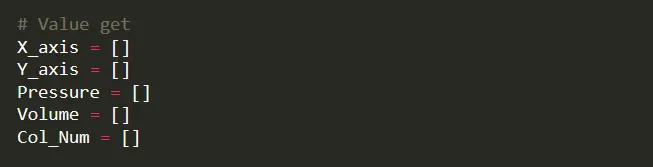
7) Create a empty array to appending the values into respective arrays.
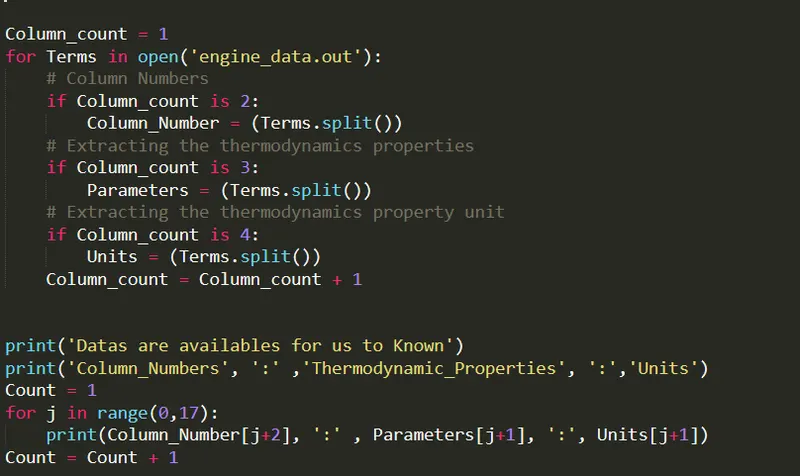
8) Create a 'for loop' function to read the datas from imported file in line by line. Open a data file, in each line as represents as 'Terms'.
9) Under which creates a 'if' function to extracts the column numbers, thermodynamic parameters and Corresponding units on it.
10) If a 'Column count is 2', it will reading all indexes from line number 2. Similarly, it will reading from line number 3 & 4.
11) For our reference, create a code for which sorted the column number, parameters and then units in proper sequence.
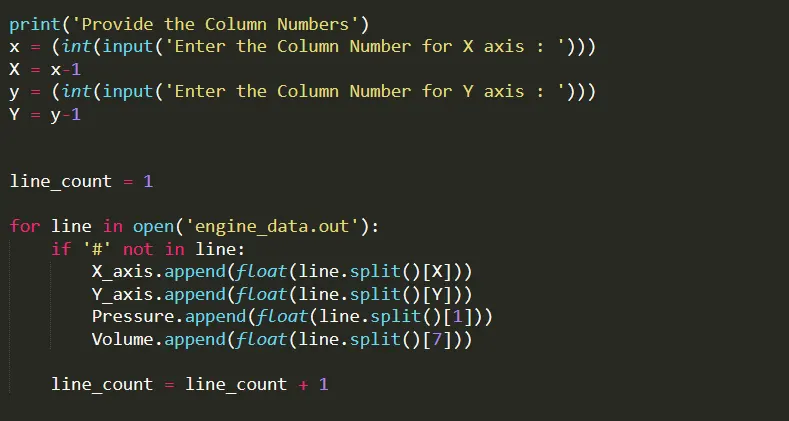
12) By using 'input' function, it allows to provide the column number and 'int' function used to returns an integer number. A 'X and Y' values are represents the coulmn numbers.
13) By using 'for loop' function to read the datas in line by line and again by using 'if function' to eliminating the lines to count if a '#' is involved on a line.
14) Directly put the column numbers to extracting the pressure & volume values in each iteration and then appending into the respective empty arrays.
15) Extract the respective column values depends on input X and Y values.
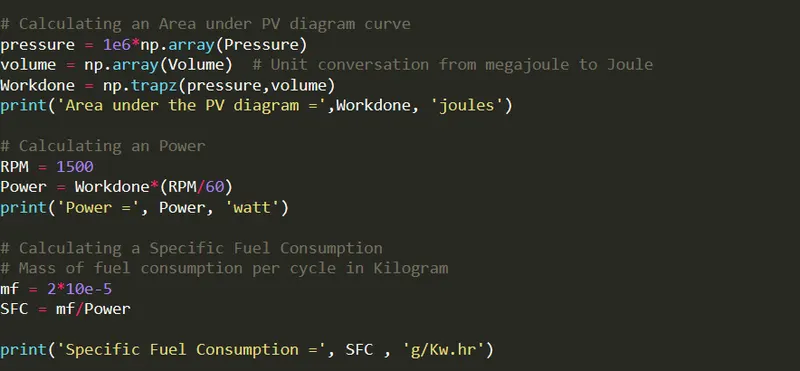
16) By using 'trapz' function to calculate the area under the PV curve. Also, calculate the power output of the engine and then specific fuel consumption.
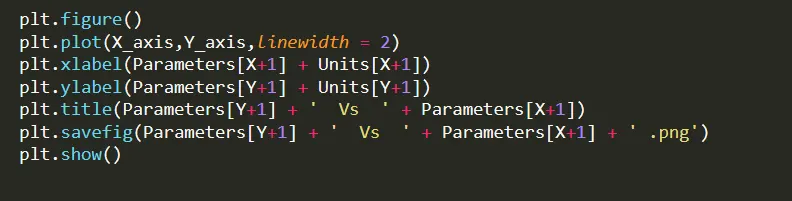
17) To create a individual figure to plotting a graphs as per allowing user inputs, x & y labels, title and save the figure are automatically done by the help of python code.
RESULTS AND DISCUSSION :
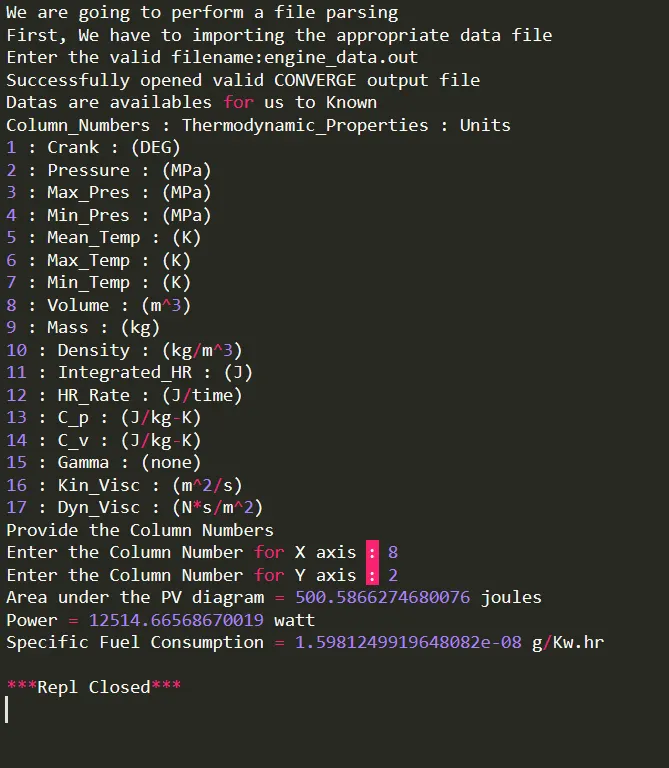
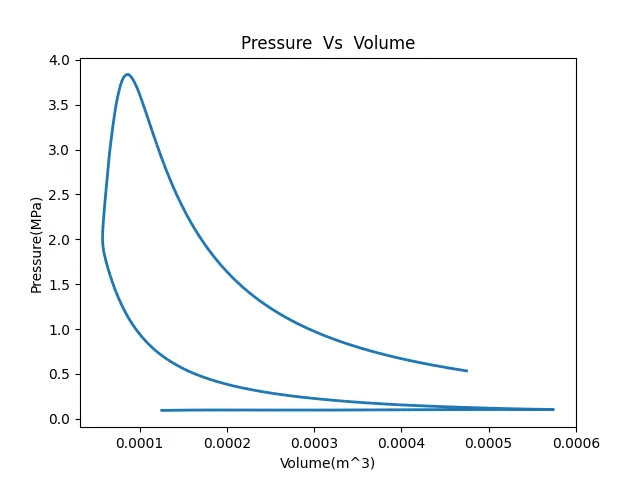
After requesting the column number of 8 and 2 through the user input function, it will plotting the ' Pressure versus Volume ' curve like below snap. A 8 represents volume, it provide into X and 2 represents pressure, it provide into Y.
Compatability check with basic calculations :