Week 6 - Data analysis
Objective
The aim of the project is to write a PYTHON script to perform data analysis from a valid CONVERGE output file.
Following things have been learnt during this project:
- Data parsing
- Visualizing data
- Performance calculation
Data Parsing
Method is being used to convert raw data to more sensible and readable data which makes it easier to extract relevant data and perform mathematical operations.
Here, tried to perform it on CONVERGE engine simulation output file.

PYTHON Code
import matplotlib.pyplot as plt
import numpy as np
import math
from numpy import trapz
# Input valid file
file_name = input("Enter the file name: ")
if file_name.find('out') < 0:
	print('File is INVALID!\nPlease provide a valid file with extension \'out\'.')
else:
	print('File is valid!')
# Compatibility check of valid input file
def compatibility_check(x):
	if 'CONVERGE' in x:
		print('File is compatible. Ready to parse data!\nGet Set Go!')
	else:
		print('File is incompatible!\nPlease provide valid CONVERGE output file.')
file_info = []
for line in open(file_name):
	if '#' in line:
		file_info.append(line.split())
compatibility_check(file_info[0])
# Plot various diagram between engine parameters
plot = str(input('\nDo you want to see any plot between engine parameters? (y/n): \t'))
while plot == 'y':
	col_no = []
	i = file_info[1].index('column')
	for k in file_info[1][i+1:len(file_info[1])-1]:
		col_no.append(k)
	eng_param = []
	for k in file_info[2]:
		if k is not '#':
			eng_param.append(k)
	eng_param_unit = []
	for k in file_info[3]:
		if k is not '#':
			eng_param_unit.append(k)
	print("\nAvailable set of data in the given " + file_name + " file:")
	for k in range(0,(len(col_no)-1)):
		print(col_no[k] + '\t'*3 + eng_param[k] + ' ' + eng_param_unit[k])
	print("\nEnter the relevant number between parameters to be plotted:\n")
	yaxis = int(input('Data to be plotted along y-axis:\t'))-1
	xaxis = int(input('Data to be plotted along x-axis:\t'))-1
	x = []
	y = []
	for line in open(file_name):
		if '#' not in line:
			x.append(float(line.split()[xaxis]))
			y.append(float(line.split()[yaxis]))
	plt.plot(x,y,linewidth=2)
	plt.xlabel(eng_param[xaxis])
	plt.ylabel(eng_param[yaxis])
	plt.show()
	plot = str(input('\nDo you want to see any plot between engine parameters? (y/n): \t'))
# Compute performance parameters for engine
pressure = []
volume = []
for line in open(file_name):
	if '#' not in line:
		pressure.append(float(line.split()[2]))
		volume.append(float(line.split()[8]))
Pressure = 1e6*np.array(pressure)
Volume = np.array(volume)
area = np.trapz(Pressure,Volume)
print('\nWork done by engine is {} joules.'.format(area))
rpm = int(input('\nPlease enter engine RPM:\t'))
stroke = int(input('Type of engine,4-stroke or 2-stroke (2 or 4):\t'))
if stroke == 4:
	cyclepersec = rpm/(2*math.pi*2*60)
elif stroke == 2:
	cyclepersec = rpm/(2*math.pi*60)
power = area*(cyclepersec/1000)
print('\nPower of engine is {} kW.'.format(power))
massflow = 20e-6
sfc = massflow*3600/power
print('\nSpecific fuel consumption of engine is {} gm/kWhr.'.format(sfc))
Output Results
Feed the relevant output file to the script which need to be parsed and further perform some analysis.

Next step script does is to check whether output file is valid or not based on its extension, i.e. ‘*.out’.

If file is valid, then it checks for compatibility w.r.t. CONVERGE term which is defined in all the converge simulation output files.
As file is valid as well as compatible, data can be parsed. Based on it, we can visualize data as shown below:
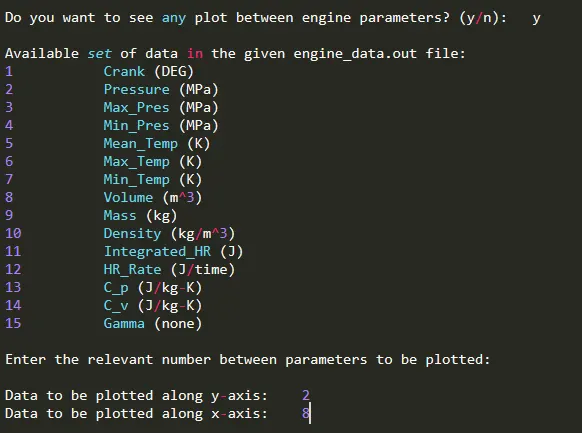
As it can be seen from above snippets, we will try to plot and visualize PV diagram.
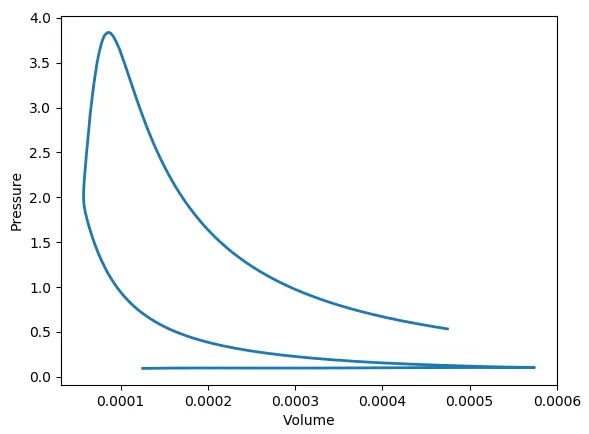
Script will again prompt, if want to see any other plot. If don’t want then key in ‘n’ to proceed to next block of code.

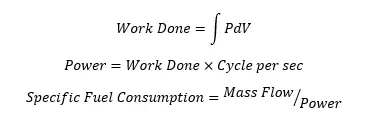
Here, we will be computing some performance parameters for engine.
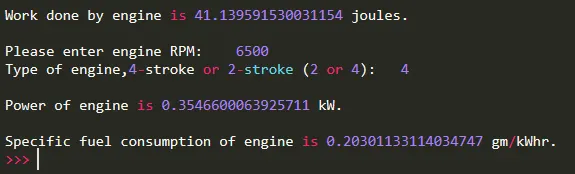
Work done by engine is calculated based on area under the curve of PV diagram.
For calculating power, we will feed in engine rpm and type of engine, i.e. 4-stroke or 2-stroke.