Week 6 - Data analysis
Data Analysis and Visualizer Using Python Programming
Aim:
* To analyse the IC Engine data, present in a given file and to visualize the data as required by taking the user inputs using python.
* To take column numbers as the input and plot the respective columns as separate images. Each file should be saved by the name of the column.
* To plot the labels for the images automatically from the given data file.
* From the analysed data we need to calculate the work done by the engine, the power output at a given engine speed and also the specific fuel consumption of the IC engine using python.
Data Analysis:
* Data analysis is a process of inspecting,cleansing, transforming and modelling data with the goal of discovering useful information, informing conclusions and supporting decision-making.
* Data analysis has multiple facets and approaches, encompassing diverse techniques under a variety of names, and is used in different business, science, and social science domains.
* In today's business world, data analysis plays a role in making decisions more scientific and helping businesses operate more effectively.
* In this program the given data file consists of some useful result values from the simulation of an particularly Designed IC engine.
* Analysing each engine parameters is the the main idea of this python program, it is done by the following steps,
1. Extracting the data by reading the file.
↓
2. Storing the data in particular array.
↓
3. Processing or evaluating the data as required.
* This process of extracting and storing the data for further usage is done by file parsing.
* Parsing a file means reading in a data stream of some sort and building an in memory model of the semantic content of that data. This aims at facilitating perfoming some kind of transformation on the data.
* In this program, we are parsing a file that contains some Test result data of a particular IC engine designed.
* In this file, there is a header content like the parameters and unit of the parameters and main content like the obtained result.
* There are actually 16 engine parameters from
1. Crank angle (DEG),
2. Pressure (MPa),
3. Maximum Pressure (MPa),
4. Minimum Pressure (MPa),
5. Mean Temperature (K),
6. Max Temperature (K),
7. Min Temperature (K),
8. Volume (m^3),
9. Mass Density (kg),
10. Integrated_HR (kg/m^3),
11. HR_Rate (J),
12. C_p (J/kg-K),
13. C_v (J/kg-K),
14. Gamma,
15. Kinectic Viscosity (m^2/s),
16. Dynamic Viscosity (N*s/m^2)
* The main idea of this python coding is create a data simulator that analyses and obtains the results out of the analysed data automatically, as per user inputs.
* We are parsing the given file which has all the data as given above, to obtain some useful analytical outputs out of it, as desired by the user by taking user inputs.
* Extracting all the values and storing it in individual array is the first step, then after taking the user inputs, the results are printed and plotting is made accordingly is what is done in this python program of data analysis.
* From this particular test results from the Engine_data file, we are using all the extracted data to find out certain Engine performance criteria like,
1. The Work done by the Engine.
2. The Power output of the Engine in Kw, at a given Engine speed.
3. The Specific Fuel Consumption of the engine.
* For Analysing the all the huge amount of data from the given file and using that to plot various graphs, and to calculate some important results in the arae of engine's performance, we are using the python program given below.
Python Program for analysisng Data:
# Importing Libraries
import math
import numpy as np
import matplotlib.pyplot as plt

# checking the file compatability
file_name = input('\n    Enter file_name - ')
if file_name == ('engine_data.OUT'):
	# Parsing the File
	crank_angle = []
	pressure = []
	Max_Pres = []
	Min_Pres = []
	Mean_Temp = []
	Max_Temp = []
	Min_Temp = []
	Volume = []
	Mass = []
	Density = []
	Integrated_HR = []
	HR_Rate = []
	C_p = []
	C_v = []
	Gamma = []
	Kin_Visc = []
	Dyn_Visc = []

	# Array to store parameters & units
	parameter=[]
	unit=[]
	line_count = 1
	ct = 1
	counter = 1
	for line in open('engine_data.OUT'):
		if '#' in line:
			if ct == 3:
				parameter.append(line.split())

			ct = ct + 1
			if counter == 4:
				unit.append(line.split())
			counter = counter + 1
		if '#' not in line:
			crank_angle.append(float(line.split()[0]))
			pressure.append(float(line.split()[1]))
			Max_Pres.append(float(line.split()[2]))
			Min_Pres.append(float(line.split()[3]))
			Mean_Temp.append(float(line.split()[4]))
			Max_Temp.append(float(line.split()[5]))
			Min_Temp.append(float(line.split()[6]))
			Volume.append(float(line.split()[7]))
			Mass.append(float(line.split()[8]))
			Density.append(float(line.split()[9]))
			Integrated_HR.append(float(line.split()[10]))
			HR_Rate.append(float(line.split()[11]))
			C_p.append(float(line.split()[12]))
			C_v.append(float(line.split()[13]))
			Gamma.append(float(line.split()[14]))
			Kin_Visc.append(float(line.split()[15]))
			Dyn_Visc.append(float(line.split()[16]))
			line_count = line_count +1

# specifying parameters to plot
	select_parameter = [0,crank_angle,pressure,Max_Pres,Min_Pres,Mean_Temp,Max_Temp,Min_Temp,Volume,Mass,Density,Integrated_HR,HR_Rate,C_p,C_v,Gamma,Kin_Visc,Dyn_Visc]

# Creating User Interface for the program
	print('\n\n---------------------------------------------------Analysing an IC Engines Result Parameters and ploting the Data-----------------------------------------------')
	print('\n\n  1. Crankangle(Deg)\n  2. pressure(Mpa)\n  3. Maximum_Pressure(Mpa)\n  4. Minimum_Pressure(Mpa)\n  5. Mean_Temperature(K)\n  6. Maximum_Temperature(K)\n  7. Minimum_Temperature(K)\n  8. Volume(m^3)\n  9. Mass(Kg)\n 10. Density(Kg/m^3)\n 11. Integrated_Hr(J)\n 12. Hr_rate(J/Time)\n 13. C_p(J/KgK)\n 14. C_v(J/KgK)\n 15. Gamma\n 16. Kinetic_viscosity(m^2/s)\n 17. Dynamic_viscosity(Ns/m^2)')
	print('\n Select different x & y Input parameters, only From the List given above . \n Do not enter 0 or any other number beyond the List given above')

	x = int(input(' \n\n Enter the x_axis parameter to plot the data - '))

	y = int(input(' \n Enter the y_axis parameter to plot the data - '))


# Plotting the data
	for i in range (0,len(parameter)):
		for j in range (0,len(unit)):
			fig = plt.figure(linewidth=5,edgecolor ="k")
			plt.plot(select_parameter[x],select_parameter[y],linewidth=3)
			plt.xlabel(parameter[0][x]+unit[0][x],size = '10')
			plt.ylabel(parameter[0][y]+unit[0][y],size = '10')
			plt.title(parameter[0][y] +' VS ' + parameter[0][x],color = 'b', size = '14')
			plt.savefig(parameter[0][y] +' VS ' + parameter[0][x]+'.png')


# Engine performance calculation

	print('\n\n\n---------------------------------------------------------------------Engine Performance calculation-----------------------------------------------------------')
	Fuel_consumption = float(input(' \n Enter the value of Fuel consumption (Micro gram /stroke) - '))

	RPM = float(input(' \n Enter the Engine speed in RPM - '))


# Calculating work done by the engine, which is equal to area under PV curve
# The area under a curve can be solved using Trapeziodal rule and in python we can use ' Trapz ' from Numpy module

	work_done = np.trapz(select_parameter[2],select_parameter[8])

# As we have pressure in 'Mpa' we need to convert to 'pascal'

	work_done = (work_done * pow(10,6))
	print('\n\n 1.  Work done by the engine                                                  = %.5f' %(work_done),'J')

# Power Produced by the engine in watt = workdone * engine speed ( 1 Watt = J/second, so converting engine speed from RPM to revolution per second)
# Since we need power in kw we do power * 10^-3

	power = (work_done*(RPM/60)) / 1000
	print('\n 2.  Power output of the engine                                               = %.5f' %(power),'Kw')

# Specific fuel consumption(g/kw.hr) = fuel consumption(grams/hour) / power(kw)
# As we take input for fuel consumption in (Micrograms/second) we convert to (grams/hour) by multiplying with 0.0036. Also the speed of the engine is to be considered.
# Finding the fuel consumption per second from the given fuel consumption per stroke
# The input of fuel consumption is given in Micrograms / stroke and here we are assuming a 4 stroke IC Engine and so the exact amount of fuel per second for the given engine speed is calculated.
# First engine speed RPM is converted to RPS. As 4 stroke makes 1 revolution in 4 stroke engine, how much fuel consumed per second for the given engine speed (RPS) is calculated in microgram / second

	RPS = RPM / 60
	Total_strokes = 4 * RPS
	Fuel_consumption = Fuel_consumption * Total_strokes
	specific_fuel_consumption = (Fuel_consumption * 0.0036) / power
	print('\n 3. The Fuel consumption / Second at given engine speed                       = %.5f' %(Fuel_consumption),'Microgram / second')
	print('\n 4.  Specific Fuel Consumption of the engine @ the given Engine speed by user = %.5f' %(specific_fuel_consumption),'g/kw.hr')


else:
	print('File Not recognised. Please provide a valid CONVERGE OUTPUT File')
* First all the required libraries like math, numpy, matplot.lib is imported for executing the code.
* Then as the first step we need to do the compatability test, (i.e) if the provided file name by the user is wrong then the code should not run further, so the whole program is brought under a 'if condition'.
* Only if the user provided file name matches with the given 'if condition' statement the code will execute further if not it will ask for the correct file, by printing an error message.
* Then emepty arrays are being created with their own respective parameter names, to store the extracted values from the datafile.
* It stores all the header line content which is the parameters and their units as strings and other output values in the remaining lines is stored with their respective column names.
* This process of extracting and storing the data items is done using a 'for loop' by reading the data based on certain 'if conditional loops'. Counter is given to keep track of the line number.
* In the data file the third line contains the individual Column names and the fourth line contains its respective units. Those are stored as strings into an array called parameters and Units by using 'counter' value in a 'if condition'.
* The further lines in the data file has the test result values and it is first splitted using ' line.split' command to seperate all the values according to their column lines. It is stored as float variables into respective arrays with the names as their column names by using the same process done above.
* For plotting the results of the data extracted as per the user column number input, we need to call the arrays with their position number. We cannot call with its parameter name as the user will be giving numerical inputs.
* For doing this we are creating an array called, 'Select_parameters' and we are storing all the extracted values with their column names into that array. As python considers '0' as the initial value we are giving '0' at the first and then we enter all the remaining array, so that the user input 1 will correspond to the respective column name that is the 'Crank degree'.
* By doing this we can call all the values of the individual columns just by providing their Position numbers, from 1 to 17 as we have 17 columns in total in the data file.
* Then we are printing comment lines to create the user interface for the program by providing all the neccessary statements and the parameters to be called by the program to obtain result plot as required.
* Then the user is asked to enter two inputs as x & y using the command 'input'.
* The input user enters is changed to integer and the first and second user inputs are stored as x and y integer values.
* Then the plotting is done by using the data as required by the user. The x axis and y axis variables are specified as, plt.plot(select_parameter[x],select_parameter[y],linewidth=3).
* In this line of code we have given the x axis values as 'Select_parameter[x]'. Select_parameter is the array that contains all the data under its specific column names, while we put select_parameters along with the user's first input (from integer 1 to 17) it automatically calls the appropriate dataset not by its column name but by the position in the selected_parameter list.
* Similarly the y axis also takes in the input as x axis and makes the neccessary plot, while the code gets executed.
* For labelling the plots automatically we are using these line of codes, 'plt.xlabel(parameter[0][x]+unit[0][x],size = '10') '&' plt.ylabel(parameter[0][y]+unit[0][y],size = '10')'
* Here we are doing the same process of making appropriate x axis labels and y axis labels according to the plot required by the user automatically. The array 'parameter' has stored all the column names as string variables. By using the same logic done before, we are calling the column name according to the position that user specifies as x and y inputs.
* Based on the inputs, the column names along with their units are extracted to match the plots made according to the user requirements. Since this list is under another list, we are giving '[0]' array before the [x] and [y] array so that there will not be any index errors.
* Then the appropriate titles are given to the plots made out of user's choice automatically using the same logic.
* Then the plots are saved as figures in the program folder with the Title as their file names.
Engine Performance Calculation:
* The next step is to calculate certain engine's performance factor using the extracted data from the given converge test output file.
* Before calculating the performance factors, we are printing certain statements to create the user interface.
* Based on the Converge Results obtained in the datafile, our idea is to calculate the workdone by this particular engine then with the help of the workdone calculated we need to find the Power output (Kw) of the engine at given crank speed (RPM).
* Then by knowing the Amount of Fuel consumed / Stroke, we need to find the specific fuel consumption of this particular engine at the given output power.
* For doing these calculation we have assumed some input factors for this engine which are given below,
1. Assumed Engine speed = 1500 RPM
2. Assumed Fuel consumed / Stroke = 20 Micrograms / stroke
* First we are getting the user inputs for Fuel consumed / Stroke (Mg/second) and the Engine speed values (Rpm) using 'input' command.
(i) Work Done:
* When a force causes a body to move, work is being done on the object by the force. Work is the measure of energy transfer when a force (F) moves an object through a distance (d).
* So when work is done, energy has been transferred from one energy store to another, and so: energy transferred = work done.
* All standard heat engines (steam, gasoline, diesel) work by supplying heat to a gas, the gas then expands in a cylinder and pushes a piston to do its work.
* If we press the piston downward, the volume of the gas will decrease. Since the gas is being compressed we can also say for sure that positive work is being done on the gas.
* The work done during a thermodynamic process is equal to the Area under the curve as seen in the diagram below.


* The area under the curve will still represent the work done. For any curved path we can imagine breaking the area into an infinite amount of infinitesimally thin rectangles.
* The area of each rectangle would represent the work done during each infinitesimal step, and the sum of the areas would represent the total work done for the entire process.
* This Area under the curve can be evaluated using a command of 'Trapz' from Numpy module. The trapezoid rule gives a better approximation of a definite integral by summing the areas of the trapezoids connecting the points.
* In Trapezoidal rule – y-axis locations of points will be taken from y array, by default x-axis distances between points will be 1.0, alternatively they can be provided with x array or with dx scalar. Return value will be equal to combined area under the red lines.
* The area under the PV Curve gives the Work done. In the data file the Column number 2 is pressure (Mpa) and column number 8 is Volume (m³).
* The line of code, work_done = np.trapz(select_parameter[2],select_parameter[8]) will evaluate the datapoints of Pressure which is Select_parameter_2 and datapoints of Volume which is Select_parameter_8, by the Trapezoidal rule using the 'Trapz' function from numpy.
* Since the pressure values in the data file is in Mpa, it has to be converted to Pascal, so that we may get the workdone in Joule. To do this we multiply the above value of arae under the curve with 10^6 and now the workdone is calculated by finding the Area under the curve using Trapezoidal rule in Joule.
(ii) Power Output:
* The power output of the Engine at a given engine speed is calculated using the work done by the engine.
* Power is how much work can be done in a period of time. That means, the amount of work done when related to the engine speed which is revolution per Minute (Rpm), gives the power.
* Power Produced by the engine is,
P (watt) = Workdone * engine speed
( 1 Watt = J/second, so converting engine speed from RPM to revolution per second RPS by / with 60)
* Since we need power in kw we do multiply the Power with 10^-3 and so we get the power in Kw and this is executed using, power = (work_done*(RPM/60)) / 1000 this line of code.
Specific Fuel consumption:
* The Specific fuel consumption is the amount of fuel consumed for a time period and the Power that is produced for that consumed fuel.
* Specific fuel consumption is a measure of the fuel efficiency of any prime mover that burns fuel and produces rotational, or shaft power. It is typically used for comparing the efficiency of Internal combustion engines with a shaft output.
* It is the rate of fuel consumption divided by the power produced. It may also be thought of as power-Specific fuel consumption, for this reason. Specific fuel consumption allows the fuel efficiency of different engines to be directly compared.
Specific fuel consumption = Fuel consumption at a Time period / Power output
* Fuel consumed at a time period is given as 20 micro gram / stroke.
* Considering the engine to be a four stroke IC Engine, which means 1 revolution of engine crank is achieved with four stroke of operation.
* Here we have assumed 20 micro grams is the consumed amount of fuel for 1 stroke and so we need to find how much exactly the amount of fuel is consumed for 1500 Revolutions of engine crank, as we found the rated power at this particular engine speed of 1500 RPM.
* As we need the Fuel consumption / second at the particular engine speed we convert the engine speed from Revolution / minute to Revolution / second, which gives 1500 RPM = 25 RPS
* So for a 4 stroke IC engine 1 Revolution = 4 strokes , The number of strokes for doing 25 revolution / sec, would be = 100 strokes per second.
* The amount of fuel consumed per stroke = 20 micrograms.
* So in Total the amount of fuel consumed at that particular moment of 1500 rpm or 25 rps of engine speed = 20 * 100 = 2000 Micrograms / second.
* Now the 2000 Microgram / second is consumed amount of fuel at 1500RPM of engine speed in Micrograms / second.
* The specific fuel is finally calculated by dividing the Fuel consumed per second (Micrograms/second) with the power output at the particular engine speed (Kw).
* To get the result of specific fuel consumed in the unit of (Grams/ K.w.hr ) we multiply the fuel consumed which is in (micrograms/second) with '0.0036' and finally the specific fuel consumed at given speed is calculated.
* Now the calculated results are printed accordingly.
* Then, in the beginning of the program we provided a 'if' condition for the compatability check and now we end that using an 'else' statement. Suppose the user enters wrong file name the code we provided will not execute and will show the error message which we have provided using 'else; statement.
The User Interface Where the user gives input :
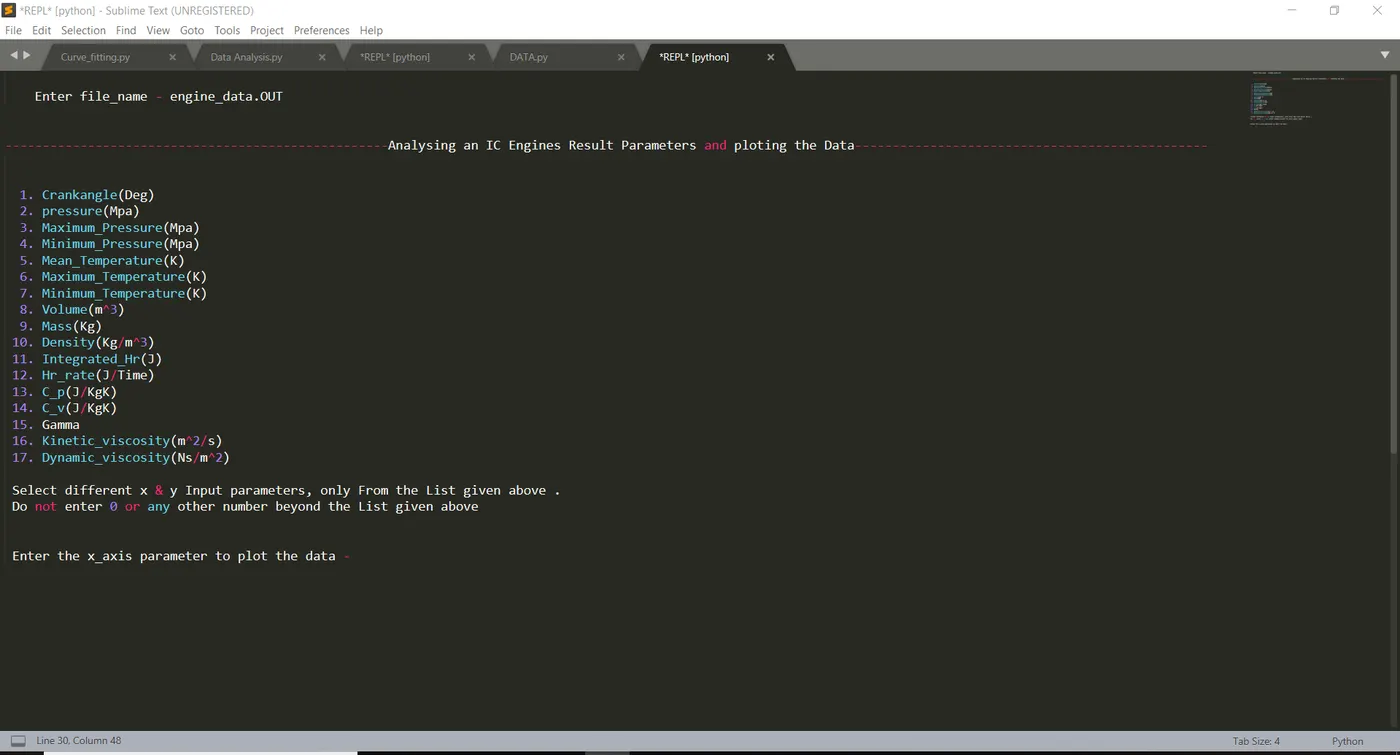
* This is the screen where the user needs to enter the correct file name in order to access it and proceed with the rest of the program.
* Here it takes the user inputs for plotting the graph between any two above mentioned parameters in x & y axis.
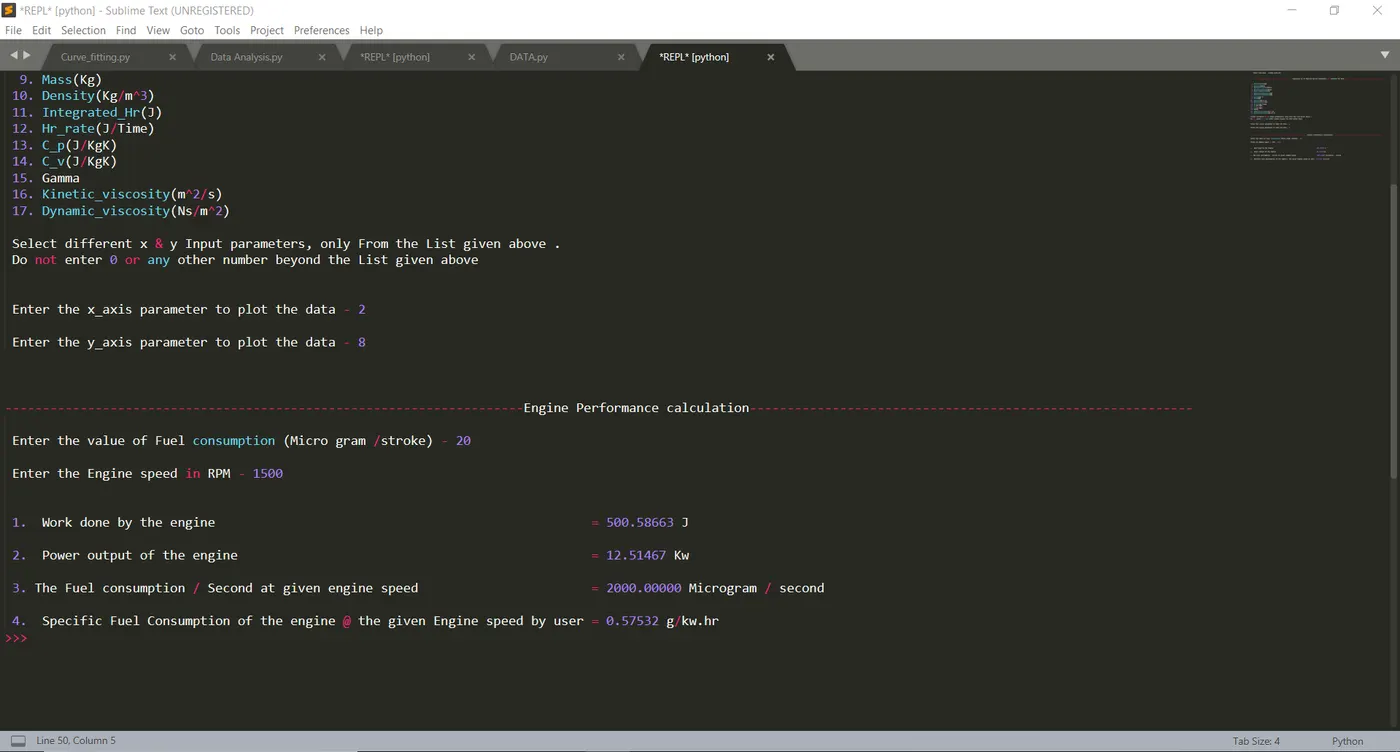
* In this we are specifying the assumed factors that we consider in order to perform certain engine performance calculation.
* The user specifies the Assumed Fuel consumption in MicroGrams / stroke and also the engine speed in RPM at which all the performance factors like power output, fuel consumption/second and specific fuel consumption is calculated.
Result:
* The result obtained from the above Data analysis program is listed below,
* For the Engine speed @ 1500 RPM & Fuel consumption @ 20 Micro Grams / stroke, in a 4 stroke IC Engine (Assumed) the results are,
1. Work done by the engine = 500.58663 J
2. Power output of the engine = 12.51467 Kw
3. The Fuel consumption / Second at given engine speed = 2000.00000 Microgram / second
4. Specific Fuel Consumption of the engine @ the given Engine speed = 0.57532 g/kw.hr
* These are the results obtained from the Test results of the converge Data file with certain Assumed conditions. Similarly we can obtain results for different values of engine speed and fuel consumption too and can study and evaluate the engine performance criteria respectively.
Plotting of Engine parameters:
* The plots are made as per the user inputs and all the X-axis and Y-axis labels along with the Title is saved as seperate figures and stored in seperate files with their respective column names, automatically.
Crack angle (Degree) vs Pressure (Mpa):
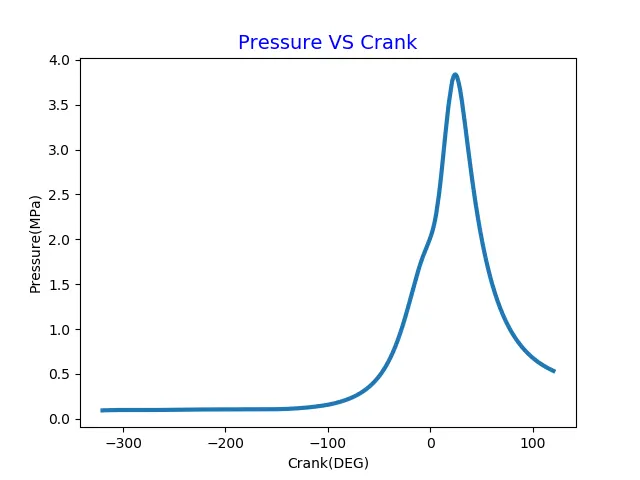
* The user gives the x and y inputs as 2 and 8 respectively and the appropriate plots are made automatically with proper Title and labelling.
* In the Converge Output file the 2nd column is the Crack Angle in Degree and the 8th column is the Pressure in Mpa. When user gives 2 and 8 as x & y inputs it automatically makes the corresponding plots with all the neccessary labels and stores it in the file with their respective name in a directory.
* The data is analysed by read it and it got processed by storing it in respective arrays and it got executed when the user requires it as plots and got saved as individual figures.
* Thus this python code performend the neccessary data analysis task as required by the user.
C_P (J / Kg.K) vs C_v (J / Kg.K):
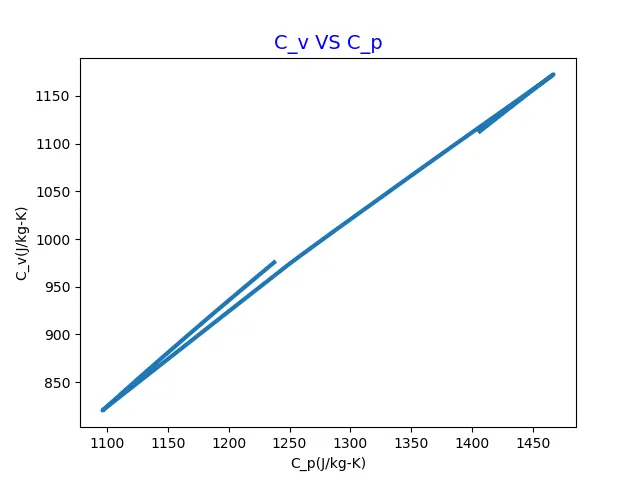
* The user gives the x and y inputs as 13 and 14 respectively and the appropriate plots are made automatically with proper Title and labelling.
* In the Converge Output file the 13th column is the C_P in (J/Kg.K) and the 14th column is the C_V in (J/Kg.K). When user gives 13 and 14 as x & y inputs it automatically makes the corresponding plots with all the neccessary labels and stores it in the file with their respective name in a directory.
* The data is analysed by reading it and it got processed by storing it in respective arrays and it got executed when the user requires it as plots and got saved as individual figures.
* Thus the above python codes, performed the neccessary data analysis task as required by the user.
* Like wise based on the User inputs the plots are generated automatically through this python codes for data analysis.
The Folder where the plots gets saved:
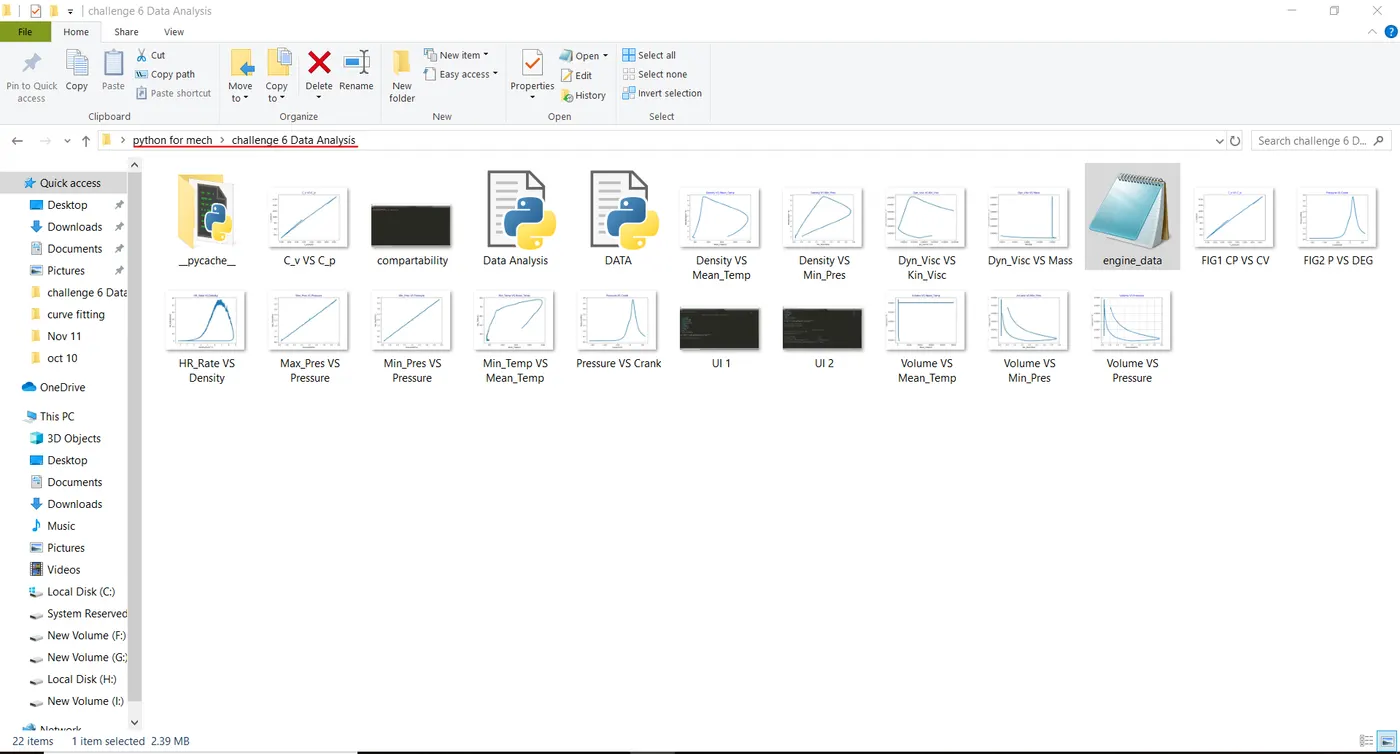
* In this file the Individual Figures as per user inputs is saved with their appropriate names as their file name.
* The python code written does this work in a easy way and it is also easy for the user to study the results made with hepl of individual plots.
Compatability Test:
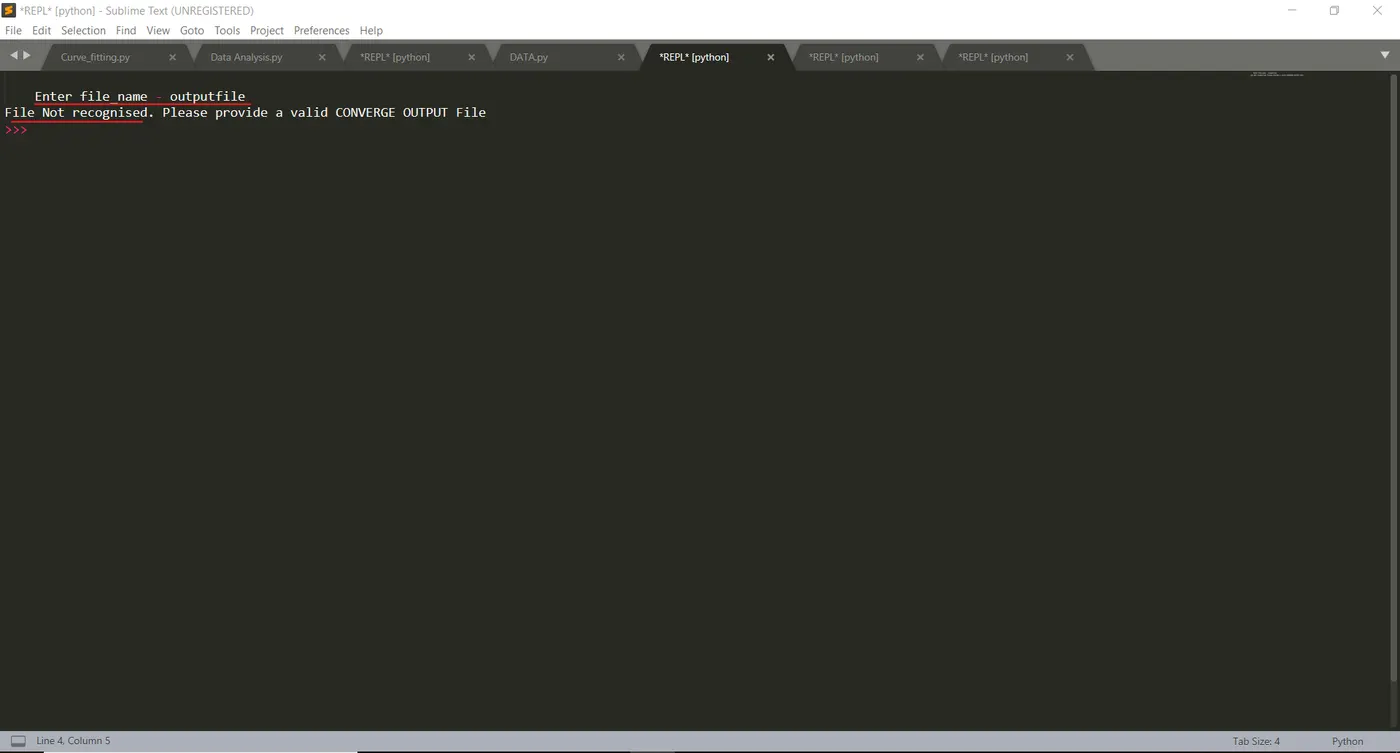
* The user is asked to provide the proper file name to access the data file that contains all the neccessary Test outputs in order to process the data as per user requirements.
* The compatability test is done to check whether the program stops executing the codes when wrong file name is specified.
* Clearly it is seen that when wrong file name is given or any other name other than the correct one that is " engine_data.OUT" the program stops proceeding further and in the user interface page it shows an error message pointing that the entered file name is wrong and cannot be accessed.
* Thus the python code is done to analyse a data file containing enormous amount of data and it is processed properly and it is made to obtain the results and plots required by the user.
* The same method of coding can be done to fit in any data file and analyse it and retrive useful information out of the Raw datafile.
* For example, in this data file while analysing the Engine Performance results we assumed a 4 stroke engine with some basic parameters. When this program is slightly altered just by changing the inputs and condition specified we can get different results accordingly using this same program, which is very much useful indeed.
* Thus the python program of data analysis is done to plot the different parametrs as per user inputs and label them automatically with appropriate labels and also Certain Performance factors have been analysed and calculated using thsi Python Program.
References:
1. https://en.wikipedia.org/wiki/Brake-specific_fuel_consumption