Week 6 - Data analysis
Aim:
Write a python code to analyse the data by parsing the output file of engine simulation.
Objective:
- Write a code to check the compatibility of the file.
- Write a code to parse the data and extract user defined data types.
- Plot the graphs according to user requirement.
- Calculate the area under PV diagram, power output of the engine and specific fuel consumption.
Theory:
Generally output data from engineering simulations contains a large data and to extract the required data from the output files can be done by parsing the data. Parsing arranges the data in a form such that it can be easily used accordingly.
Work done by an engine is equal to the area under the PV diagram.
Power output of the engine:
Power is the rate at which the work is done.
`P = ("Work done")/dt`
`= (W*2*pi*n)`
`= (W*2*pi*N)/60`
Where,
P is power output in kW
n is speed(rev/s)
N is speed (RPM)
Specific fuel consumption:
Specific fuel consumption is the amount of fuel consumed by an engine for each unit of power output
`SFC = (3600*m_f*n)/(power`
= (m_f*N)/(60*P)`
where,
SFC is specific fuel consumption in g/kW-h.
`m_f` is fuel consumption per stroke in grams.
Programming Language: Python
# Data Analysis- Pharsing the coverge output file.
# By Manikanteshwara reddy
import math
import matplotlib.pyplot as plt
import numpy as np
from scipy.integrate import simps as simps, trapz as trapz

#File input
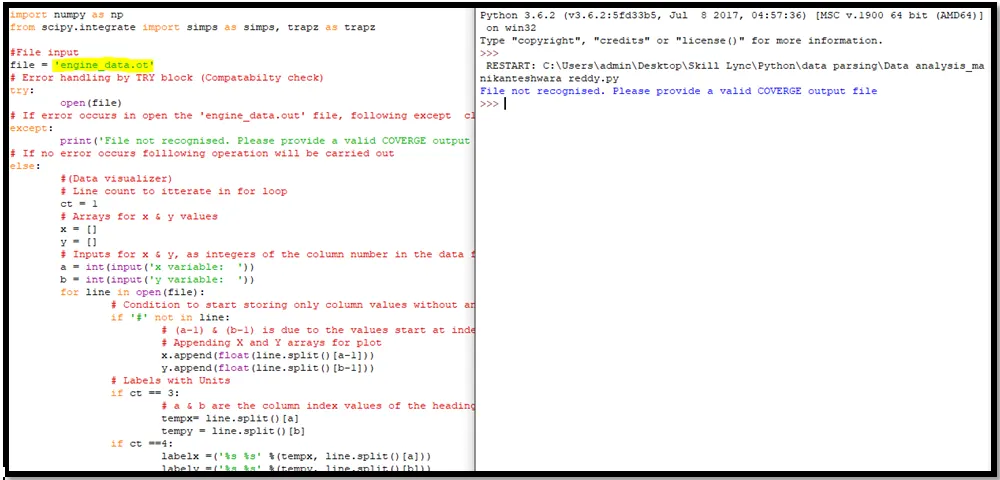
file = 'engine_data.out'
# Error handling by TRY block (Compatabilty check)
try:
	open(file)
# If error occurs in open the 'engine_data.out' file, following except  clause will be executed
except:
	print('File not recognised. Please provide a valid COVERGE output file')
# If no error occurs folllowing operation will be carried out
else:
        #(Data visualizer)
	# Line count to itterate in for loop
	ct = 1
	# Arrays for x & y values
	x = []
	y = []
	# Inputs for x & y, as integers of the column number in the data file
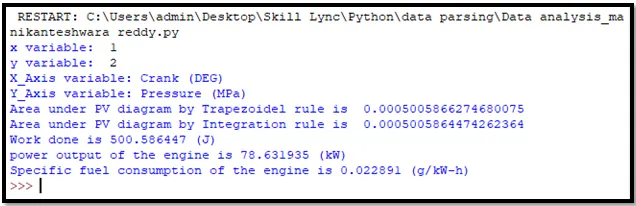
	a = int(input('x variable:  '))
	b = int(input('y variable:  '))
	for line in open(file):
		# Condition to start storing only column values without any text content
		if '#' not in line:
			# (a-1) & (b-1) is due to the values start at index of "0" in each line
			# Appending X and Y arrays for plot
			x.append(float(line.split()[a-1]))
			y.append(float(line.split()[b-1]))
		# Labels with Units
		if ct == 3:
			# a & b are the column index values of the heading text content in the line 3
			tempx= line.split()[a]
			tempy = line.split()[b]
		if ct ==4:
			labelx =('%s %s' %(tempx, line.split()[a]))
			labely =('%s %s' %(tempy, line.split()[b]))
			print('X_Axis variable:',labelx)
			print('Y_Axis variable:',labely)
		ct+=1
	# Plotting user requested inputs
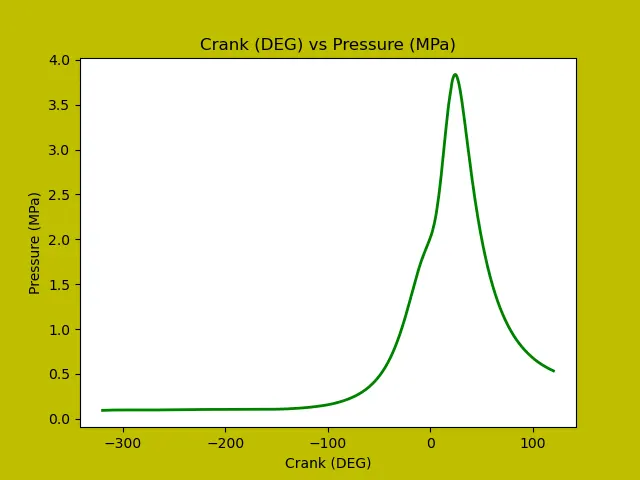
	plt.figure(1)
	plt.plot(x,y, linewidth = 2,color = "green")
	plt.title('%s vs %s' %(labelx,labely))
	plt.xlabel('%s' %labelx)
	plt.ylabel('%s' %labely)
	plt.savefig('%s vs %s' %(tempx,tempy), facecolor = 'y')

        #(Performance calculations)
        #PV - diagram
	ct = 1
	#  Pressure column and its array
	p_c = 2
	p = []
	# Volume column and its array
	v_c = 8
	v = []
	for line in open(file):
		if '#' not in line:
			p.append(float(line.split()[p_c-1]))
			v.append(float(line.split()[v_c-1]))
		if ct == 3:
			tempx= line.split()[v_c]
			tempy = line.split()[p_c]
		if ct ==4:
			labelx =('%s %s' %(tempx, line.split()[v_c]))
			labely =('%s %s' %(tempy, line.split()[p_c]))
		ct+=1
	# Plotting the PV diagram
	plt.figure(2)
	plt.plot(v,p, linewidth = 2, color = "blue")
	plt.title('%s vs %s' %(labelx,labely))
	plt.xlabel('%s' %labelx)
	plt.ylabel('%s' %labely)
	plt.savefig('%s vs %s' %(tempx,tempy), facecolor = 'c')

	# Area by trapezoid rule from data sample:
	A_t = trapz(p,v)
	print('Area under PV diagram by Trapezoidel rule is ', A_t)
	# Area by simpson's rule from data sample:
	A_i = simps(p,v)
	print('Area under PV diagram by Integration rule is ', A_i)

	N= 1500 #RPM
	f_c = 20*pow(10,-6) # micro gram,per cycle =>>{f_c*(N/60)} is fuel consumption per hour

	# Work done {J}
	work = A_i*pow(10,6)
	print('Work done is %f (J)' %work)
        #Powe calculation
	# power output {W}
	power = (2*math.pi*N*work)/60
	# Power output {KW}
	power = power / 1000
	print('power output of the engine is %f (kW)' %power)
        #Specific fuel consumption Calculation
	spc = (f_c*(N*60))/(power)
	print('Specific fuel consumption of the engine is %f (g/kW-h)' %spc)
In area calculation, the trapezoidal rule approximates the function as a straight line between the two adjacent points, while simpson rule approxiamtes the function as a parabola between the three adjacent points.
Result:
The above code is successfully executed and takes user inputs to plot the graphs.
- Compatability check:
Non- compatible file is provided as input
- Data visualizer:
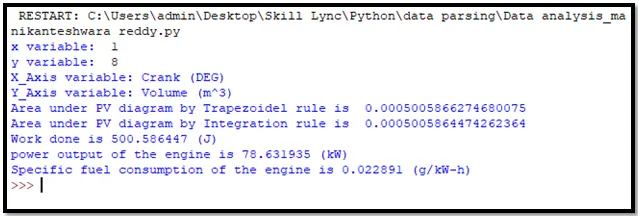
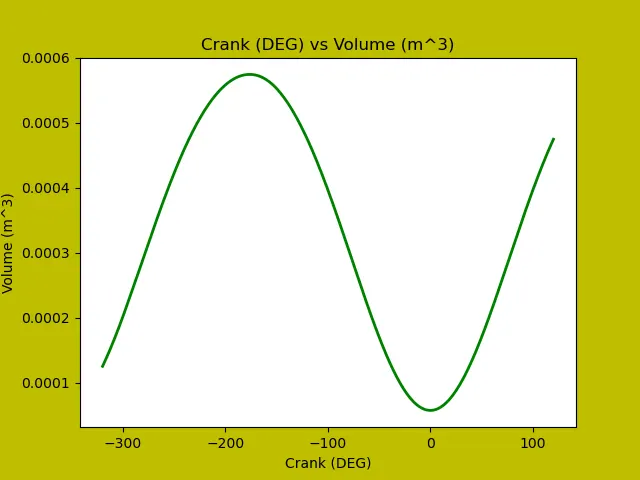
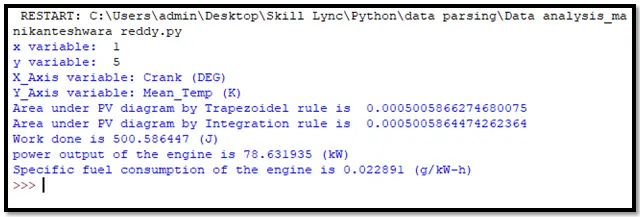
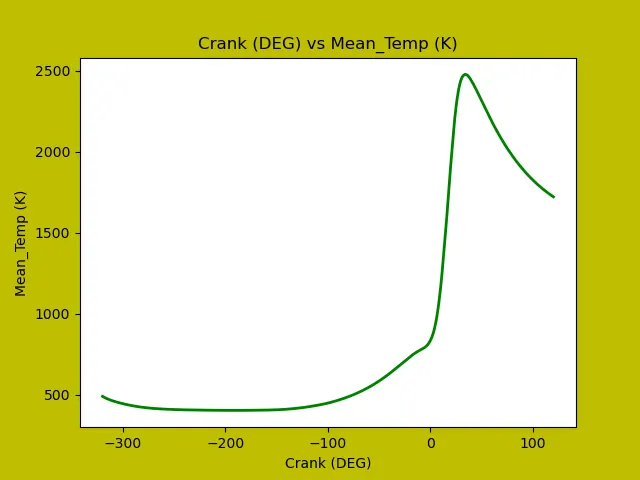
PV Diagram:
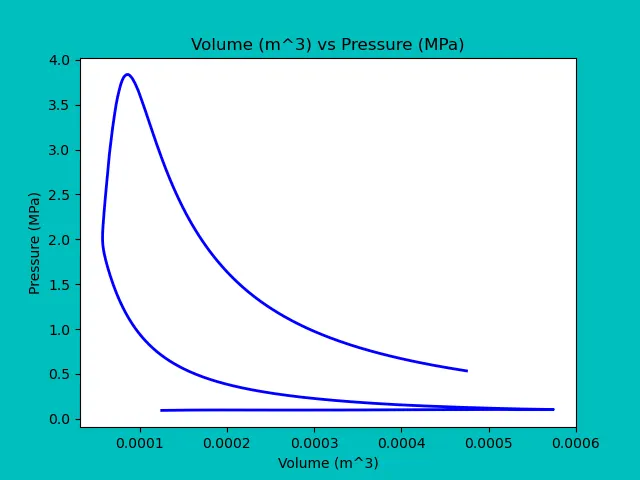
Area, power output and SPC are calculated and printed.