Week 6 - CHT Analysis on a Graphics card
AIM:
Perform a steady-state conjugate heat transfer analysis on a model of a graphics card. You can use appropriate materials of your choice for the simulation. Make sure to properly define the correct solid and fluid zones. Refer the video for further clarification and the model is provided below the video.
Run the simulation for best possible mesh with combination of coarse and refined mesh in different regions. Explain the reason for choosing the particular mesh settings
Objectives:
Run the simulation by varying the velocity from 1m/sec to 5m/sec for at least 3 velocities and discuss the results.
- Find out the maximum temperature and heat transfer coefficient attained by the processor.
- Prove that the simulation has achieved convergence with appropriate images and plots.
- Identify potential hotspots on the model.
Introduction and theory:
Conjugate heat transfer :
Conjugate heat transfer corresponds with the combination of heat transfer in solids and heat transfer in fluids. In solids, conduction often dominates whereas in fluids, convection usually dominates. Conjugate heat transfer is observed in many situations. For example, heat sinks are optimized to combine heat transfer by conduction in the heat sink with the convection in the surrounding fluid.
Graphic card :
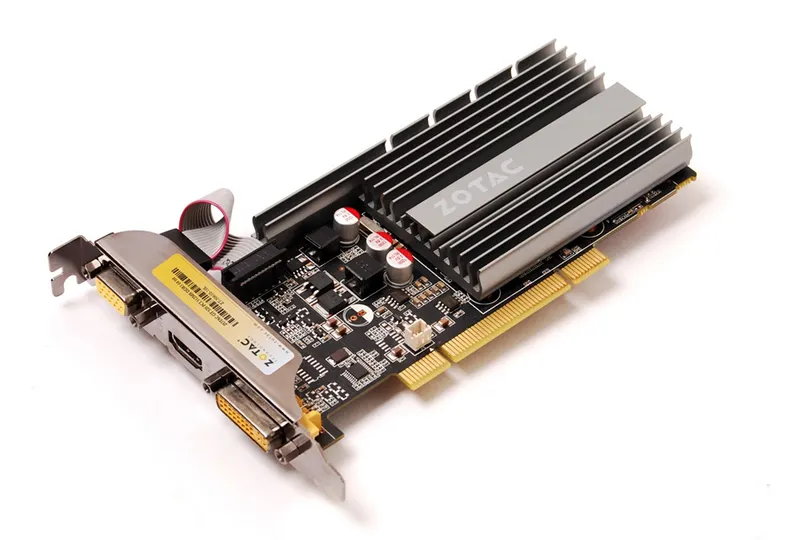
Graphic card is hardware which is used to increase the video memory of computer and make its display quality more high definition. It makes the computer more powerful and gives it the capacity to do more high level work. The quality of image depends on quality of graphic card.
We divided it in three different parts in geometry :
- Base
Base is made up of PCB with some mixed material coatings like glass, raisin and copper for electric flow. This is mostly made up of plastic like material and having copper wires in it to flow the current through it to semi-conductors and processor which we installed on it. And to avoid any problem the coating of glass is kept on that.
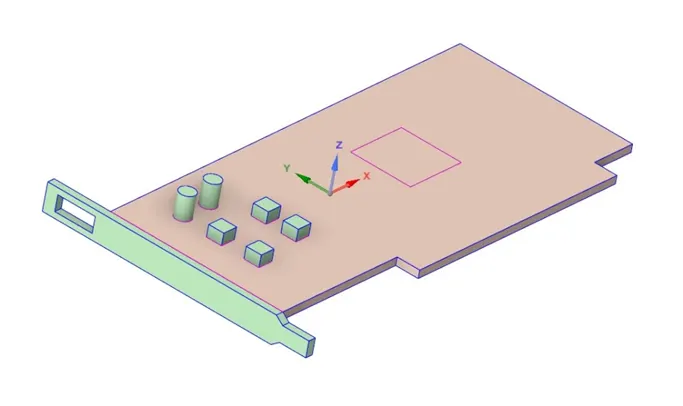
Fig 1. Base plate geometry
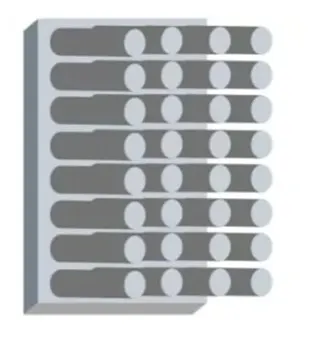
- Fins
Fins are provided on base plate at the top of processor to provide the colling effect to graphic card because the main part that creates the heat is processor so the finns are provided on top of it.
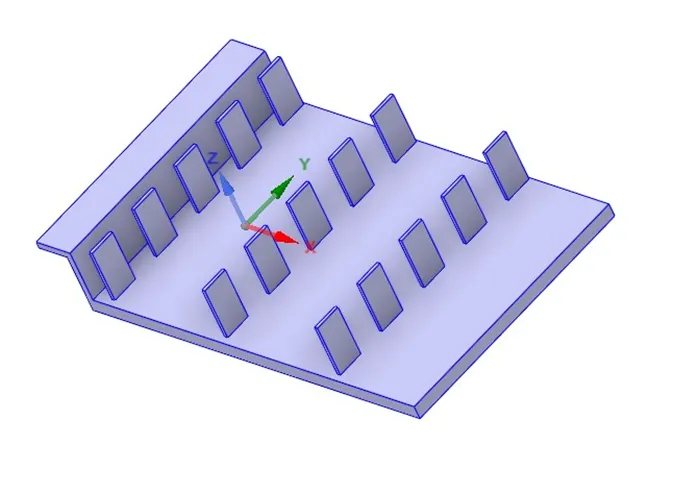
Fig 2. Finn geometry
There are three types of fins :
- Longitudinal fin
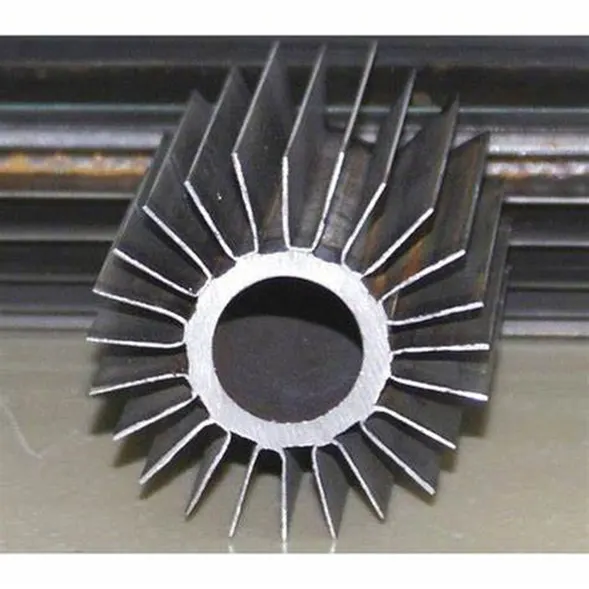
- Radial fin
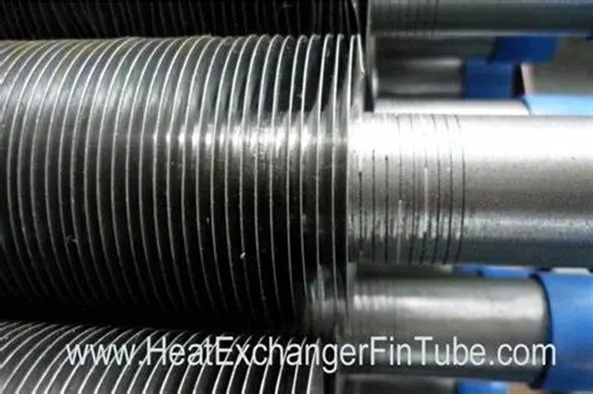
- Pin fin
- Processor
Processor is important component on the graphic card the component which is 80% working component in graphic card. And as we say above it creates the excessive temperature which heat up the graphic card and also can damage graphic card if not cooled.
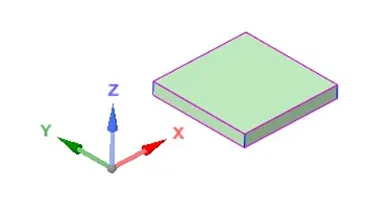
Fig 3. Processor geometry
Solving and modelling approach:
- Pre-processing :
In pre-processing first we create the base model means with normal mesh and just for the sake of idea that how the simulation goanna behave.
First we open geometry and make the share topology on for all the components or we can say to the geometry with enclosure.
Then we open the meshing module in which we make the mesh more detail by applying sizing to the geometry where we want more detail results near the geometry so we increase the refinement of mesh on main graphic card geometry and kept 2.5mm element size of enclosure while of graphic card value is 0.7.
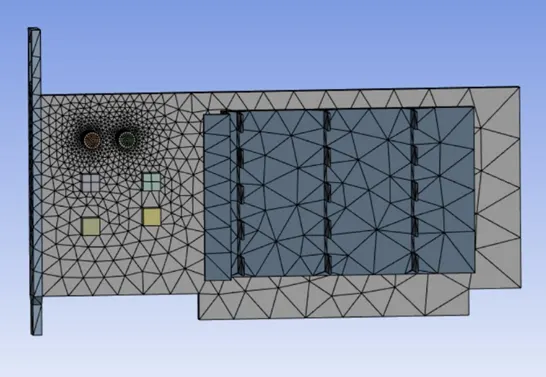
Fig 4. Baseline mesh
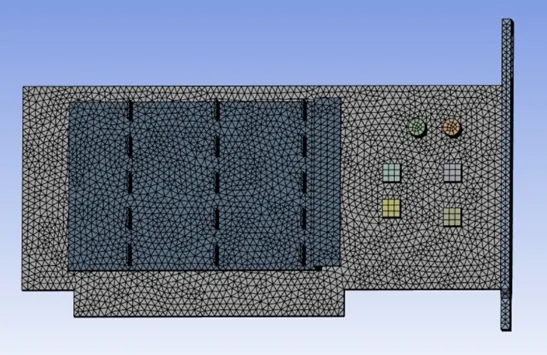
Fig 5. Refined mesh
- Setup :
solver:
In setup we select the pressure base solver as here we don’t have any need about density, with steady state time solver with no gravity implications as we have to focus more results and plots not on any movement w.r.t flow.
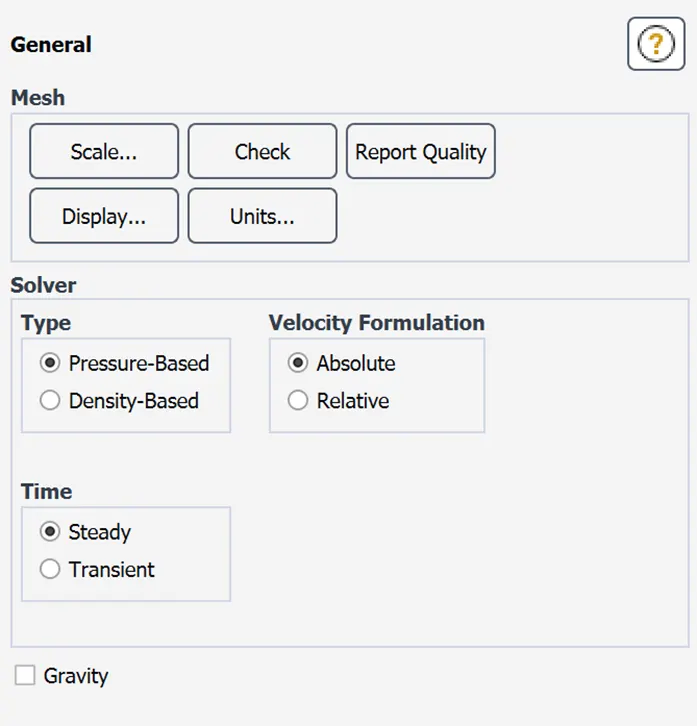
Fig 6. Solver setup
- Model :
Here we select the k-omega with sst as our viscous model as we have to watchout for the convection which mostly occurs near the walls. And also sst model gives us both advantage of k-omega as well as k-epsilon
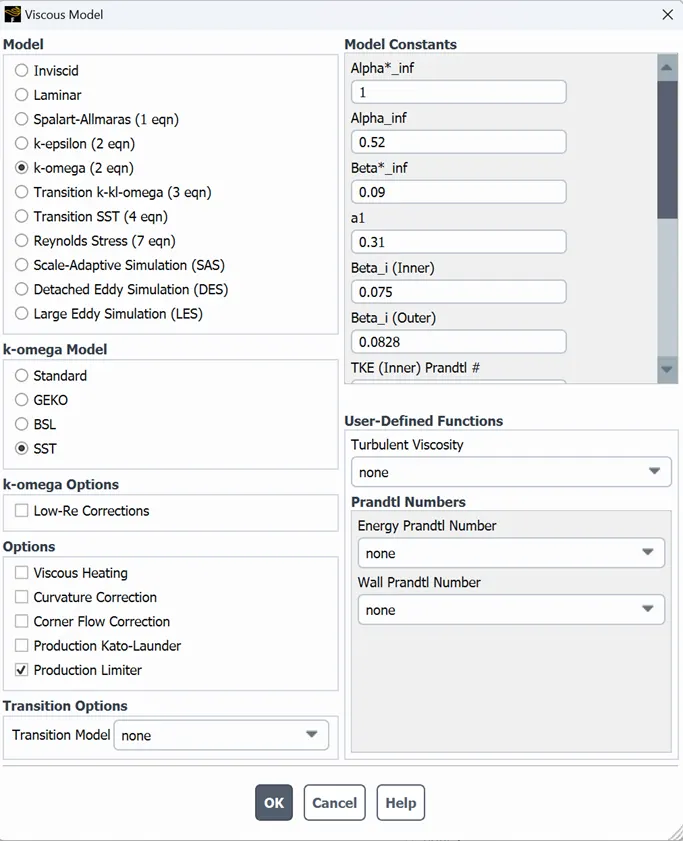
Fig 7. Model setup
- Material :
Here we have the different material for different part like fins for aluminium and coper for plate and then silicon for the processor. We get aluminium and copper in fluent database but the silicon is not there so we create one by using the properties of silicon.
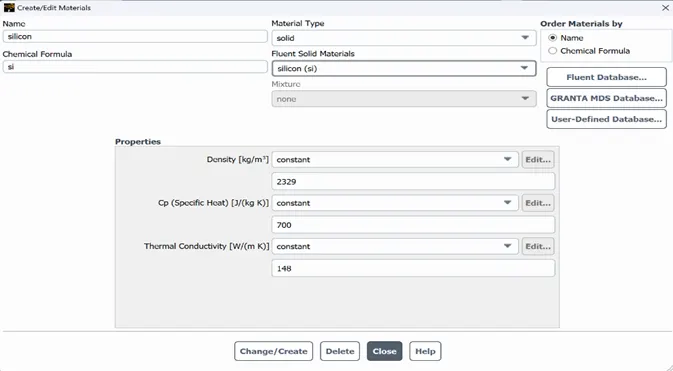
Fig 8. Creating material silicon
Now as we created the materials we also has to define those to the particular parts which we can do in the cell zones by going in cell zones we have to select the particular part and then click on the solid we want to assign for that. Which we can see in images below
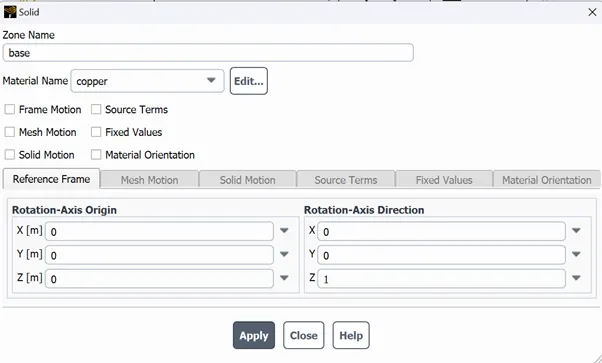
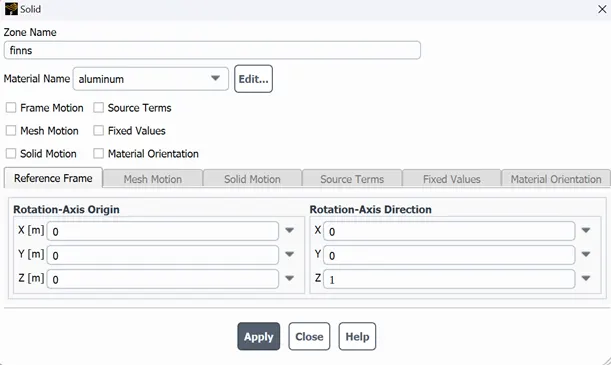
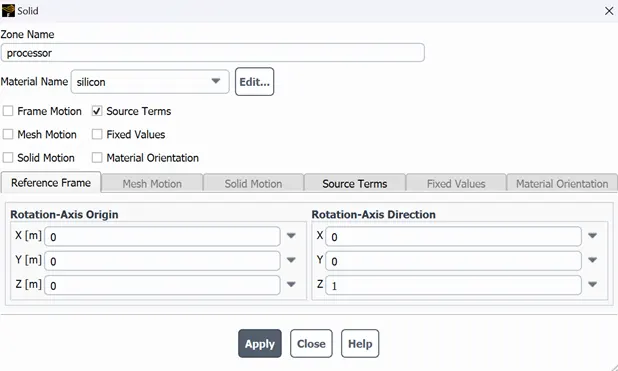
Fig 9. Defining solids materials to different parts
Now in above processor part we can see we enable the source term which means that it is the het generating source so our processor is heat generating source. Going in there we define the amount of heat generated from processor by using its unit
Its w/m^3 so we assume 1w energy will be produce and our length is 8mm so
1/(8e-3)^3
So we get the value, 15625000 w/m3
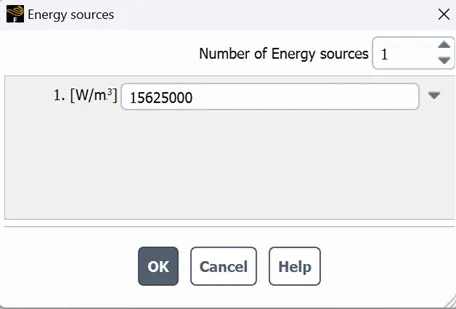
Fig 10. Energy source
- Post processing :
Now after running the simulation we got the results and plots lets see those
So here we run 3 cases :
- In first case where inlet velocity is 2m/s
Where we got this results
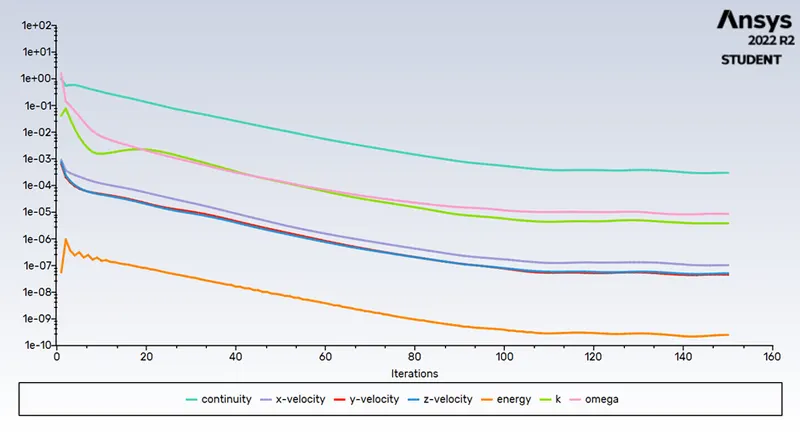
Fig 11. Scaled residuals for velocity 2m/s
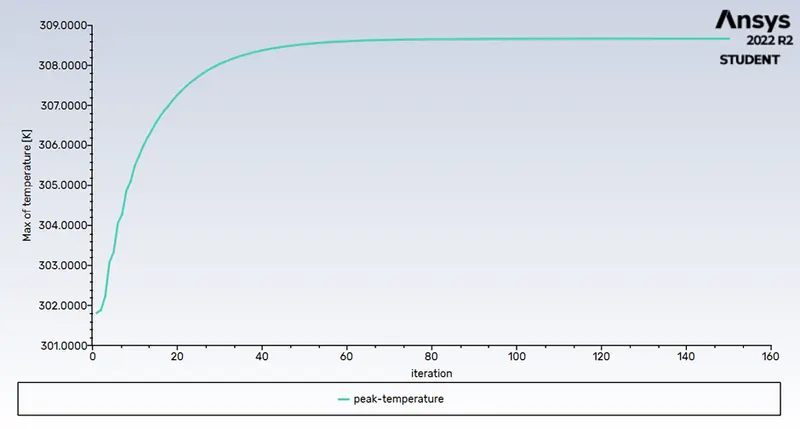
Fig 12. Peak temperature at velocity 2m/s
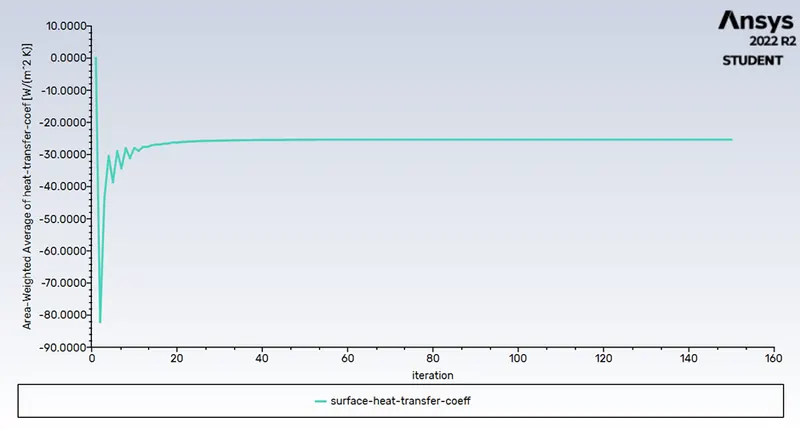
Fig 13. Surface heat transfer at velocity 2m/s
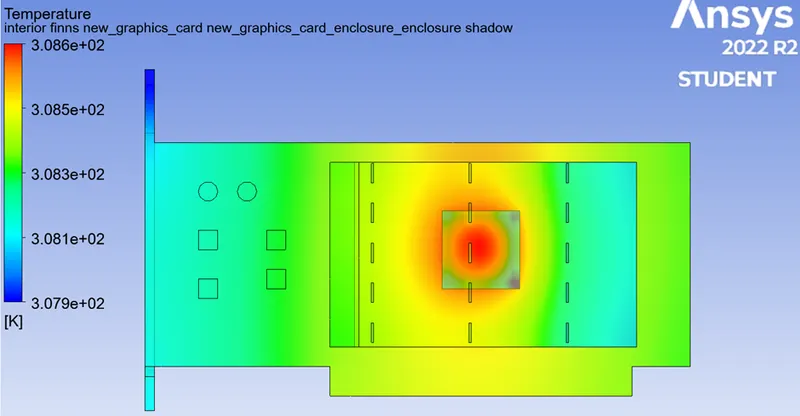
Fig 14. Hotspot in graphics card for velocity 2m/s
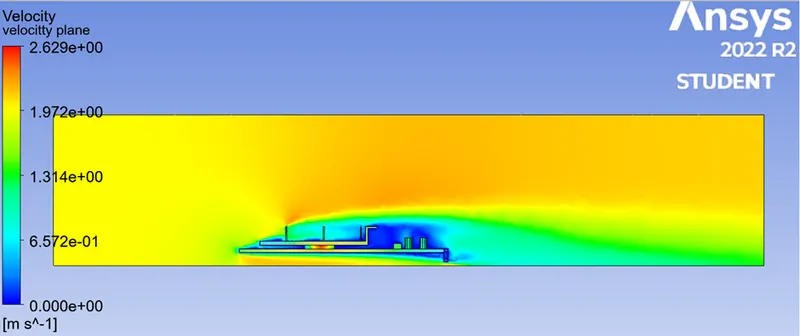
Fig 15. Flow velocity for velocity 2m/s
- Case where inlet velocity is 3m/s
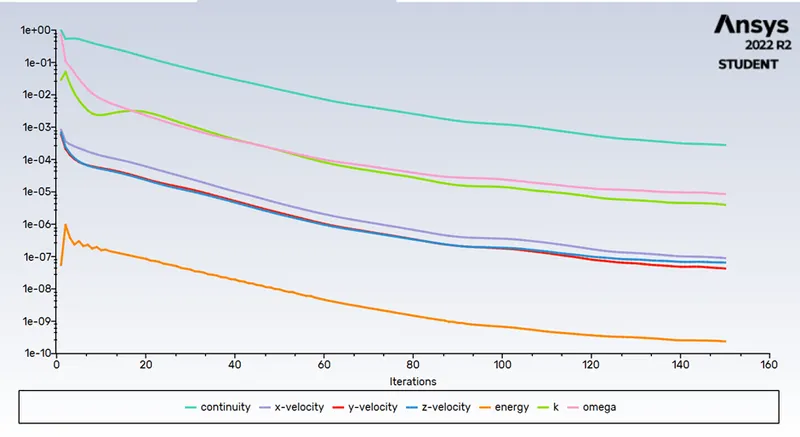
Fig 16. Scaled residuals at velocity 3m/s
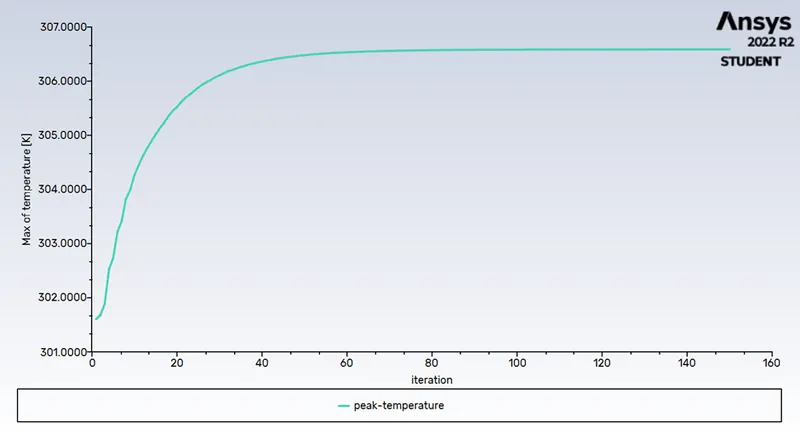
Fig 17. Peak temperature at velocity 3m/s
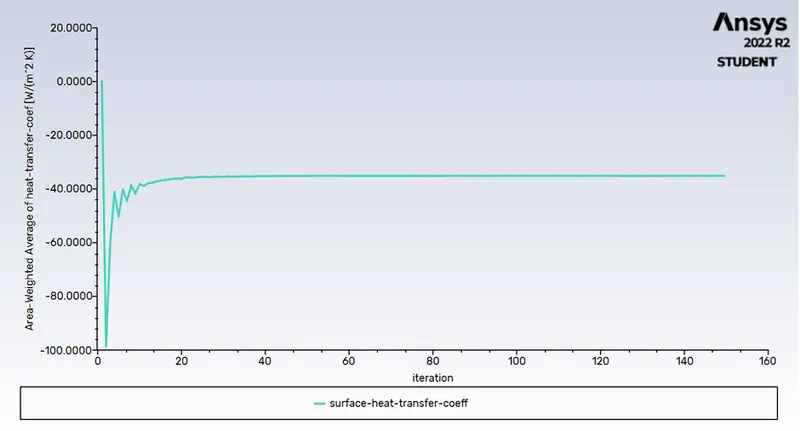
Fig 18. Surface heat transfer coeff at velocity 3m/s
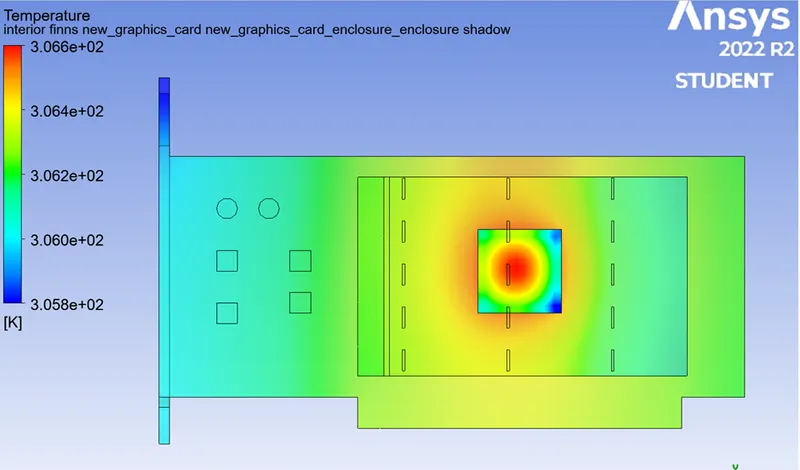
Fig 19. Temperature Hotspot at graphic card at velocity 3m/s
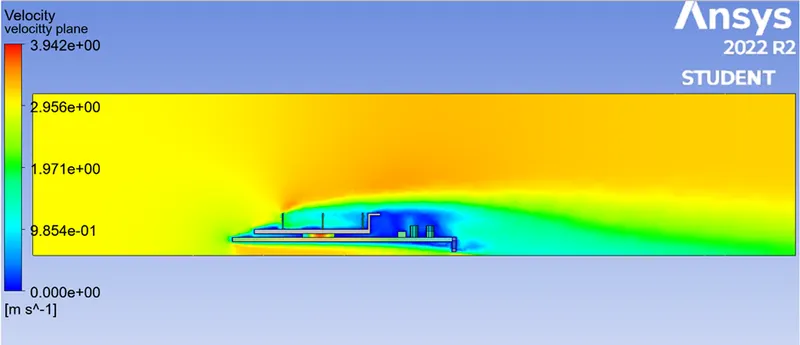
Fig 20. Flow velocity contour at velocity 3m/s
- Case 2 where velocity is 5m/s
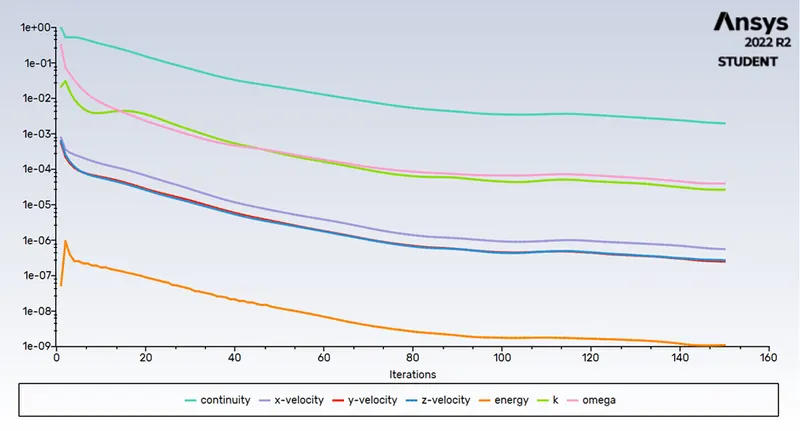
Fig 21. Scaled residuals for velocity 5m/s
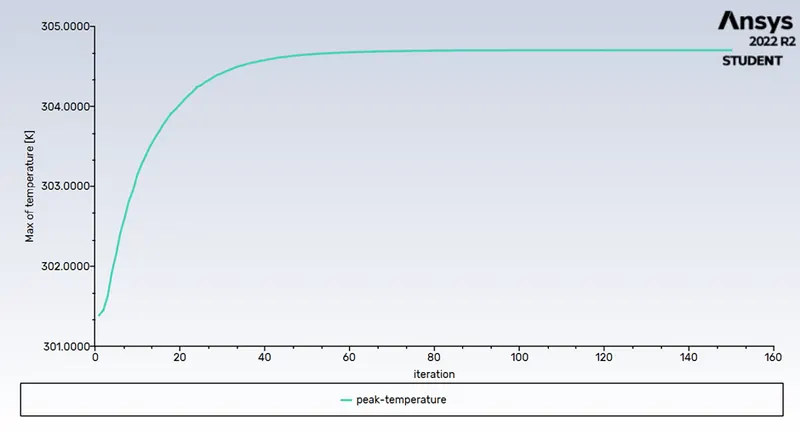
Fig 22. Peak temperature at processor at velocity 5m/s
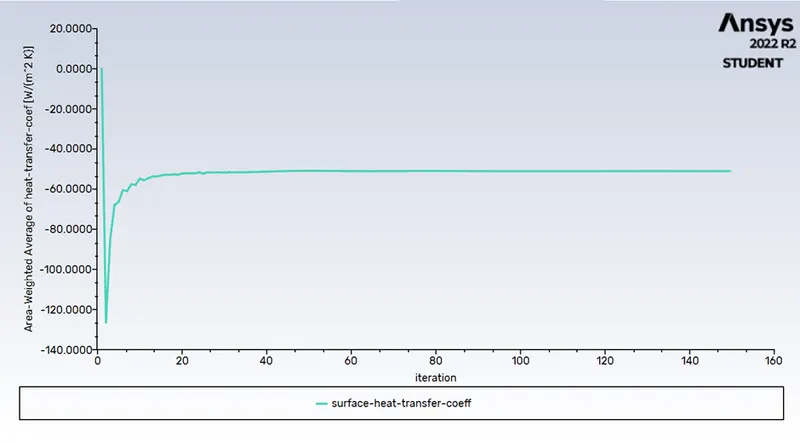
Fig 23. Surface heat transfer coeff at velocity 5m/s
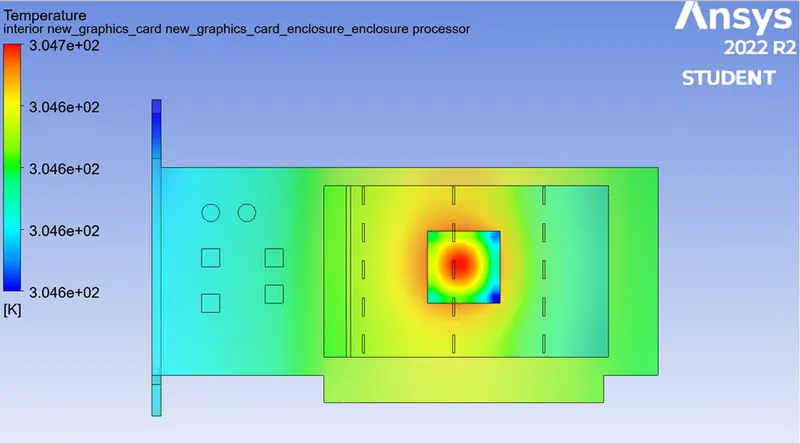
Fig 24. Temperature hotspot on graphic card at velocity 5m/s
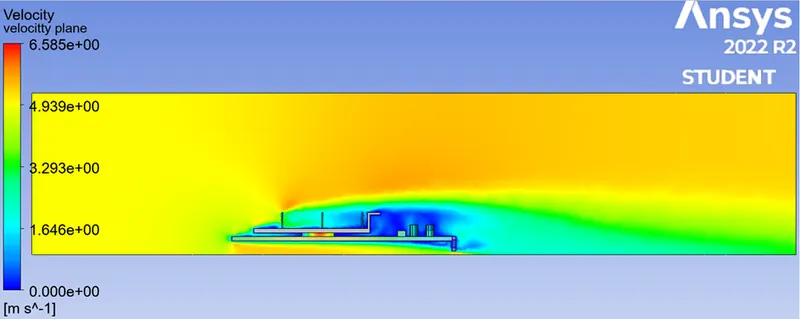
Fig 25. Flow velocity of velocity 5m/s
Results :
These are the Peak temperature which we get after simulations :
1. At 2 m/s velocity at processor 308.66839k
2. At 3 m/s velocity at processor 306.58713k
3. At 5 m/s velocity at processor 304.7033k
In above variations we can see the falling of temperature as we increase the velocity.
Conclusion :
- In above simulation we first conclude that the hotspot mostly occurs near the processor, more close the processor hotpots created there.
- Next we can conclude that as we increase the velocity the temperature gradually increases .
- Hence we can say the higher velocity provides better colling to graphic card.