Week-6 Calculate the Stretch Ratio by comparing the ELFORM (-2,-1,1,2) with Ogden_Material Model.
TITLE: CALCULATE THE STRETCH RATIO BY COMPARING ELFORM(-2,-1,1,2) WITH OGDEN MATERIAL MODEL.
OBJECTIVE: TO PERFORM A TENSILE TEST ON A CUBE MODEL(10mm X 10mm X10mm) AND COMPARE THE STRETCH RATIO FOR DIFFERENT ELFORM.
PROCEDURE:
- Creating mesh model.
- Defining the boundary conditions.
- Defining the section and material.
- Defining the control cards.
- Defining the database cards.
Creating the mesh model.
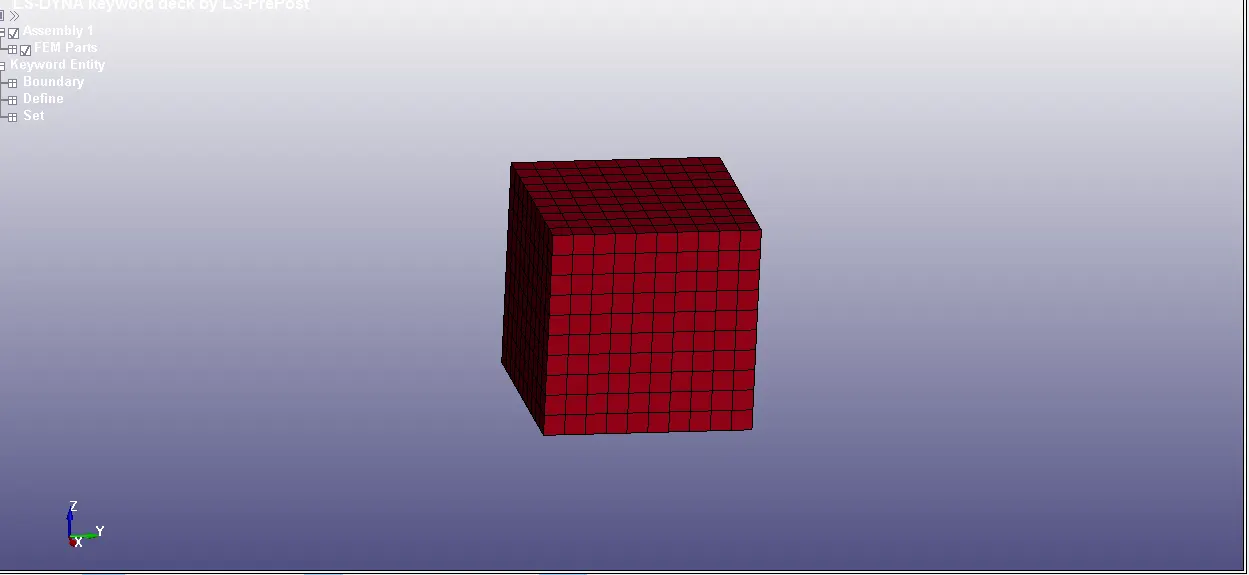
Model of 10 x10 x10 (mm) is created used mesh option.
ASSIGNING THE SECTION AND MATERIALS.
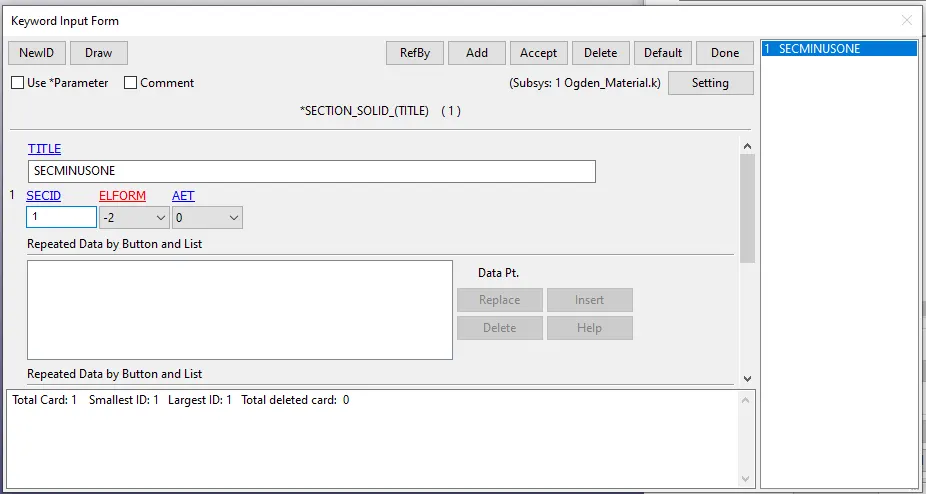
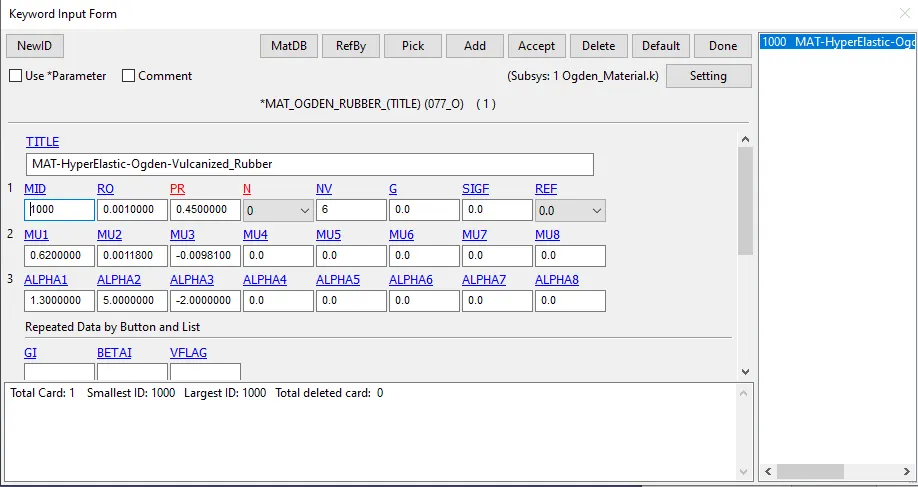
- Here solid section card is used and ogden rubber is used as material.
DEFINING BOUNDARY CONDITIONS.
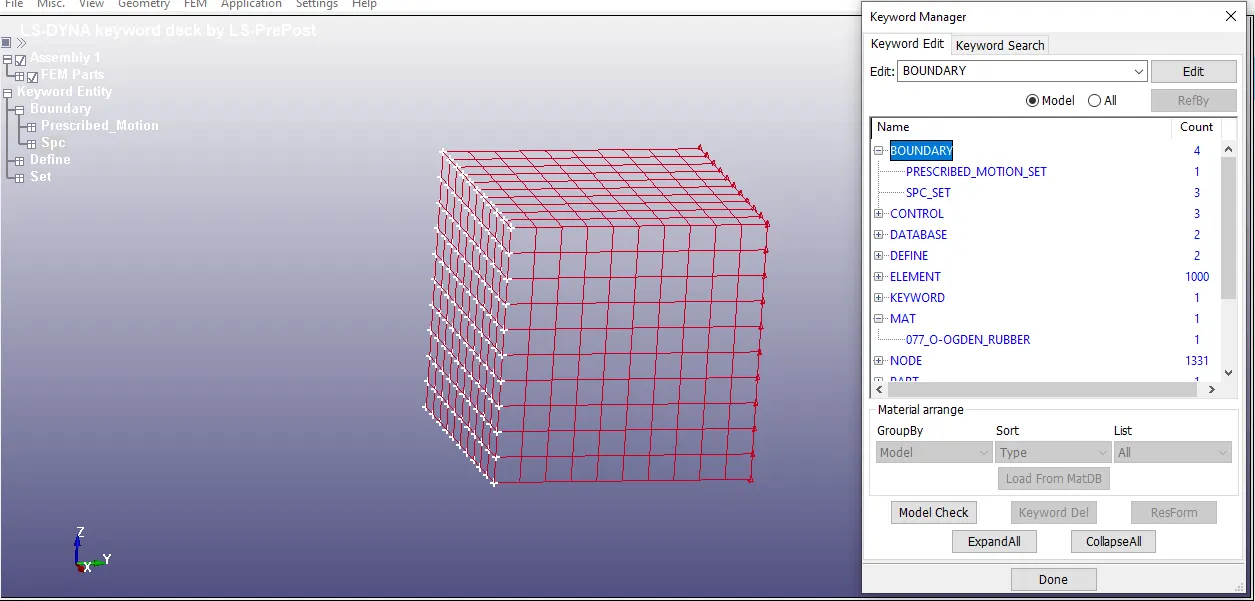
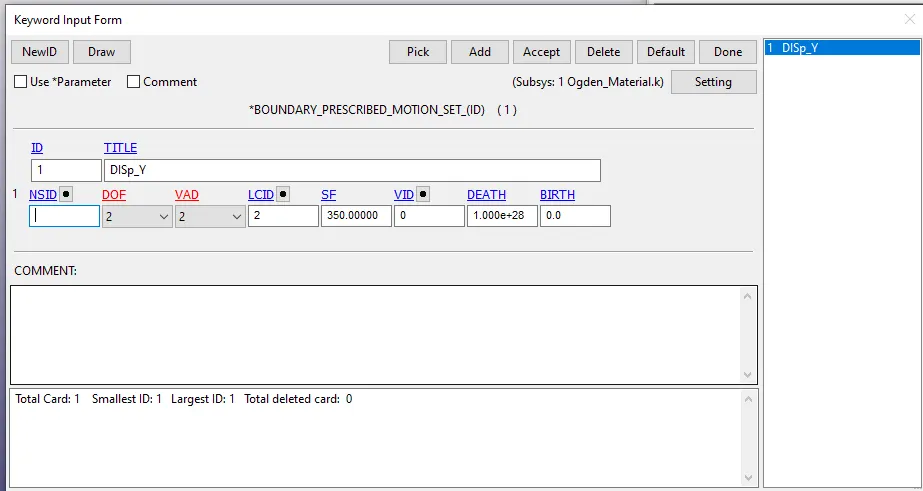
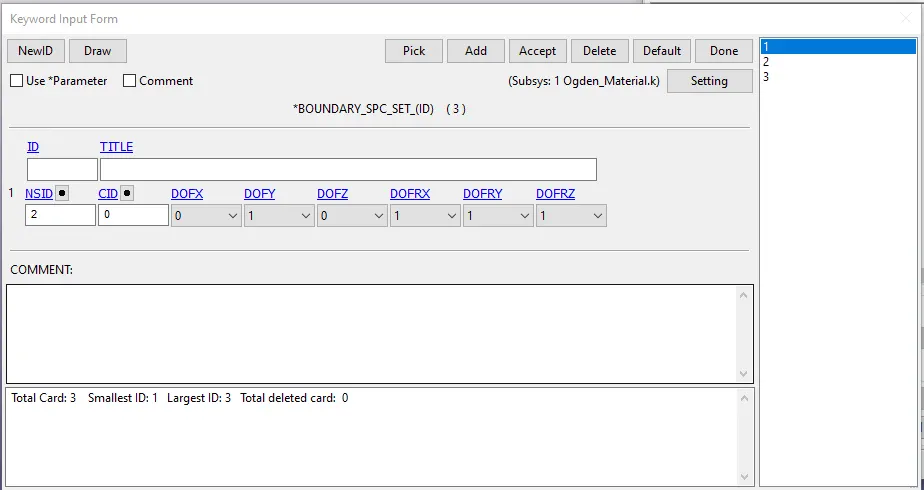
- SPC set is constrained by three sets,in 1st set of nodes only Y direstion is contrained,in horizontal set of nodes z is contrained and in vertical set of nodes X is constrained.These SPC are defined such that when tensile force acts on the nodes such that all the contraction and elongation happens.
- Displacement is given to the set of nodes in golbal Y direction sch that all the elements diaplaced towards Y direction.
CONTROL CARDS:
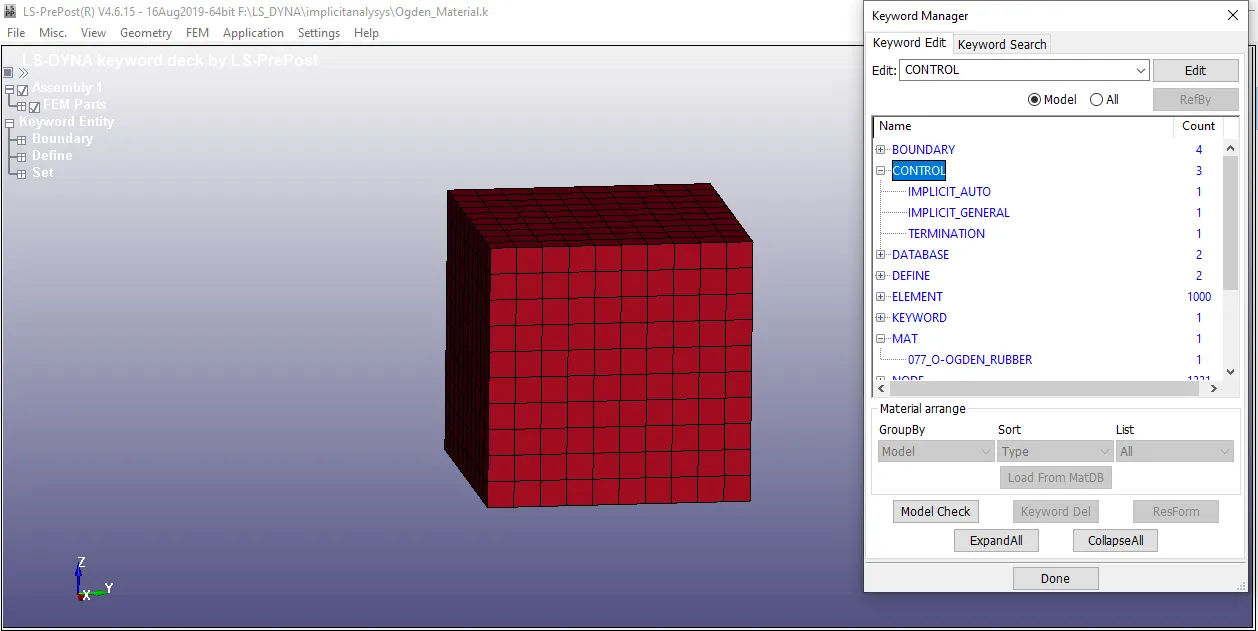
- Implicit general is used to run the simulation in implicit solver.
- Implicit auto is used for automatic time step control in solver.
- Termination card is used to define the end time.
DATABASE CARDS:
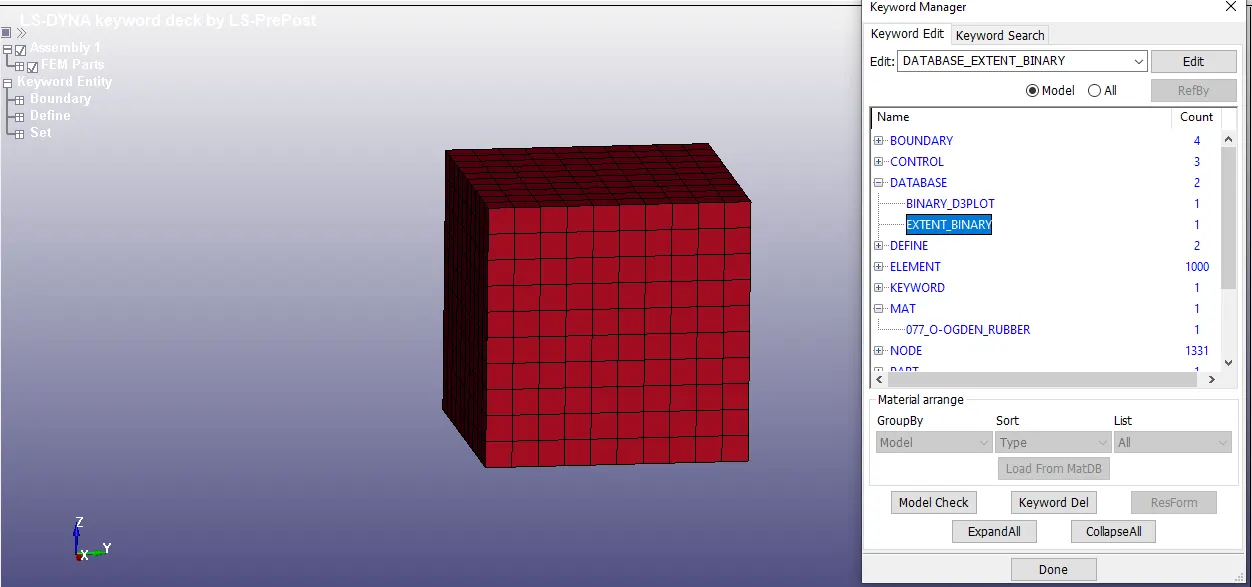
- Exent binary card is get the strain data from the simultion.
CALCULATIONS:
TRUE STRESS AND ENGINEERING STRESS
`sigmat=sigma(1+epsilon)`
`sigma=(sigmat)/(1+epsilon)`
TRUE STRAIN AND ENGINEERING STRAIN
`epsilont=ln(1+epsilon)`
`epsilon=e^(epsilont)-1`
STRETCH
`lambda=epsilon+1`
RESULTS:
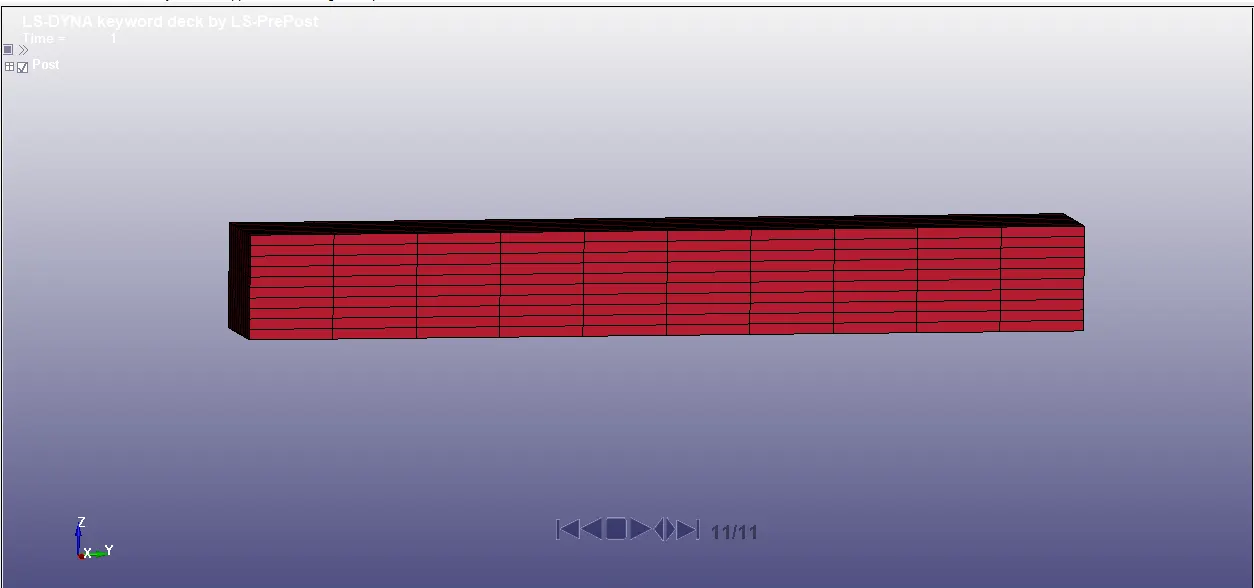
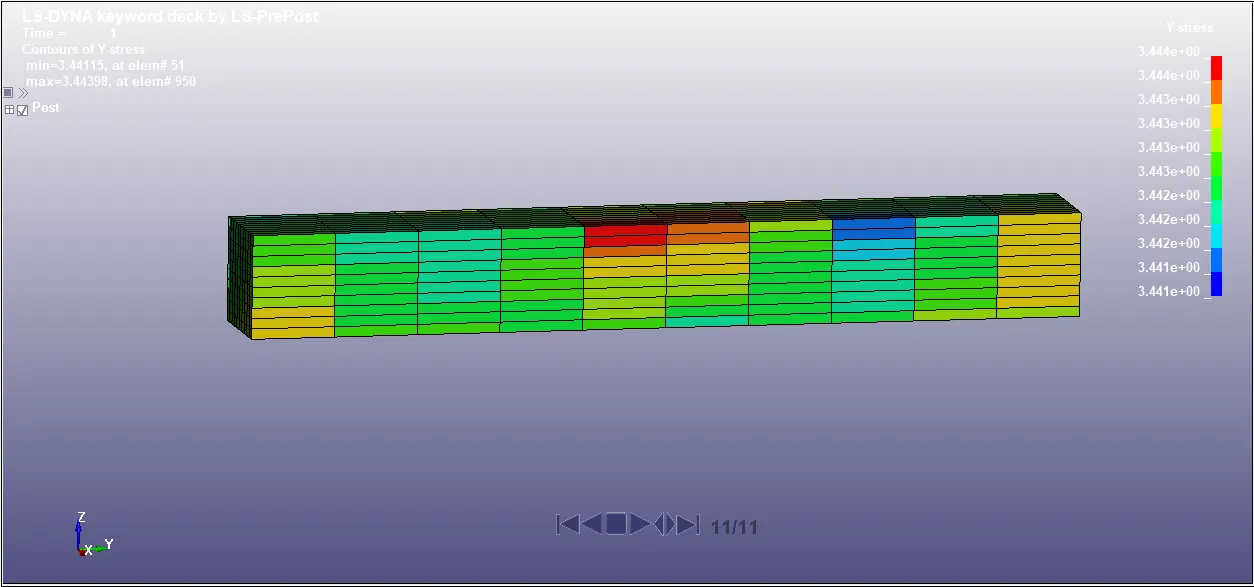
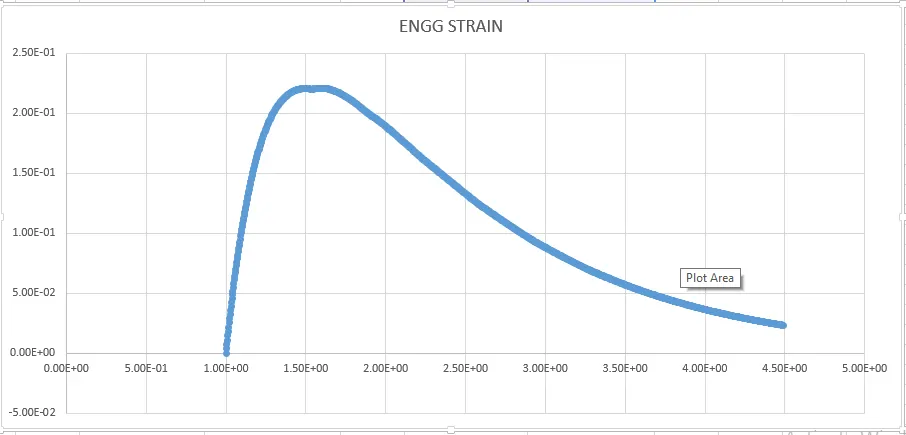
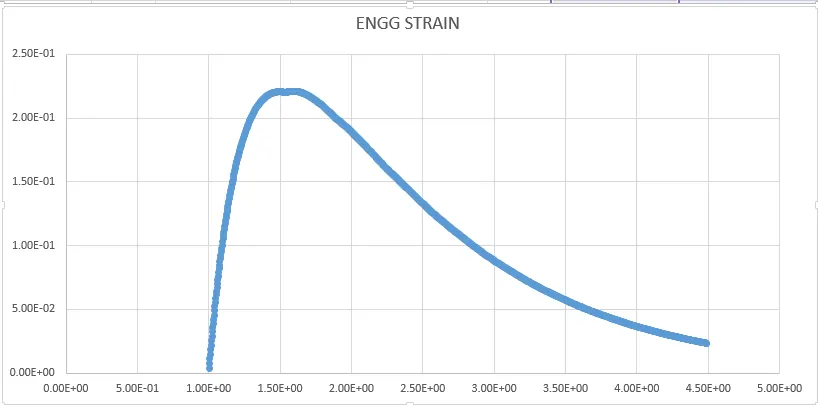
PLOTS:(X-STRETCH,Y-ENGG STRESS)
ELFORM (-2)
ELFORM(-1)
ELFORM(1)
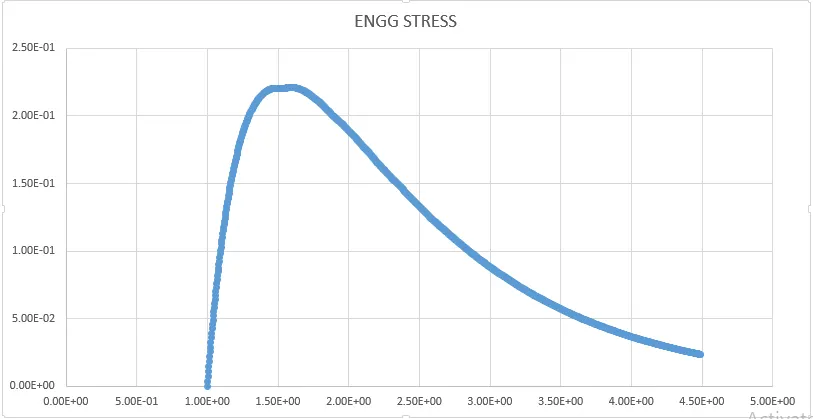
ELFORM(2)
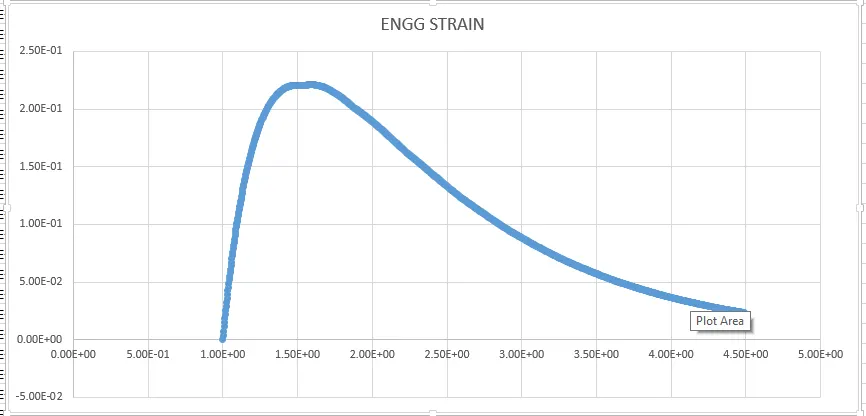
- This plots shows the behaviour of diffrent ELFORM.
- All the plots are more or less similar to eath other no such obsevations or difference can be seen.
CONCLUSION:
- tensile test is done on a cube block of ogden material model.
- implicit solver is used in order to achive more accurate results.
- Data obtained from Lsdyna are in true values of stress and strain therfore they are converted to engineering stress and strain.
- Stretch is obtained using engineering strain value and graph is plotted between stress and stretch.