Week-6 Calculate the Stretch Ratio by comparing the ELFORM (-2,-1,1,2) with Ogden_Material Model.
Calculate the Stretch ratio by Comparing the ELFORM (-2,-1,1,2) with Ogden Material Model,
Aim,
Create a solid mesh box of 10mmx10mmx10mm dimension with 10 elements for each direction and use the Ogden material card attached that represents the material properties and use approximate boundary conditions to simulate tensile behavior for the model and finally compare the results from your simulation to the plot given up to stretch ratio 5.
Objectives,
First, we need to make the solid box with mesh 10mmx10mmx10mm dimension then include the Ogden material and set different ELFORM (-2,-1,1,2) on the section then assign it to the part. then we need to take the stress and strain plot from Ls-Dyna and then we need to find out the stretch ratio and engineering strain by theoretical calculation. After that make the plot between the nominal stress and stretch ratio to compare it with the uniaxial plot given above.
Ls-Dyna gave true Stress and True Strain by the output. Then convert to the stretch ratio and nominal stress and plot them.
The stretch ratio is basically the ratio of the current length of the part and the original length of the part. And engineering stress is also called nominal stress which is basically considered the constant area of the cross-section. It's not considered the reduction area of the cross-section as the component is stretched. Hyperelastic material also the area of the cross-section reduce as we stretch it.
The procedure,
Model setup,
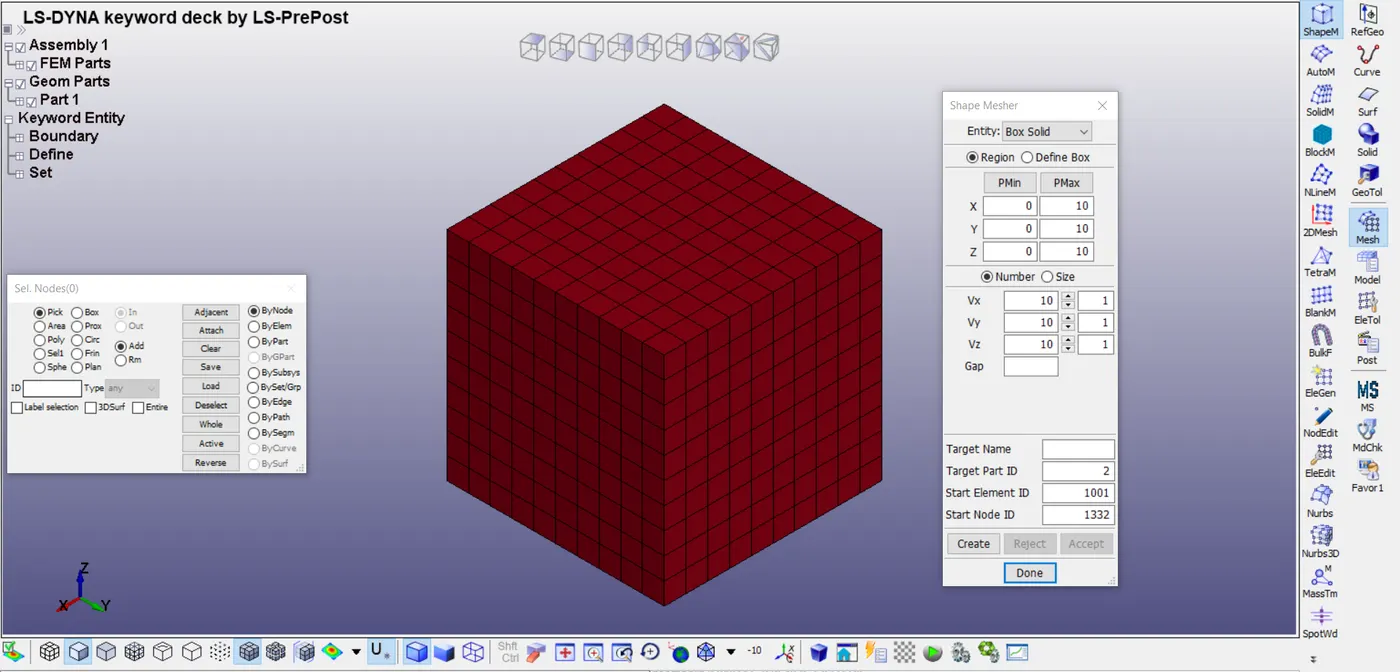
First, we need to make a solid box in Ls-Dyna.
Mesh>Shape Mesher>Entity(Box Solid)>Region>set the size as 10 in three directions and set step as 10(The cube is 10mm in X, Y, and Z and divided into 10 elements at each direction)>Create>accept.
Material Creation,
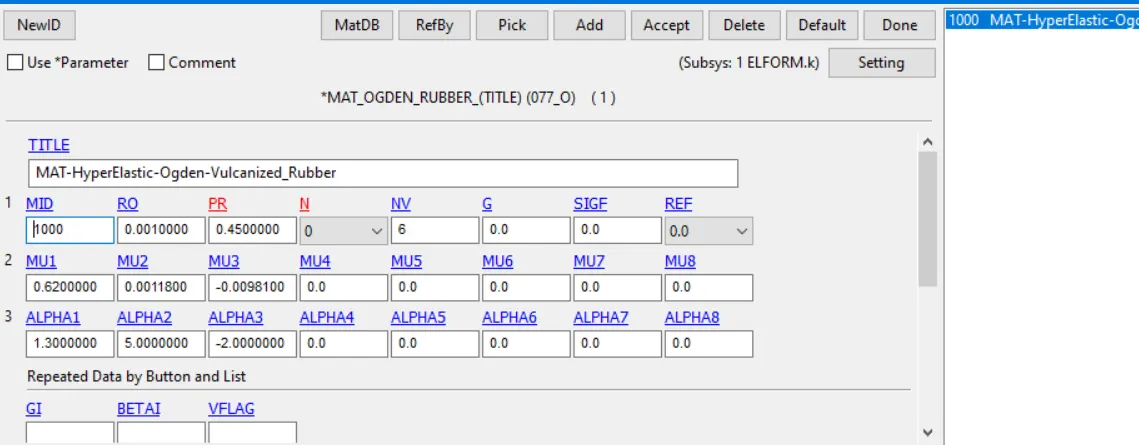
Material card MAT_OGDEN_RUBBER has to be created and the values have taken from the given the Ogden_Material.k file.
Section Creation,
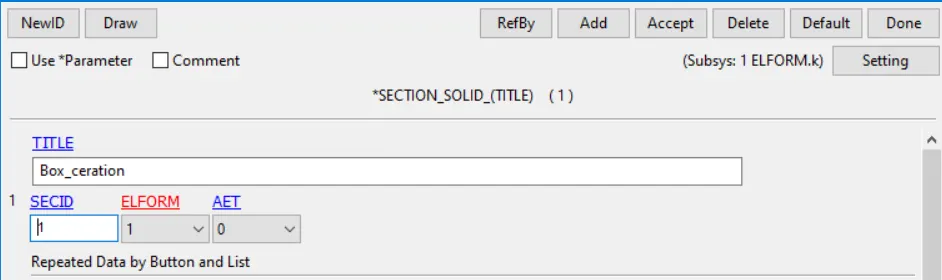
The solid section has to be created with different ELFORM (-1,-2,1,2) first starting with ELFORM = 1.
ELFORM=-2 (fully integrated s/r solid intended for elements with poor aspect ratio, accurate formulation)
ELFORM=-1 (fully integrated s/r solid intended for elements with poor aspect ratio formulation)
ELFORM=1 (Constant stress solid element)
ELFORM=2 (fully integrated s/r solid)
Part Section,
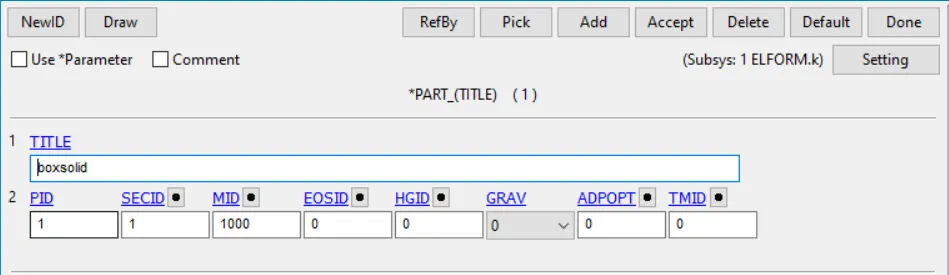
Then, the part card has to be created and assigned the material card and section card their respective SECID and MID.
Boundary Section,
To simulate the tensile test here we need to apply the boundary condition on the cube. Consider the compression in the lateral direction of the material when one direction is pulled by a force.
We are creating two node sets in which one is formed with the middle nodes in the vertical direction and another one is formed with middle nodes along the horizontal direction. Then, we need to restrict those nodes along its orthogonal direction only SPC card. This will restrict those nodes in the two directions and all nodes constraining face is again selected as another node-set and set SPC in X-direction.
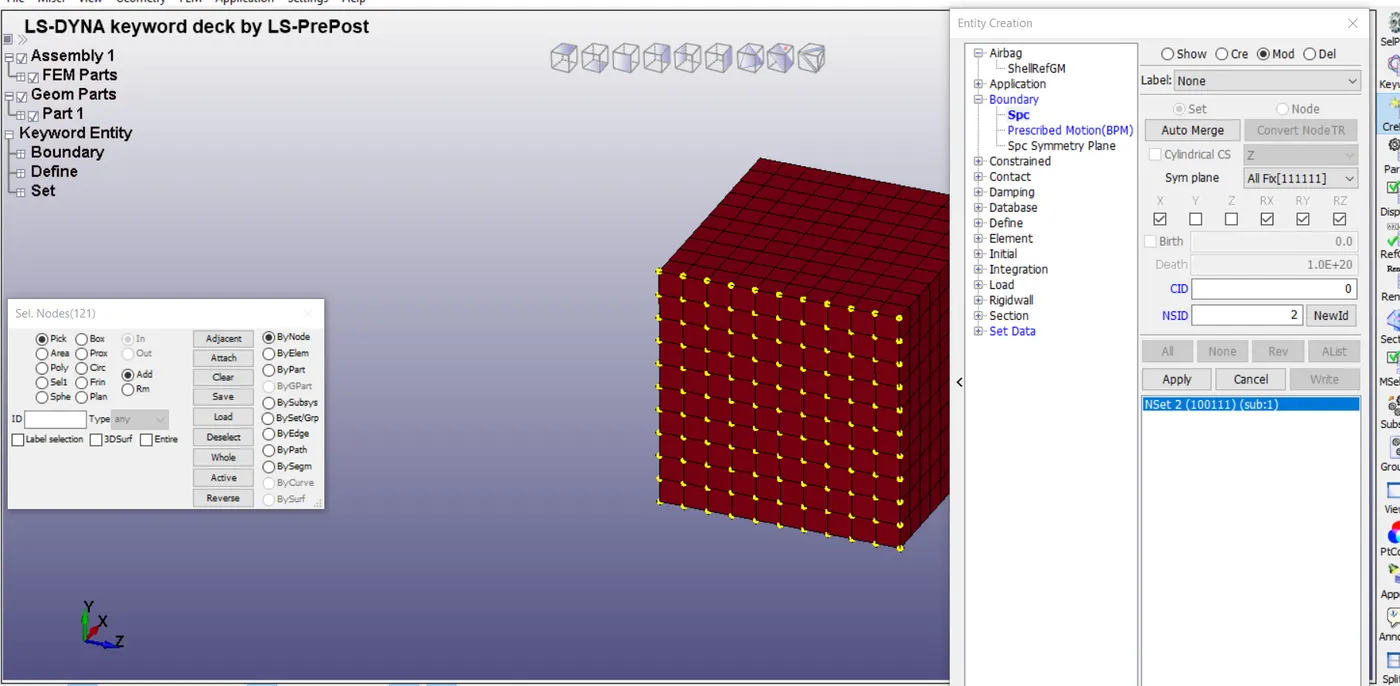
Arrested all nodes in X-direction,
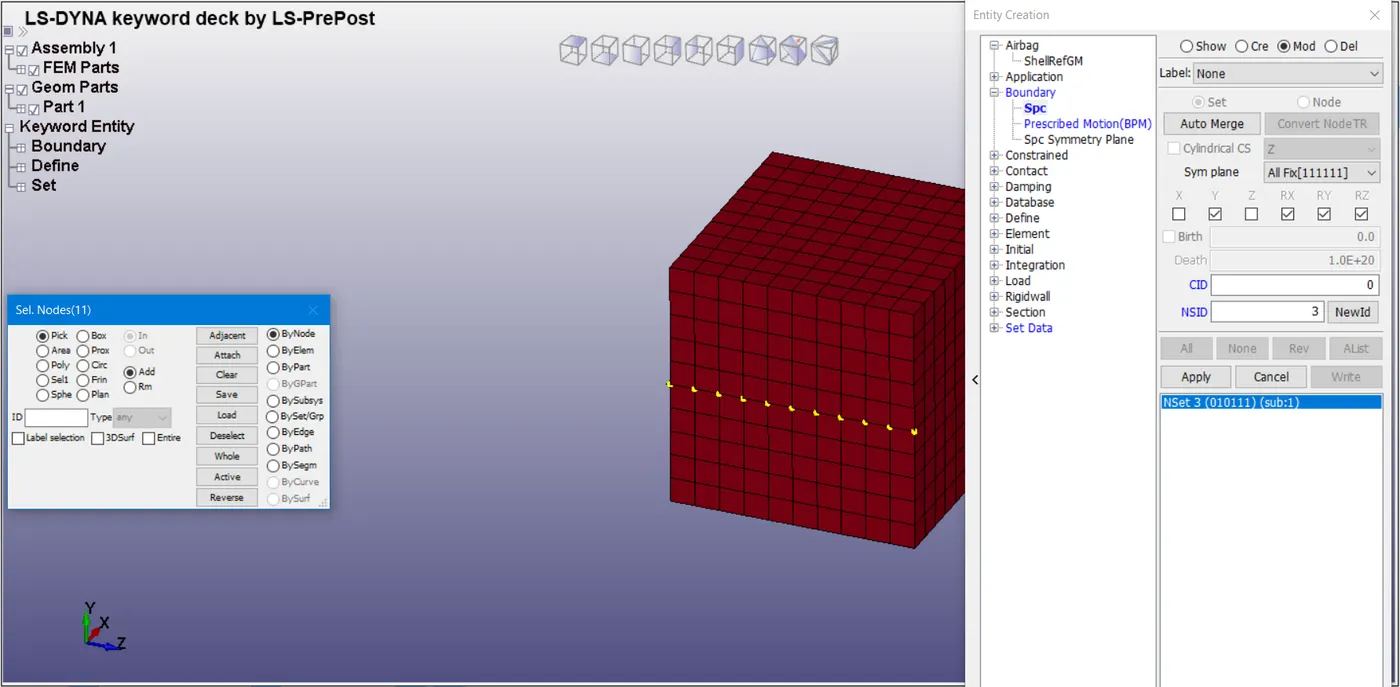
Arrested center horizontal line nodes in Y-direction,
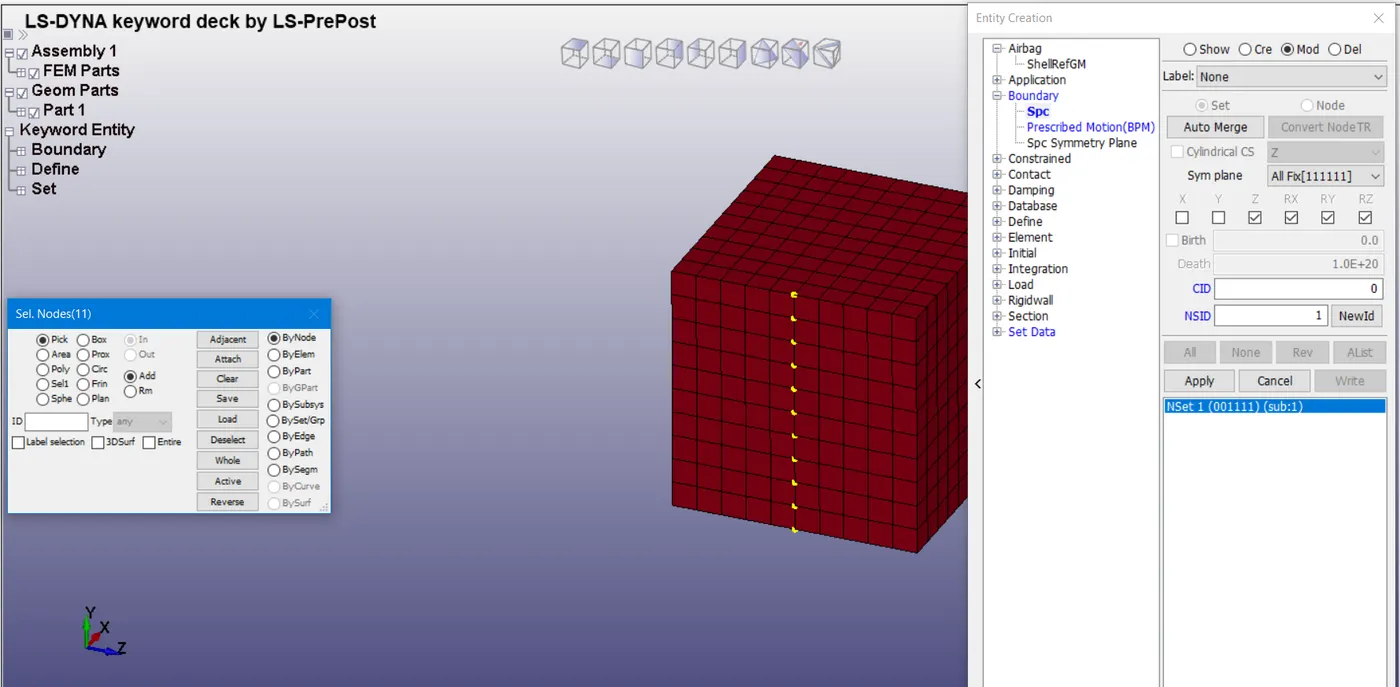
Arrested center vertical line nodes in Z-direction.
Prescribed Motion,
This model material is Ogden which is a hyperelastic material, it undergoes the non-linear deformation. The implicit methods are used when the effects of strain rates are very minimal. In the implicit method, the displacement loading is recommended rather than the force load to archive a more stable load
The prescribed motion has to be defined to give a displacement by assigning a curve. The box is subjected to tension at X- direction and the plot figured up to stretch ratio 5 in all cases.
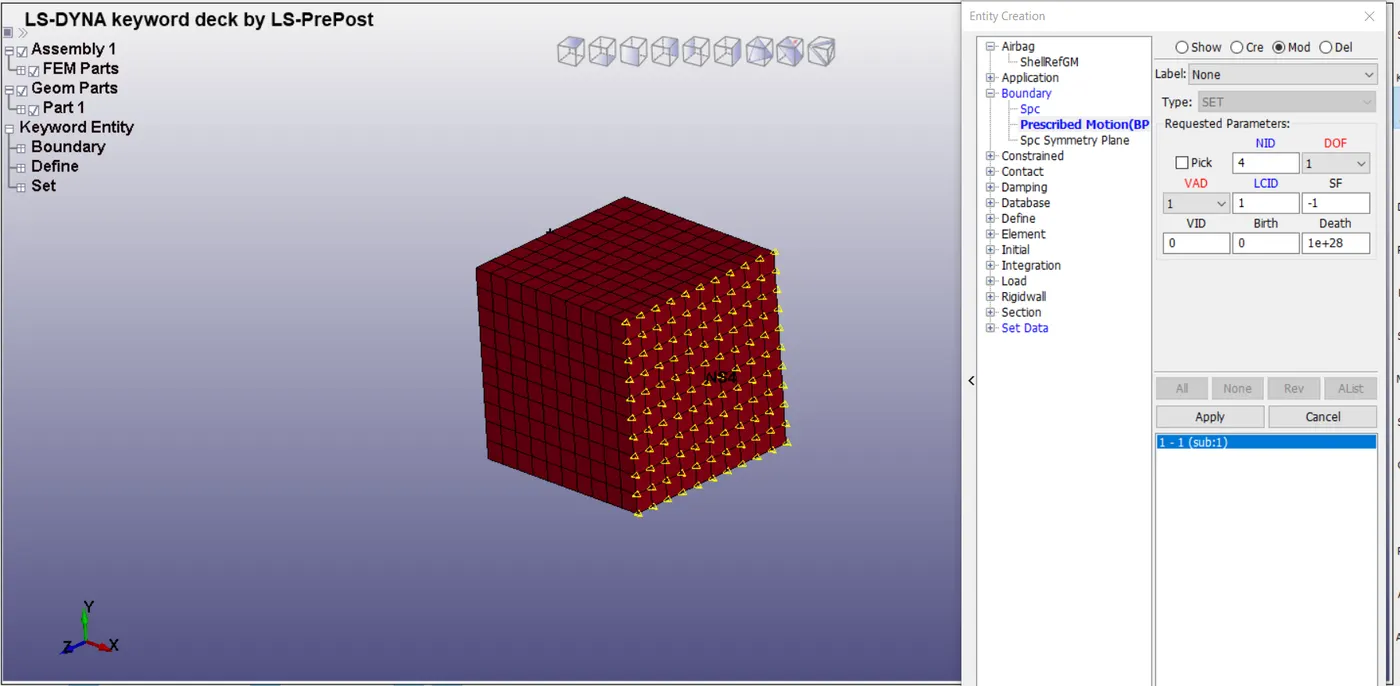
Implicit Creation,
*CONTROL_IMPLICIT_GENERAL this keyword makes it sure in an implicit manner since the default analysis mode for Ld-Dyna is explicit. Activate the implicit analysis to set the IMFLAG=1. And DTO=0.1 is the initial time step. If the timestep is large compared to the non-linearity of the problem will terminate. To adapt timestep to the complexity use this card.
*CONTROL_IMPLICIT_CARD this keyword makes adjust the time step based on convergence rate, not an accuracy. Here, IAUTO is set 1 (Automatically time step adjacent), ITEOPT optimizes the operation count step, ITEWIN is the iteration window, DTMIN is DT/1000 and DTMAX is DT*10.
*CONTROL_IMPLICIT_SOLUTION This keyword is used to choose between the linear and non-linear analysis in the implicit method. NSOLVR is set 12 by default and LSMTD set to default 4.
*CONTROL_IMPLICIT_SOLVER this keyword helpful to stiffness matrix inversion. LSOLVR is set the default for single precision and set 5 for double precision for the better result though in the complex implicit analysis.
*CONTROL_TERMINATION this keyword set the termination to 10ms.
Then model checker used to check the model ensure the deck is free of error. Then opened the Ls-Dyna program manager and give the memory 1000M. If enough memory is not available, then the program will run in out of core will slow down the run. And the set number of CPU as 2 it will set the solver solves the problem using a double-precision solver.
Result,
True stress and strain curves were plotted (History>Element>Select ana element>select the X axis>Plot) and saved it. Similarly to extract the strain values in use Lower IP strain (History>Element>Select an element>select the lower IP strain in X>plot) and saved it.
Then we open that file in notepad++, you can see the ordinate and absicca value of the plot. Copy and paste these values into the Microsoft excel using the equation in excel find out the Engineering stress and strain and also find out the stretch value. Then we can be using the plot option in excel we can plot the graph between the nominal stress vs stretch ratio.
The formula used for the calculation,
1. Find the engineering strain, ℇe = {EXP (ℇt)-1} --------(1)
2. Find the Stretch, λ= 1+ℇe ----------(2)
3. Find the engineering stress, σe = σt / λ ------------(3)
This way used to calculate for all the ELFORM (-2,-1,2,1) and Plotted as a graph fro engineering stress vs Stretch.
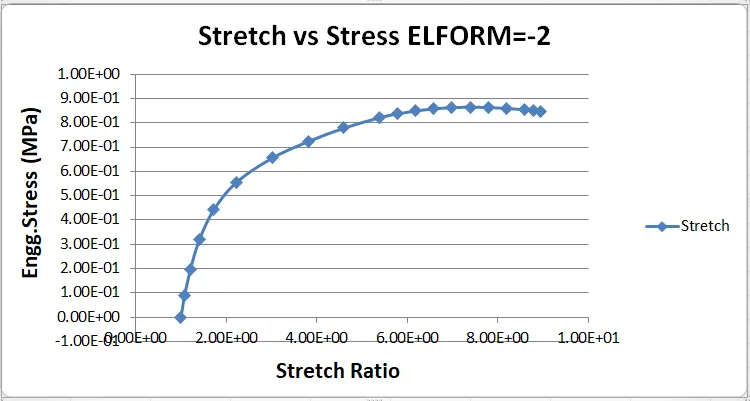
ELFORM = -2,
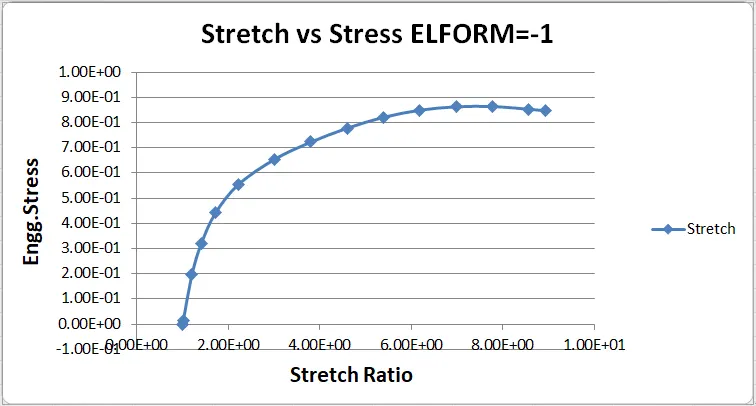
ELFORM = -1,
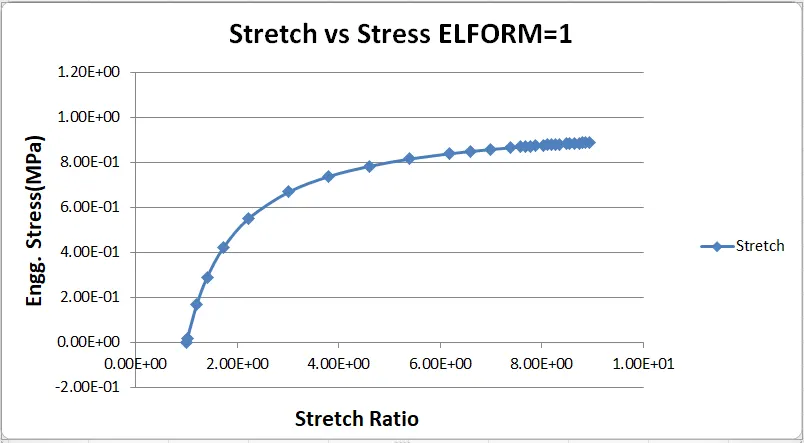
ELFORM = 1,
ELFORM = 2,
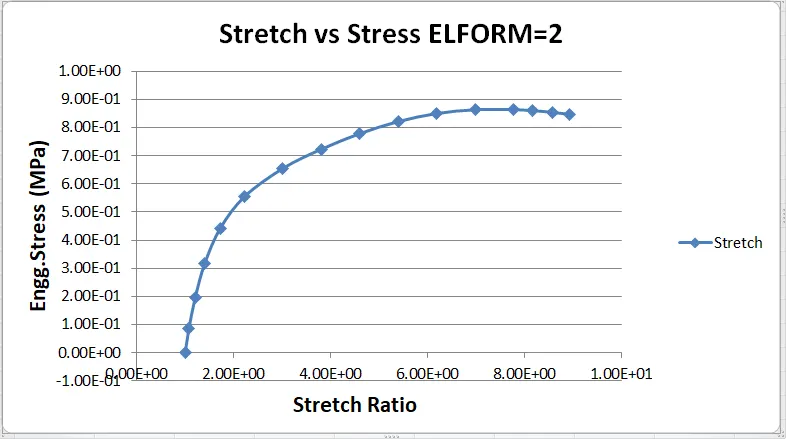
Stress is reaching 0.8040 MPa at a stretch ratio 5 from the graph its engineering stress value decreasing while the stretch ratio increasing. All the graph we obtained by changing the ELFORM(-1,-2,1,2) but Stress values shows 0.804MPa only Grapg we got here for different ELFORM values are nearly the same. There, Different ELFORM serves a different purpose. Each one uses to different for example ELFORM -1 and -2 fully integrated elform for an element with poor ratio. and ELFORM 2 is having the shear locking issue though its fully integrated. The solid element formulation -1 and -2 have the good improved behavior over formulation 2 by accounting the poor element aspect ratios in a manner so reduce the shear locking effects seen in formulation 2. So the problem isn't a complex at every element formulation succeed in giving almost the same results but diff elform will be visible.
Conclusion;
All the graphs are similar but it's performing at the uniaxial test with hyperelastic material and we obtained the graph from different ELFORM values isn't matching all the values. But the graph nearly matches to value of 2.