Calculate the Stretch Ratio by comparing the ELFORM (-2,-1,1,2) with Ogden_Material Model.
Aim
Create a solid meshed box with 10 x 10 x 10 mm dimensions and apply it with the ogden material model and do a tensile test on the same .
Objective
First we need to make the solid element meshed box with the 10mm x 10mm x 10mm dimension.Then we need to include the ogden material model in it and assign that to the part. Then we need to set up the deck for a tensile test on it.We need to set differant ELFORM on the section Solid card ranging from -2,-1,1,2.Then for each cae we need to make the stress vs strain plot from ls dyna and then we need to find out the stretch ratio and engineering strain by the theoritical calculations.Thn we need to make the plot between the nominal stress and strtch ratio to compare it with the uniaxial test plot given above.
Ls dyna will gave us the true stress and true strain as the output .We need to convert that to stretch ratio and nominal stress and we need to plot them.
Stretch ratio is basically the ratio of the current length of the part and the orginal length of the part.Then the engineering stress is also called nominal stress which basically consider the constant area of cross section.This will not consider the reduction of cross section as the component is stretched.Here in hyperelastic material also the area of cross section reduces as we stretches it.But unlike the other ductile materials ,here the lateral strain is so huge as its poisson ratio is nearly 0.5. So this lateral strain will not be considered in engineering strain or engineering stress.
Stetch ratio = Current length /orginal length = (L+ dL)/L
this quantity is basically 1 + Engineeing strain.
As the enginering strain = dL/L
So stretch ratio will always will be greatr than unity.
True strain = ln(1 + engineering strain )
So 1 + engineering strain = e^ True strain = Stretch ratio
True stress = engineering stress ( 1 + engineering strain )
So nominal stress = True stress /stretch ratio
CASE SETUP
First we need to model a meshed solid box in ls dyna .for that we can make use of mesh > Shape Mesher > Set the radio button in size > set the size as 10 in three direction and set the step as 10 >create > accept.this will gave us the required model with the 10 solid elements along the lengths.This is then applied with the ogden material card.We need to include the material keyword file using * INCLUDE card browse for the file of material keyword file and click insert and done.
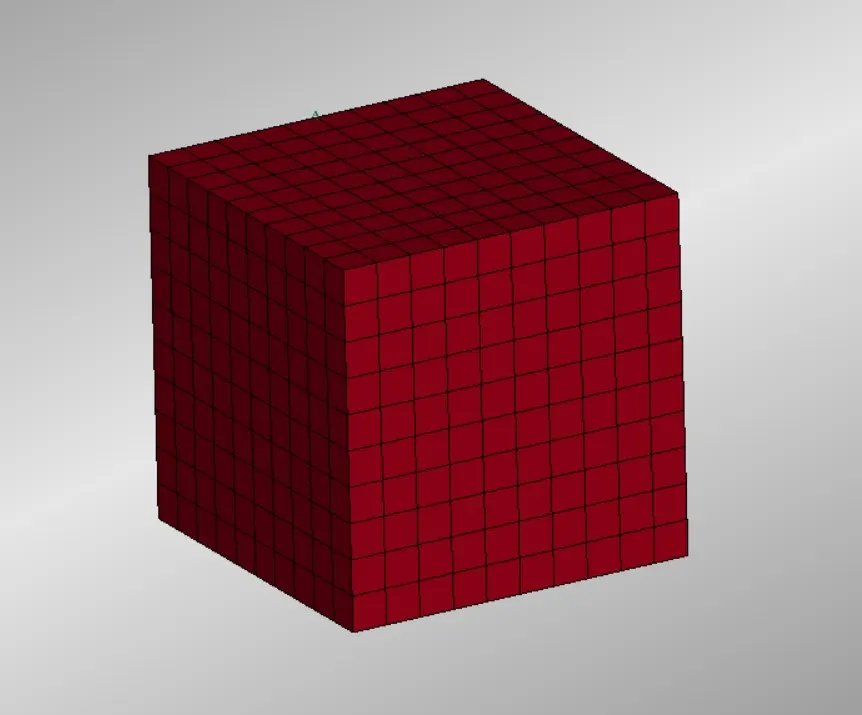
Fig 1 Solid Meshed Box
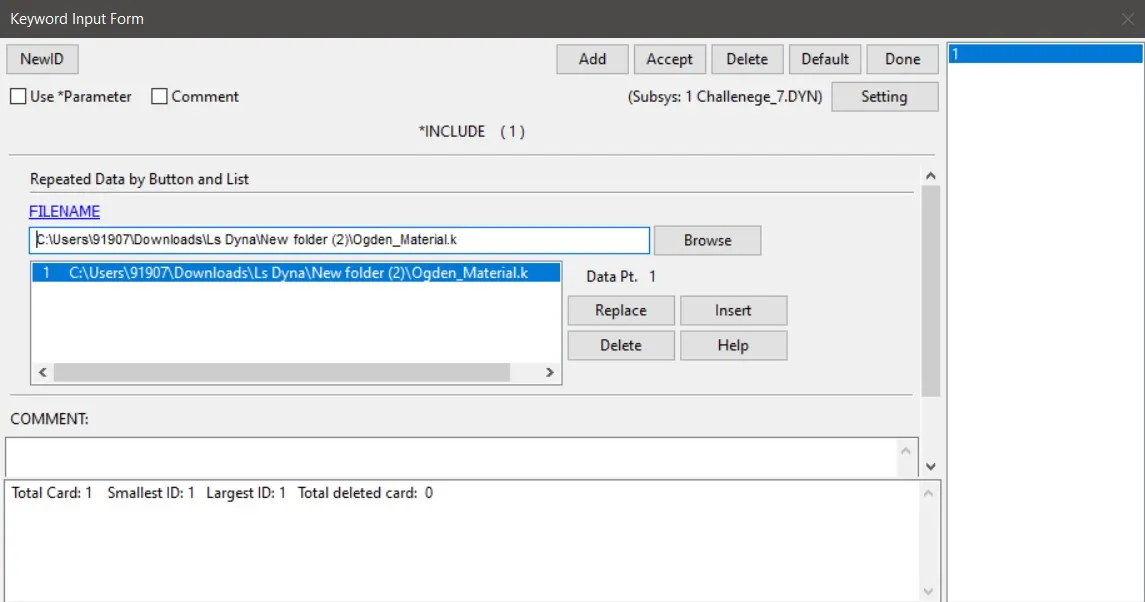
Fig 2 Include card
At first we need to create a section_Solid card with the ELFORM set up as 1 .This is for the first case .Then we need to assign the material and section to the part using the part card.
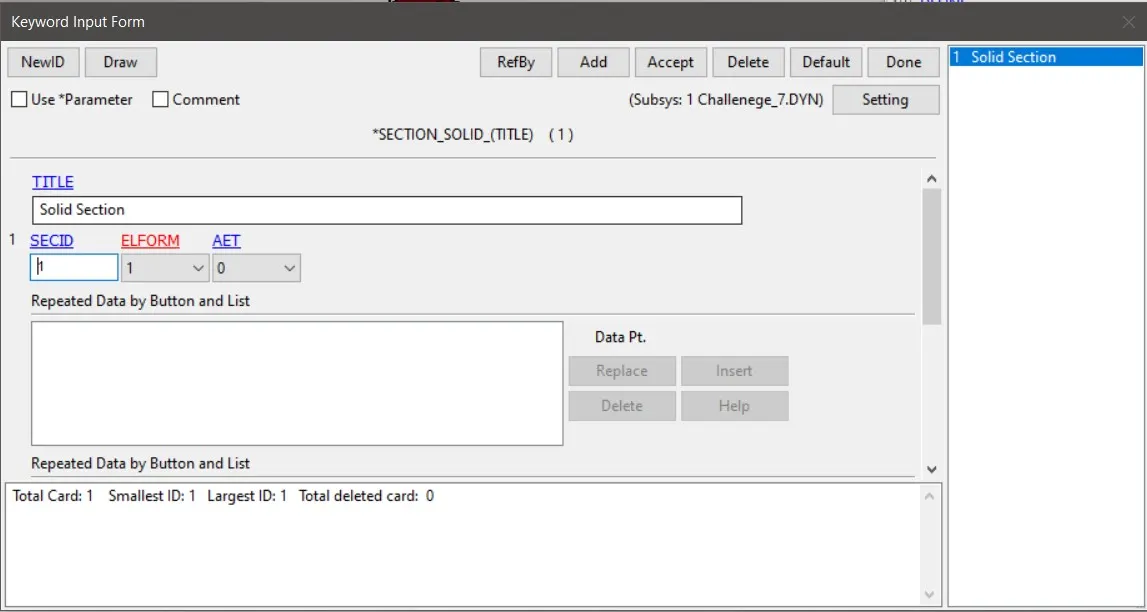
Fig 3 SECTION_SOLID CARD
To simulate the real tensile test here we need to aplly the boundary conditions on the cube.here we need to consider the compression in other lateral directions of the material when one direction is pulled by a force.This we know by the generalized hooke's Law.
So here we are applying the boundary constraint in such a way that the middle nodes along the vertical and horizontal direction will be constrained in its orthogonal directions.For this we are creating twio node sets in which one is formed with the middle nodes in vertical direction and the other one is formed with the middle nodes along the horizonrtal direction.Then we need to restrict those nodes along its orthogonal direction only using SPC card.this will restrict those nodes in the two directions and then all the nodes in the constraining face is again selected as another node set and set spc in Y direction , so that the nodes will be rstricted in y direction.Which means the nodes on the constraining face is restricted its degree of freedom in all the directions.
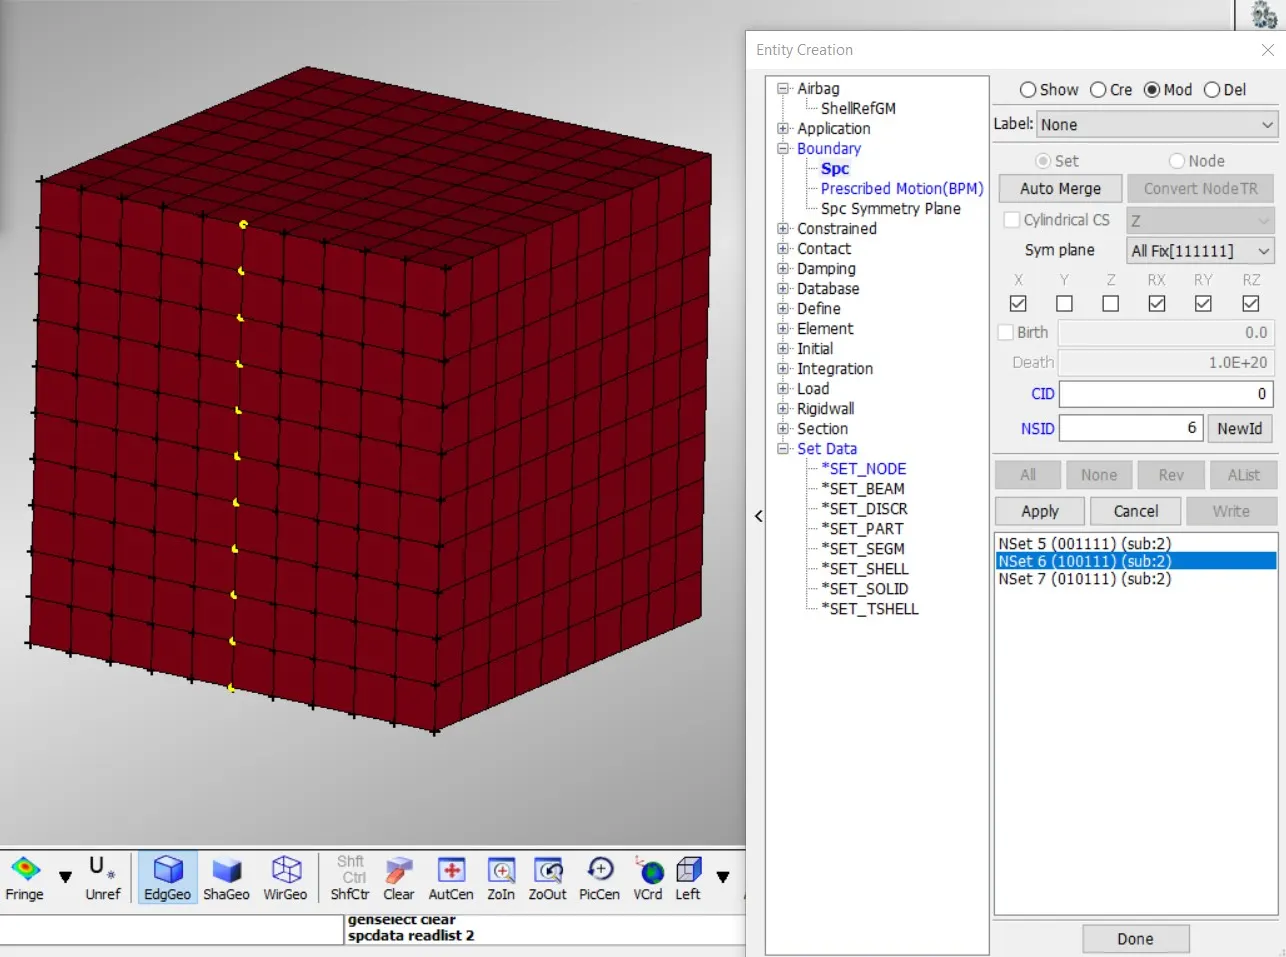
Fig 1.4 Node Set arrested in x direction
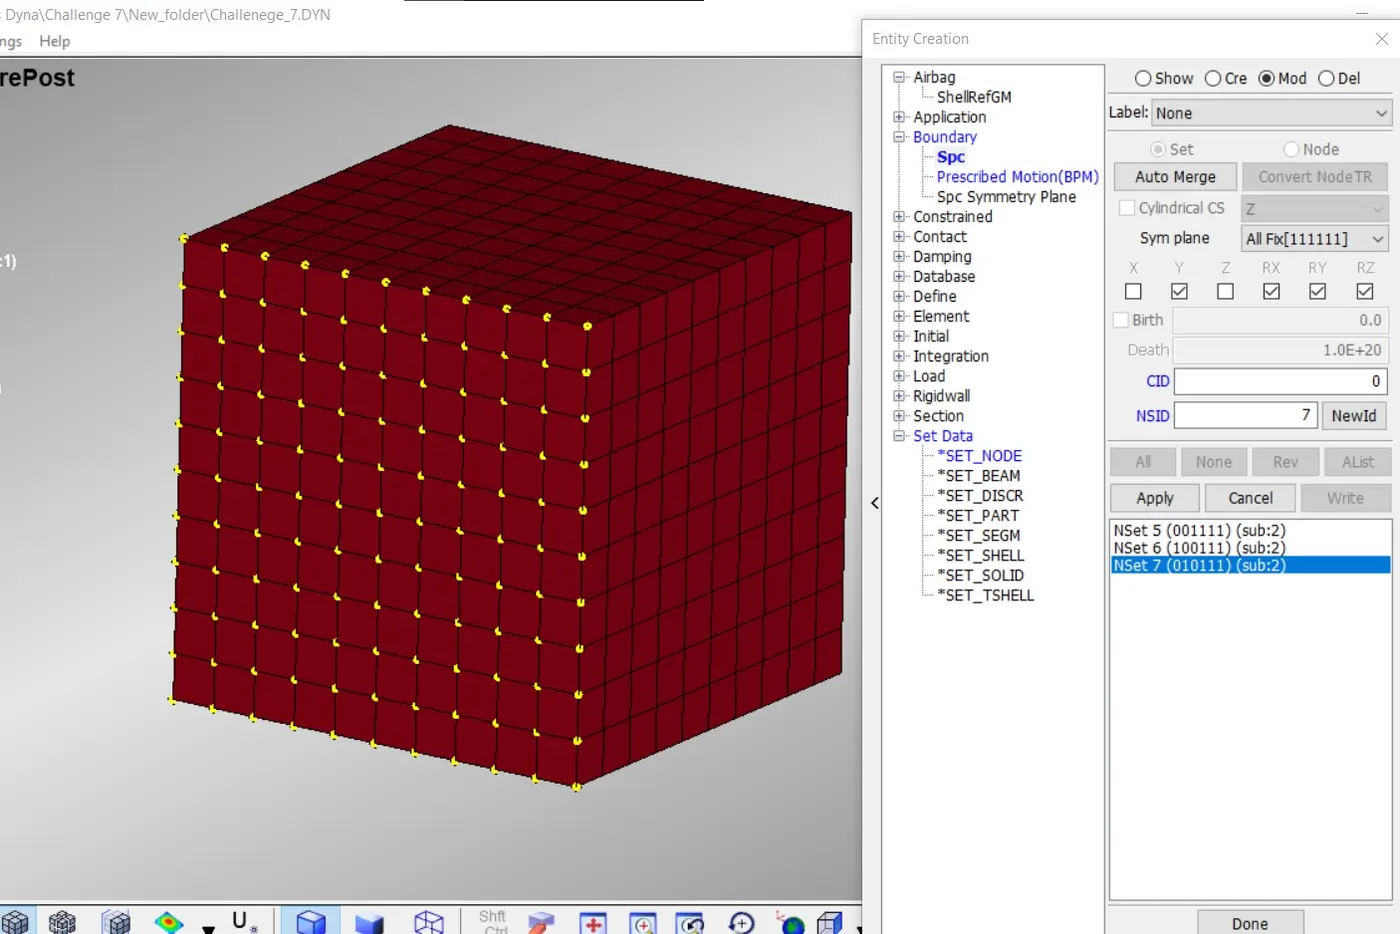
Fig 1.5 constrained face all nodes arrested in Y direction
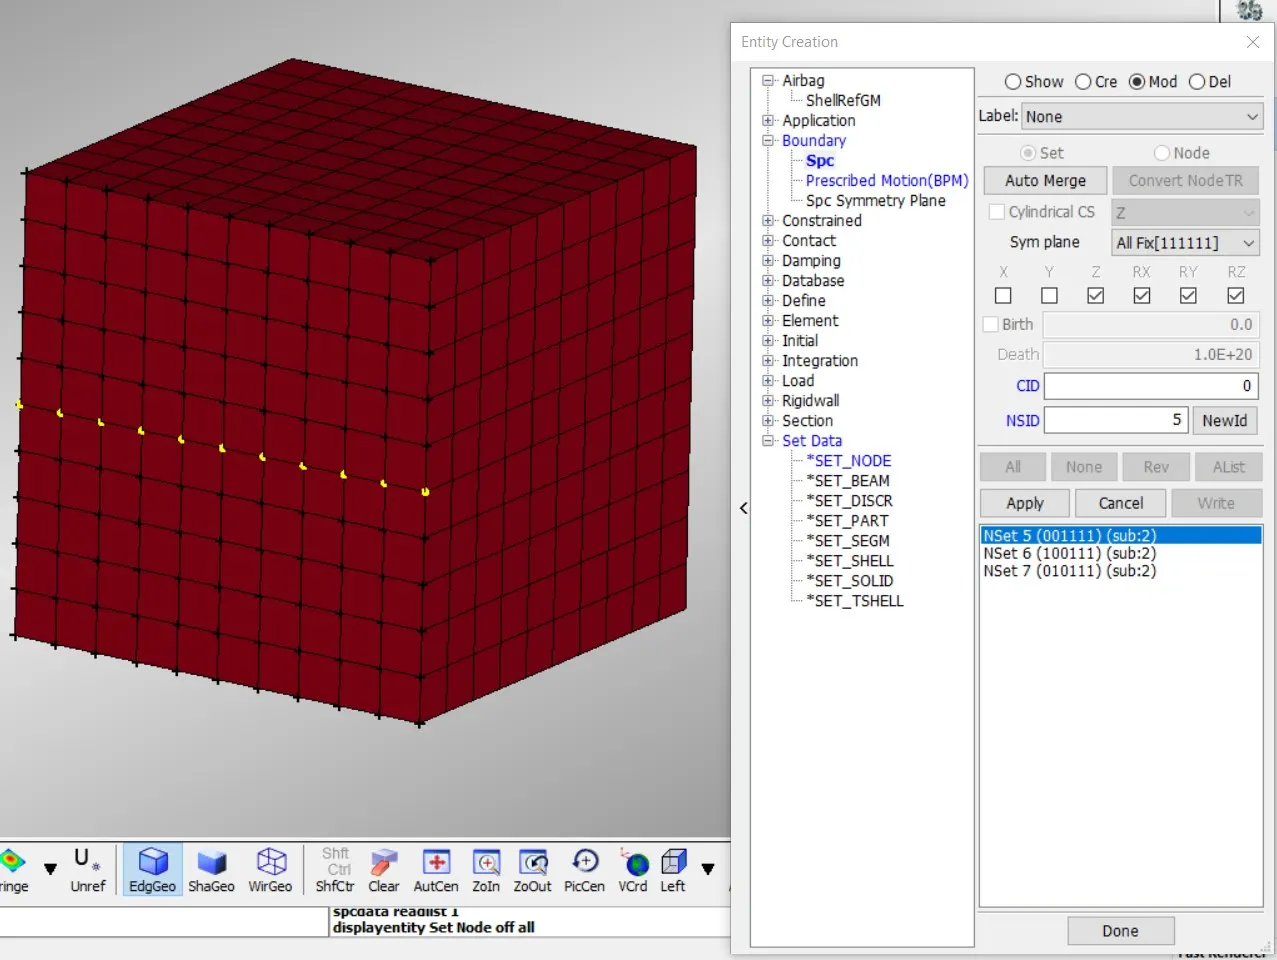
Fig 1.6 Middle horizontal nodes arrested in Z direction
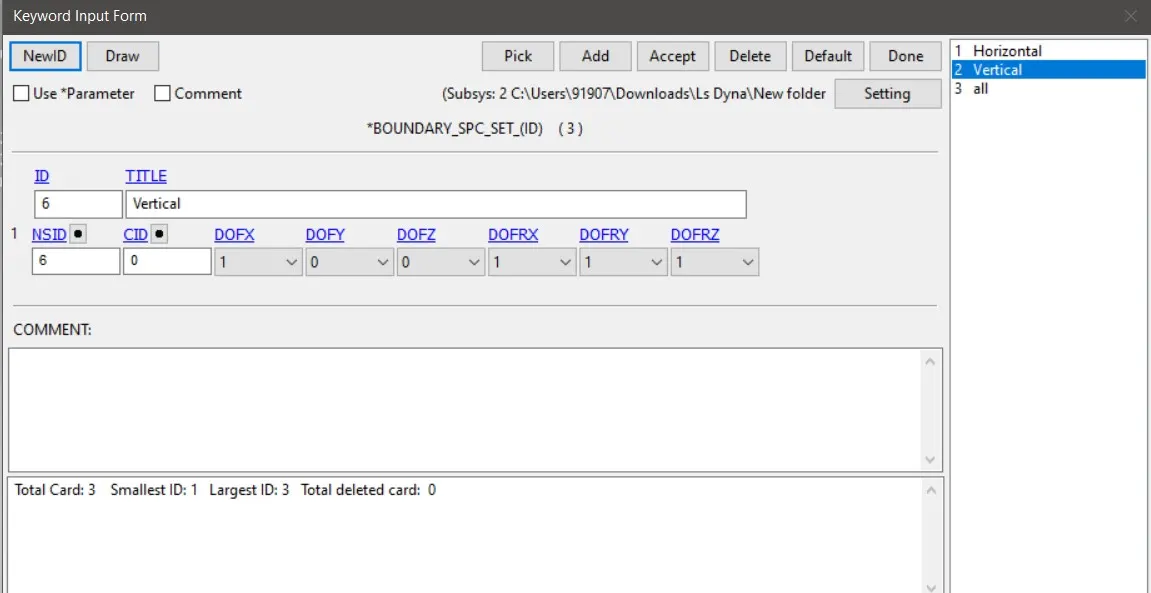
Fig 1.7 SPC Card in which the degree of freedom in X direction is arrested
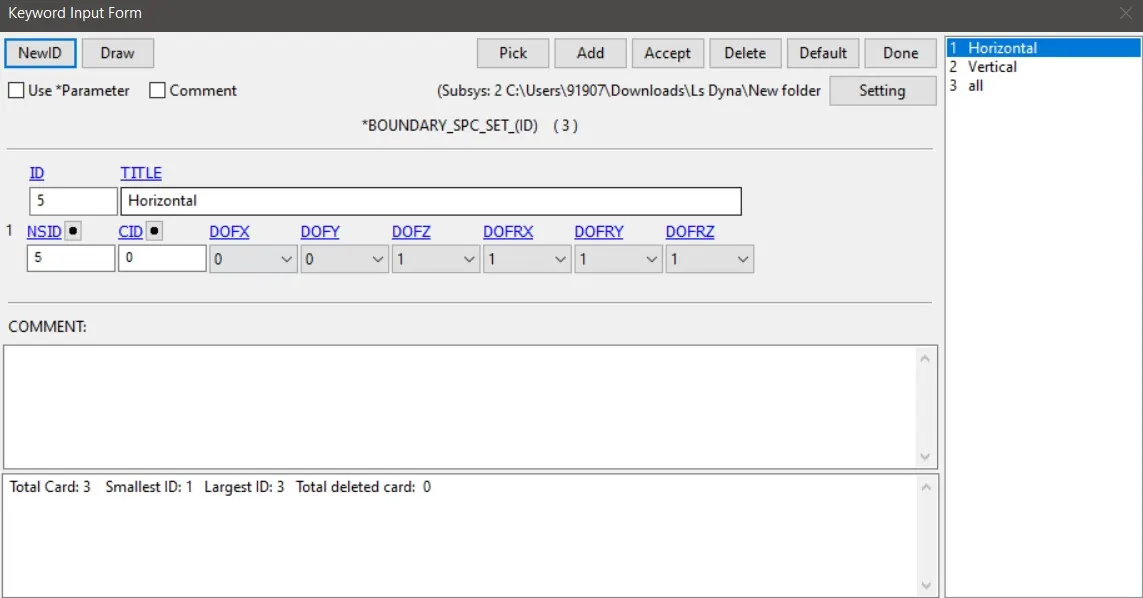
Fig 1.8 SPC Card in which the degree of freedom in Z direction is arrested
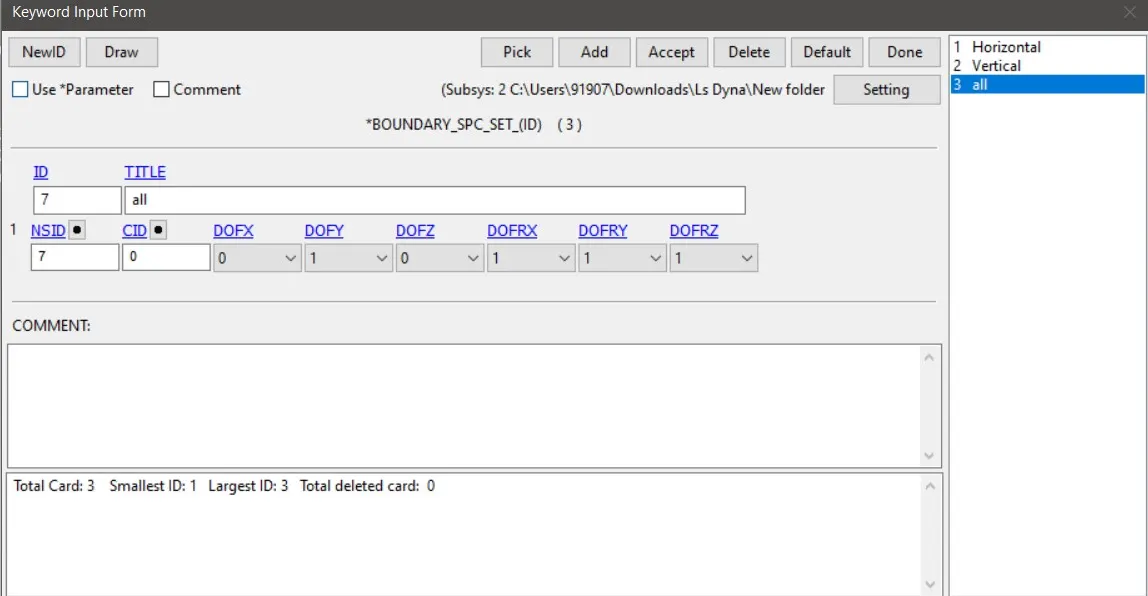
Fig 1.9 SPC Card in which the degree of freedom in Y direction is arrested
Then we will be defining a curve which ramp up from 0 to 30 in 5 millisecond.Then we define a node set in the face in which we need to apply the displacement.And we will be defining this nodes set in the Prescribed_motion_Set card.This will ensure that our model will behave like as it is under the real tensile test.
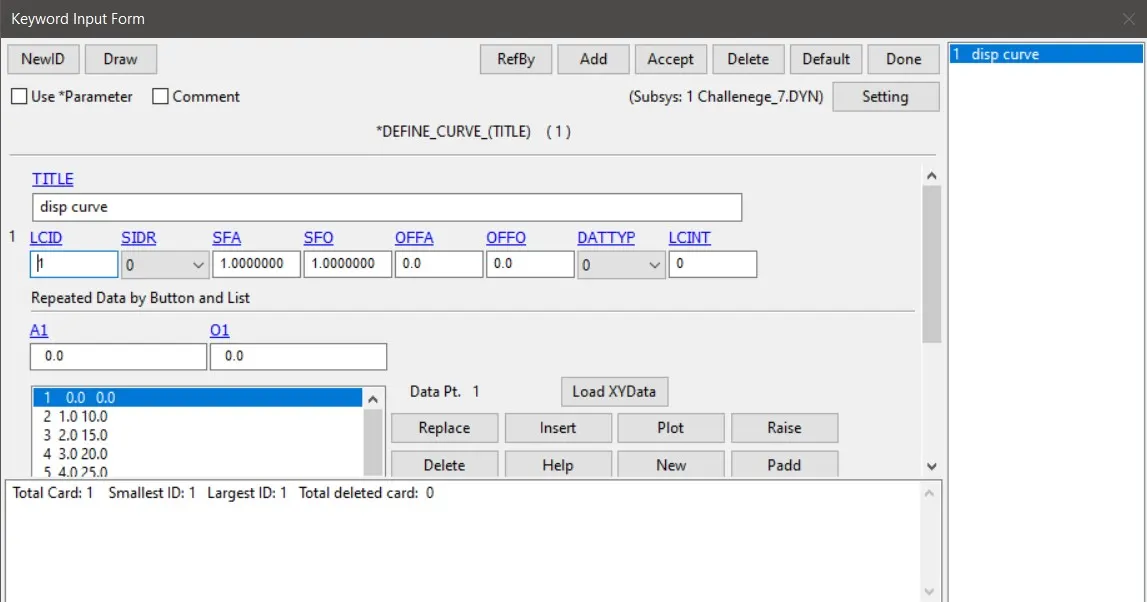
Fig 1.10 define curve Card
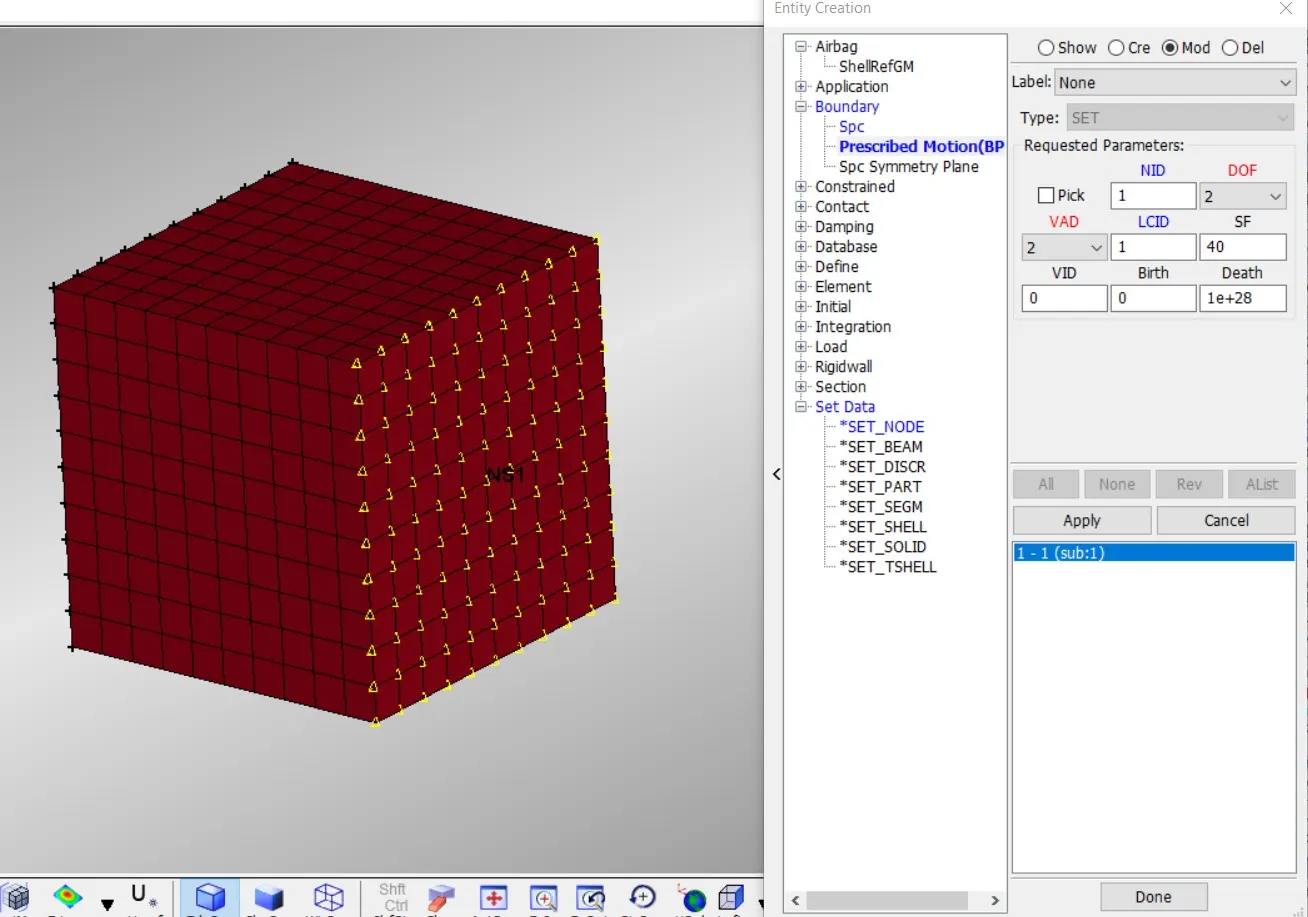
Fig 1.11 Node set defined with prescribed motion
We need to convert the card for an implicict analysis.So we need the implicit cards needed to be included in the deck. first we are creating an IMPLICIT_GENERAL card to convert the analysis to an implicit one.Here in IMPLICIT_GENERAL we need to set the IMFLAG as 1 which tells the solver to switch to implicit analysis mode.Then in ddition to it we need to create and IMPLICIT_AUTO Card .In this card we need to set IAUTO as 1 which basically means the automatic switching between implicit and explicit .This is used because if the solution find its harder to solve the problem then the solver will switch to explicit mode so that the problematic time step will be solved and then the solver will switch back to implicit and solves the rest of the problem in implicit mode. Also in this card we need to set DT_min as Dt/100 and set DT_max as DT x 10.and then hit accept and done.
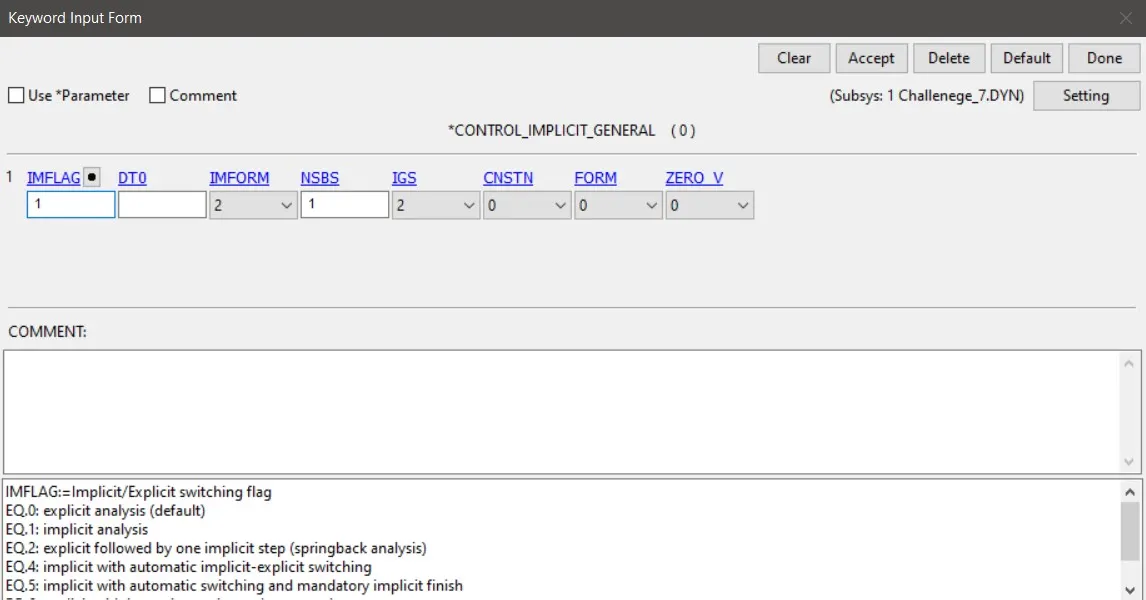
Fig 1.11 Control_Implicit_general Card
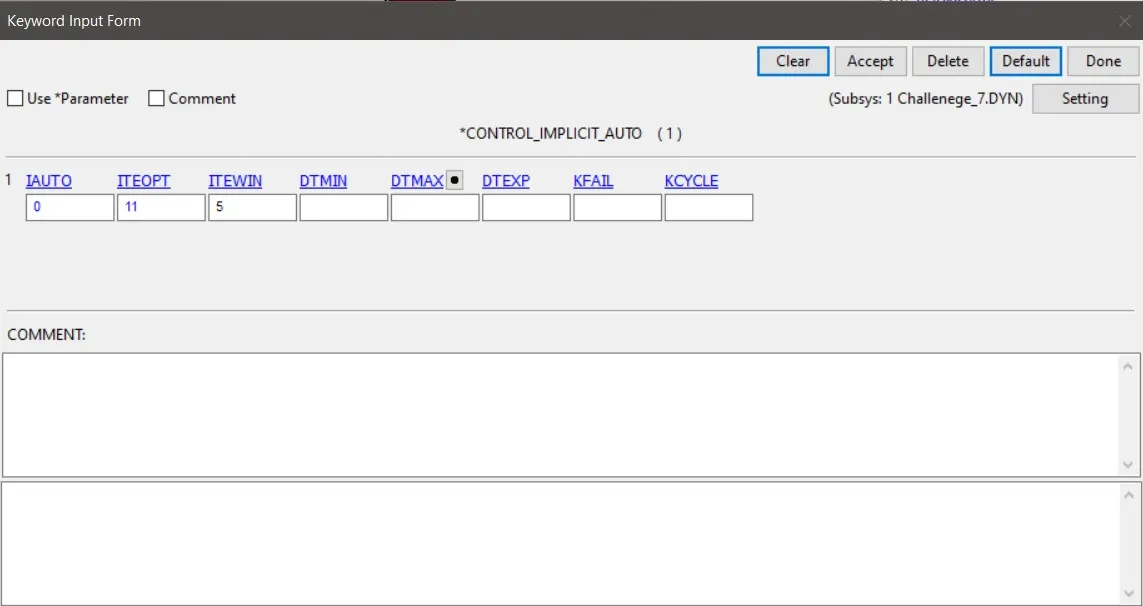
Fig 1.12 Control_Implicit_Auto Card
Then as usual we need to be having a control_termination card in which the termination time will be set as 30 ms.And we need to obtain the strain values of the elements as postprocessesing output.So we need to create a DATABASE_EXTENT_BINARY card in the problem so that we can set the STRFLG as 1 ,so that the plastic strain values of the elements will be written to the d3plot.Also as usual we need to have the DATABASE_BINARY_PLOT so that the simulation can be visble for postprocessesing.
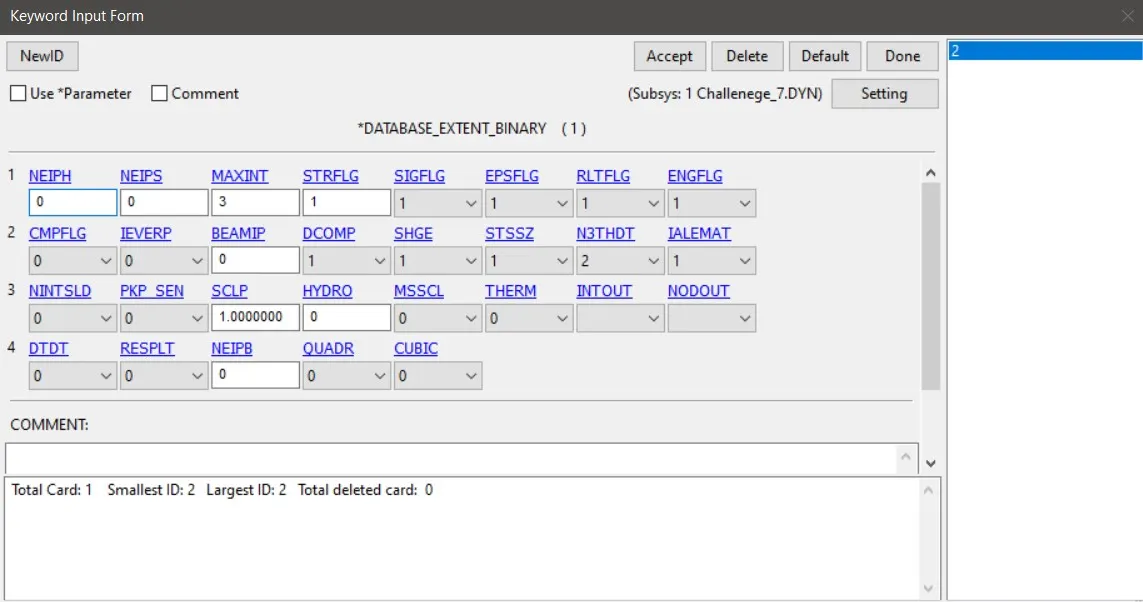
Fig 1.12 Database_Extent_Binary Card
This deck will be checked using the model checker and ensure the deck is free of errors.This deck will be opened in LS Dyna Program Manager and give memory as 1000M ,if enough memory is not availabel ,then the program will run in out of core which will slow down the run.So we give 1000M memory to ensure that doesnt happen.Then Set number of CPU as 2, which will set the solver to solve the problem using double precision solver.
Once we run the problem we need to open th binary plot of the simulation in the LS PrePost.Then we need to extract the Ture stress and true strain values in Y direction, as we give the displacement in y direction,and we are conducting a uniaxial test,
to extract the stress plot we can use HISTORY>ELEMENT>SELECT AN ELEMENT>SELECT Y STRESS >PLOT.Then save this plot. Similarly to extract strain values in y use HISTORY>ELEMENT>SELECT AN ELEMENT>SELECT lower ip strain in Y >Plot .Save this plot also.Both of this plots stress vs time and strain vs time.But the plot we need is stress vs strain.For this to obtain we ned to use XY PLot tool in side tool bar > Place radio button in CROSS > Select y strain along x axis and y stress along y axis> Plot.This will plot the strain vs tress graph.We need to save that plot.
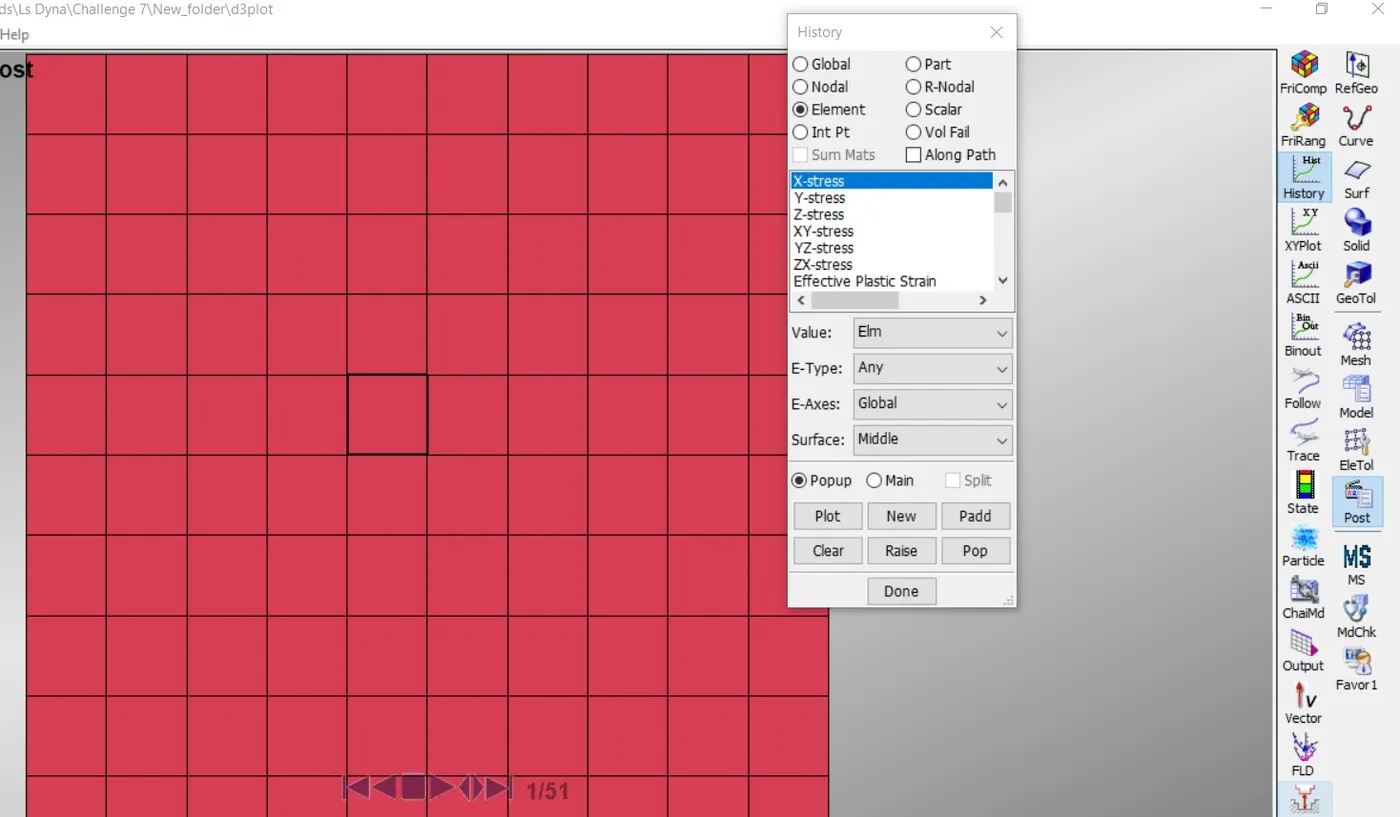
Fig 1.13 Y stress plotting using history tool
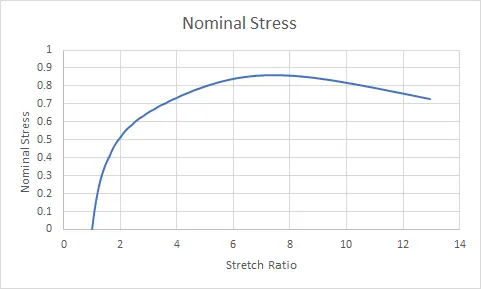
Then we need to open that file using notepad ++.Then we can see the ordinate and absicca value of the plot .Copy all and paste it into the Microsoft Excel.By using the equation in excel we can find out e^ true strain which will basically gives as 1 +Engineering strain. which is basically stretch ratio.Similarly we can find out true stress /stretch ratio in excel itself.Then we can using the insert plot option in excel we can plot the graph between the nominal stress vs Stretch Ratio.
Similarly we need to open the keyword file in notepad++ and set the elform as -1 and save it.Then again run the analysis with this new keyword file and repeat all the above process till we acheive the plot of nominal stress vs stretch ratio in excel.The very same process is needed to be repeated with chnaging the elform to 2 and -2 as well.
II) Results
Fig 2.1 Actual
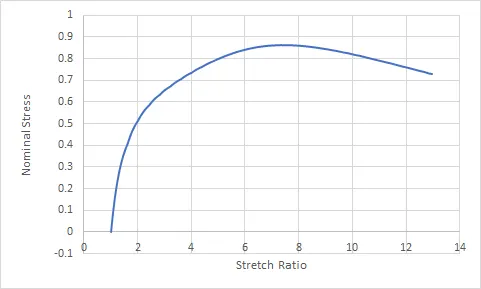
ELFORM 1 ELFORM -1
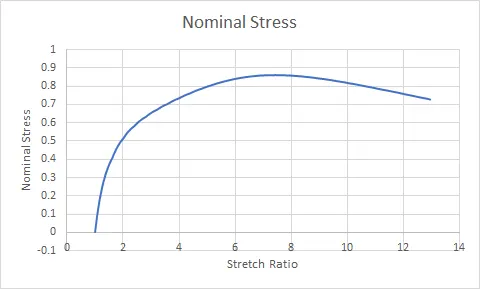
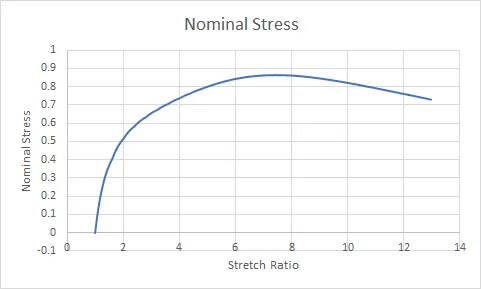
ELFORM 2 ELFORM -2
Nominal Stress is reaching its peak at 0.86 MPa ,from there its decreasing as the stretch ratio increasing.Till stretch ration equals 5 ,actual graph of hypereleastic material uniaxial test shows the value of nominal stress near to 1.8 Mpa ,But from all the graphs we obtained with changing ELFORM shows 0.86 MPa only.Graph we got here for differant ELFORM values are nearly same.Differant ELFORM serves differant purposes.Each one use for differant purposes.Elform -1 and -2 are slighly reduced fully integrated elform for elements with poor aspect ratio.Elform equls 2 is having shear locking issue even though it is fully integrated. Solid formulations -1 and -2 may offer improved behavior over formulation 2 by accounting for poor element aspect ratios in a manner so as to reduce the transverse shear locking effects seen in formulation 2.Since the porblem is niot so complex every element formulation succeed in giving almost same results.but the differance in each elform will be visible if we makes the problem complex.
CONCLUSION
The actual hyperelastic material graph for uniaxial test and the graphs we obtained for differant ELFORM values isn't matching for the all the values.The graphs nearly matches till the stretch ratio value of 2.But after that the curves are not matching.