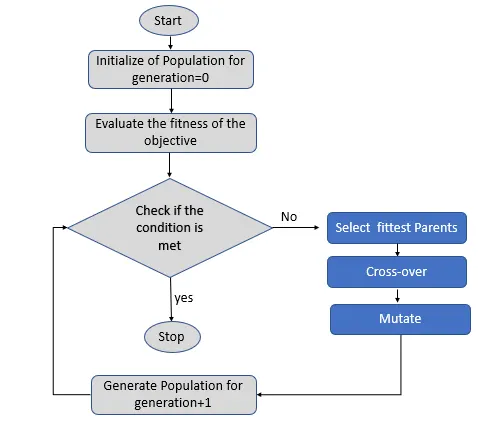
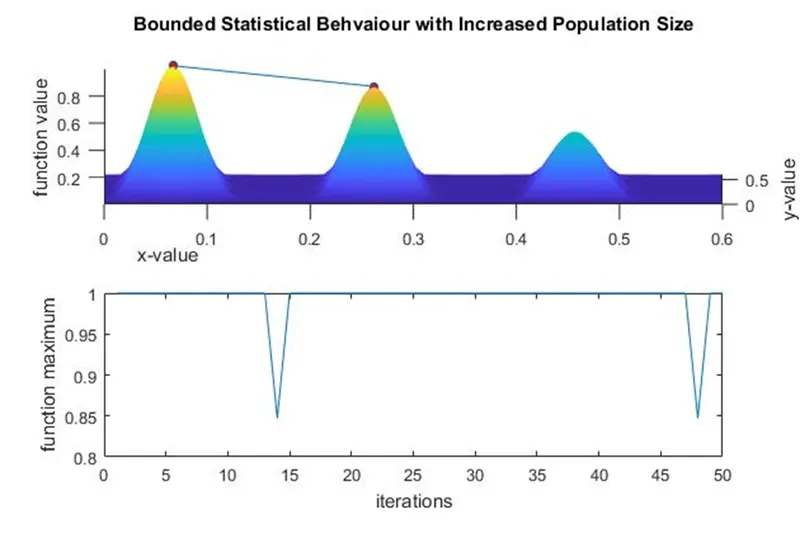
A genetic algorithm is a search heuristic that is inspired by Charles Darwin’s theory of natural evolution. This algorithm reflects the process of natural selection where the fittest individuals are selected for reproduction in order to produce offspring of the next generation. The genetic algorithm is inspired by the process that drives biological evaluation. The process of evaluation starts with the selection of the fittest individuals from a population. Then they produce offspring which inherit the characteristics of the parents and will be added to the next generation. If parents have better fitness, their offspring will be better than parents and have a better chance at surviving. This process keeps on iterating and in the end, a generation with the fittest individuals will be found. And this is the main working principle for the algorithm because, at each step, the genetic algorithm selects randomly from the current population to be parents and uses them to produce the children for the next generation. Over successive generations, the population evolves towards an optimal solution. The genetic algorithm can be applied to solve a variety of optimization problems that are not well suited for standard optimization algorithms, including problems in which the objective function is discontinuous, nondifferentiable, stochastic, or highly nonlinear.
clear all
close all
clc
x = linspace(0,0.6,150);
y = linspace(0,0.6,150);
num_cases = 50;
% creating a 2D mesh
[xx,yy] = meshgrid(x,y);
%Evaluating Stalagmite function
for i = 1:length(xx)
for j = 1:length(yy)
input_value(1)=xx(i,j);
input_value(2)=yy(i,j);
f(i,j) = stalagmite(input_value);
end
end
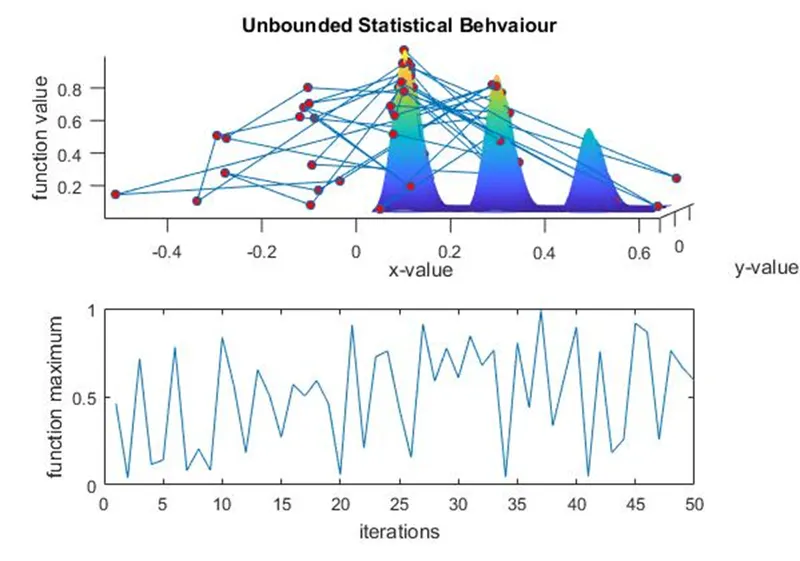
% Study1- Unbounded statistical behavior
tic
for i = 1:num_cases
[inputs1, fopt1(i)] = ga(@stalagmite, 2);
xopt(i) = inputs1(1);
yopt(i) = inputs1(2);
end
study1_time = toc;
figure(1)
subplot(2,1,1)
hold on
surfc(xx,yy,-f)
xlabel('X-Values')
ylabel('Y-Values')
zlabel('Function Values')
shading interp
plot3(xopt,yopt,-fopt1,'marker','o','markersize',5,'markerfacecolor','r')
title('Unbounded Statistical Behaviour')
subplot(2,1,2)
plot(-fopt1)
xlabel('Iterations')
ylabel('Function maximum')
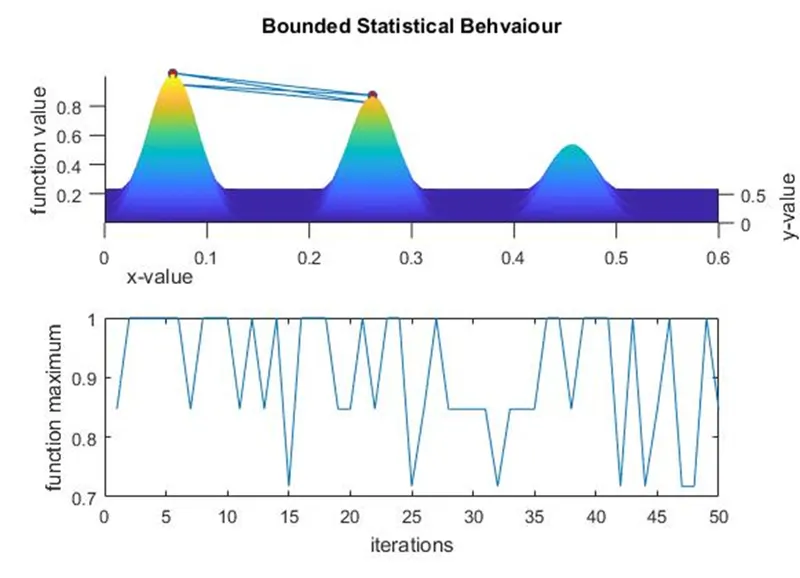
% Study2 - Statistical behavior with upper and lower bound
tic
for i = 1:num_cases
[inputs2,fopt2(i)] = ga(@stalagmite,2,[],[],[],[],[0;0],[1;1]);
xopt(i) = inputs2(1);
yopt(i) = inputs2(2);
end
study2_time = toc
figure(2)
subplot(2,1,1)
hold on
surfc(xx,yy,-f)
xlabel('X-Values')
ylabel('Y-Values')
zlabel('Function Values')
shading interp
plot3(xopt,yopt,-fopt2,'marker','o','markersize',5,'markerfacecolor','r')
title('Bounded Statistical Behaviour')
subplot(2,1,2)
plot(-fopt2)
xlabel('Iterations')
ylabel('Function Maximum')
%Study3- increasing GA iterations (Population size)
options = optimoptions('ga');
options = optimoptions(options,'PopulationSize',170);
tic
for i = 1:num_cases
[inputs3, fopt3(i)] = ga(@stalagmite,2,[],[],[],[],[0;0],[1;1],[],[],options);
xopt(i) = inputs3(1);
yopt(i) = inputs3(2);
end
study3_time = toc
figure(3)
subplot(2,1,1)
hold on
surfc(xx,yy,-f)
xlabel('X-Values')
ylabel('Y-Values')
zlabel('Function Values')
shading interp
plot3(xopt,yopt,-fopt3,'marker','o','markersize',5,'markerfacecolor','r')
title('Bounded Statistical behaviour with modified population size')
subplot(2,1,2)
plot(-fopt3)
xlabel('Iterations')
ylabel('Function maximum')
Total_time = study1_time + study2_time + study3_time
fprintf('n The results are below : ')
fprintf('nn study 1 : Unbounded statistical Bahaviour')
fprintf('nn The time taken for the study-1 is : %f',study1_time)
fprintf('n The co-ordinates of x & y for the global Maxima of the function are : %f,%f',inputs1(1),inputs1(2))
fprintf('nn the global maxima of the function is : %f',-(mean(fopt1)))
fprintf('nn study 2 : Unbounded statistical Bahaviour')
fprintf('nn The time taken for the study-2 is : %f',study2_time)
fprintf('n The co-ordinates of x & y for the global Maxima of the function are : %f,%f',inputs2(1),inputs2(2))
fprintf('nn the global maxima of the function is : %f',-(mean(fopt2)))
fprintf('nn study 3 : Unbounded statistical Bahaviour')
fprintf('nn The time taken for the study-3 is : %f',study3_time)
fprintf('n The co-ordinates of x & y for the global Maxima of the function are : %f,%f',inputs3(1),inputs3(2))
fprintf('nn the global maxima of the function is : %f',-(mean(fopt3)))