Week 5 - Genetic Algorithm
AIM: Write a code in MATLAB to optimise the stalagmite function and find the global maxima of the function.
OBJECTIVE:
- Write a code in MATLAB to optimise the stalagmite function and find the global maxima of the function.
- Plot graphs for all 3 studies and for F maximum vs no. of iterations. Title and axes labels are a must, legends could be shown if necessary.
BODY:
Part 1 (Program):
Program for the main Genetic Algorithm.
close all
clear all
clc

% inputs
x=linspace(0,0.6,150);
y=linspace(0,0.6,150);
num_spaces=50;

% to form 2d array
[xx,yy]=meshgrid(x,y);
for i=1:length(x)
    for j=1:length(y)
        input_vector(1)=xx(i,j);
        input_vector(2)=yy(i,j);
        f(i,j)=stagalmite(input_vector);
    end
end

% to study 1-unbounded
tic
for i=1:num_spaces
    [results,fopt(i)]=ga(@stagalmite,2)
    xopt(i)=results(1)
    yopt(i)=results(2)
end
study_time1=toc
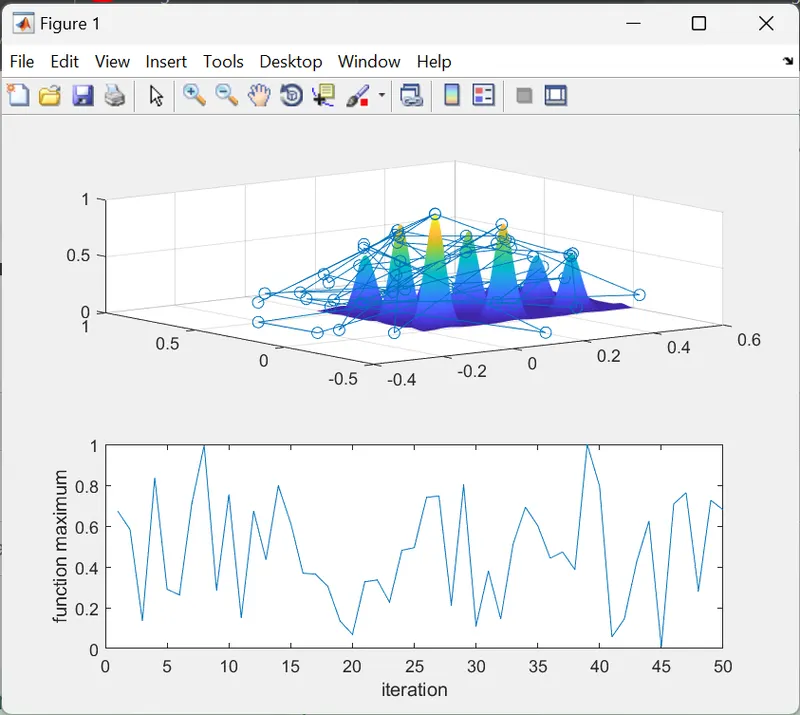
figure(1)
subplot(2,1,1)
surf(x,y,-f)
shading interp
hold on
plot3(xopt,yopt,-fopt,'marker','o')
subplot(2,1,2)
plot(-fopt)
xlabel('iteration')
ylabel('function maximum')

% to study 2- bounded
tic
for i=1:num_spaces
    [results,fopt(i)]=ga(@stagalmite,2,[],[],[],[],[0;0],[0.6;0.6])
    xopt(i)=results(1)
    yopt(i)=results(2)
end
study_time2=toc
figure(2)
subplot(2,1,1)
surf(x,y,-f)
shading interp
hold on
plot3(xopt,yopt,-fopt,'marker','o')
subplot(2,1,2)
plot(-fopt)
xlabel('iteration')
ylabel('function maximum')

% to study3- increased initial population
tic
options=optimoptions('ga')
options=optimoptions(options,'populationsize',250)
for i=1:num_spaces
    [results,fopt(i)]=ga(@stagalmite,2,[],[],[],[],[0;0],[0.6;0.6],[],[],options)
    xopt(i)=results(1)
    yopt(i)=results(2)
end

study_time3=toc
figure(3)
subplot(2,1,1)
surf(x,y,-f)
shading interp
hold on
plot3(xopt,yopt,-fopt,'marker','o')
subplot(2,1,2)
plot(-fopt)
xlabel('iteration')
ylabel('function maximum')
Program for the stagalmite function
function A = stagalmite(input_vector)
x=input_vector(1);
y=input_vector(2);
f1=(sin(5.1*pi*x+0.5)).^6;
f2=exp((-4*log(2)*((x-0.0667).^2))/0.64);
f3=(sin(5.1*pi*y+0.5)).^6;
f4=exp((-4*log(2))*((y-0.0667).^2)/0.64);
A =-(f1*f2*f3*f4);
end
Part 2 (Outputs):
Plot 1
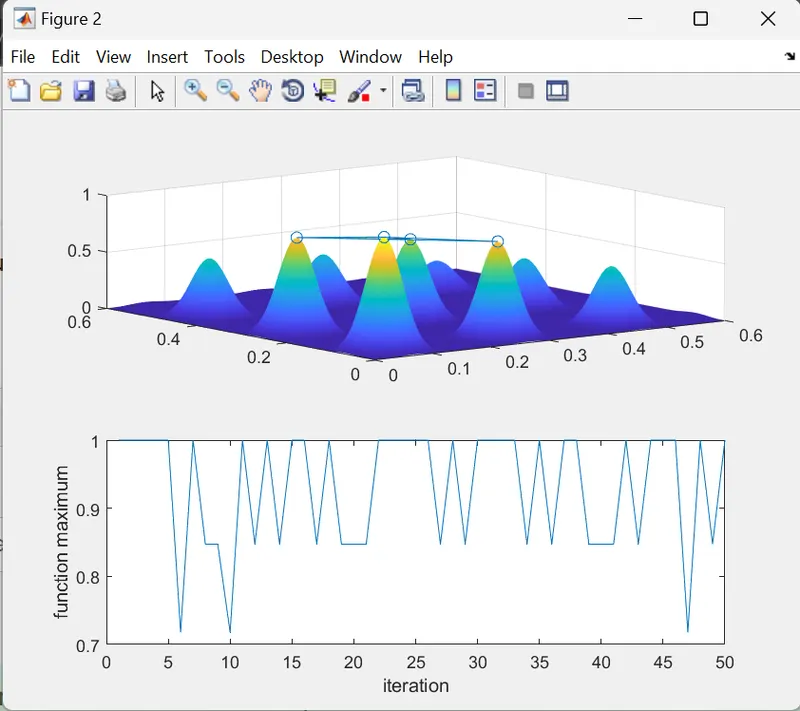
Plot 2
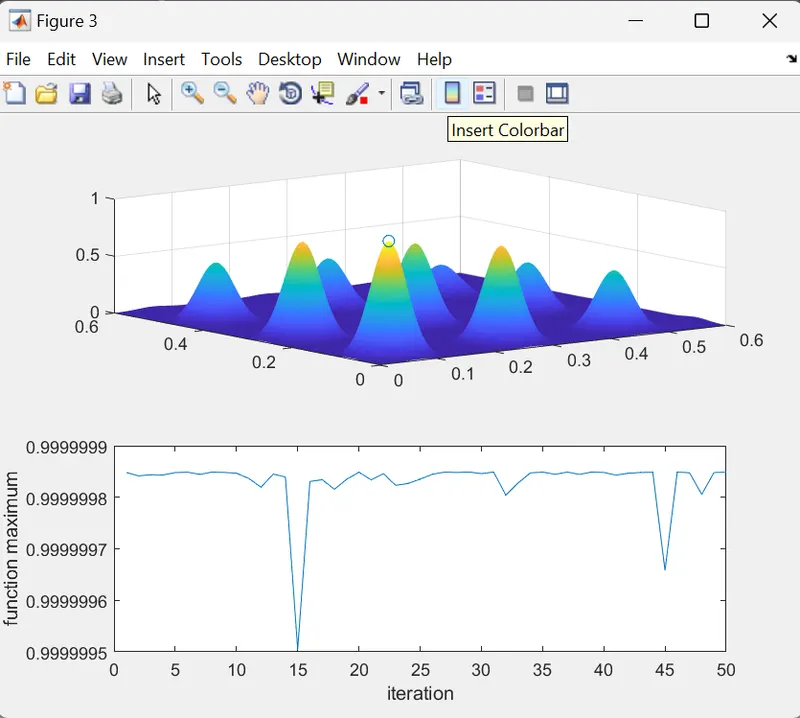
Plot 3
Part 3 (Explanation of code):
- First we initialise the values of x and y taking 150 values between the interval 0 and 0.6.
- Since we need to plot a 3D surface plot we take the 2d array of x and y using meshgrid command.
- We create another fuction file for the stalagmite function.
- For first iteration, we take no of iterations = num_spaces and we use the genetic algorithm function to caluclate the maxima of the function.
- For second iteration, we specify the lower and upper bounds of x and y in this case,the ga is initiated with random population only.
- For third iteration we increase our initial population which is default as 50 to 250.
Part 4 (Answers):
- Genetic Algorithm: Genetic Algorithm (GA) is a search-based optimization technique based on the principles of Genetics and Natural Selection. It is frequently used to find optimal or near-optimal solutions to difficult problems which otherwise would take a lifetime to solve. It is frequently used to solve optimization problems, in research, and in machine learning.
- Syntax for GA in MATLAB: