Week 5 - Curve fitting
1. What does popt and pcov mean? (Watch the video to get some context)
2. What does np.array(temperature) do?
3. What does the * in *popt mean?
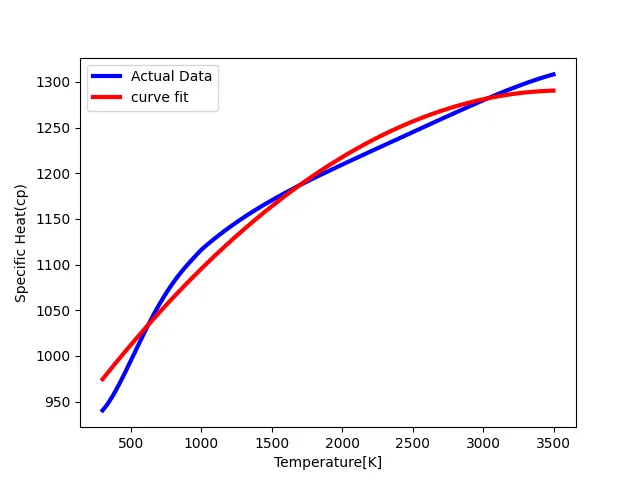
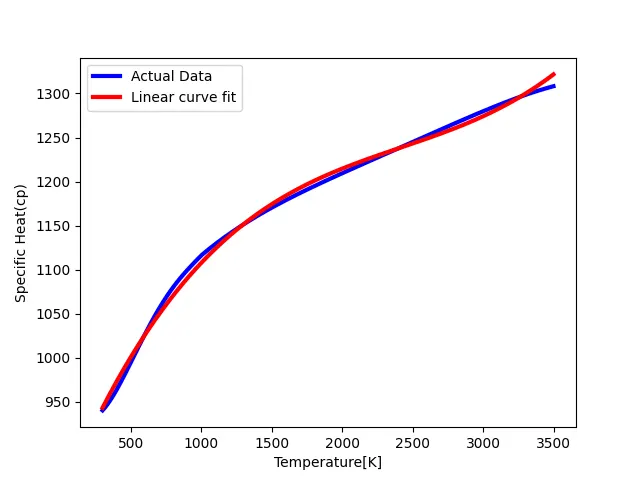
4. Write code to fit a linear and cubic polynomial for the Cp data. Explain if your results are good or bad.
5. What needs to be done in order to make the curve fit perfect?
6. Show empirically as to how well your curve has been fit.
%ANSWER
1. What does popt and pcov mean?
- pcov is a 2d array with the estimated covariance of the parameters in popt. It can be used to calculate the the standard deviation errors of popt.
- \"popt\" gives optimized curve for the given function, its gives best-fit parameter.
- The \"popt\" is the co-efficient of values of a,b,c,d.
- popt, pcov = curve_fit(line, x, y)
Thecurve_fitfunction returns two items, which we canpoptandpcov. Thepoptargument are the best-fit paramters foraandb:
2. What does np.array(temperature) do?
- This command is used to convert the all temperature into the numpy function , this command is used for some of the math operation cannot be done on list.
3. What does the * in *popt mean?
Note that there is a way to simplify the call to the function with the best-fit parameters, which is:
-
line(x, *popt)The * notation will expand a list of values into the arguments of the function. This is useful if your function has more than one or two parameters. Secondary and third array also we used for cubic curve fit.
4. Write code to fit a linear and cubic polynomial for the Cp data. Explain if your results are good or bad.
import numpy as np
import matplotlib.pyplot as plt
from scipy.optimize import curve_fit

#curve fir function (linear)

def func(t,a,b,c):
	return a*pow(t,2)+b*t+c

# Reading file

def read_file():
	temperature =[]
	cp = []
	for line in open('data','r'):
		value = line.split(',')
		temperature.append(float(value[0]))
		cp.append(float(value[1]))

	return[temperature,cp]


#Main program
temperature,cp =read_file()
popt,pcov = curve_fit(func,temperature,cp)
fit_cp = func(np.array(temperature),*popt)

plt.plot(temperature,cp,color ="blue",linewidth=3)
plt.plot(temperature,fit_cp,color="red",linewidth =3)
plt.legend(['Actual Data','curve fit'])
plt.xlabel('Temperature[K]')
plt.ylabel('Specific Heat(cp)')

plt.show()

#curve fir function (Cubic)

def func(t,a,b,c,d):
	return a*pow(t,3)+b*pow(t,2)+c*t+d

# Reading file

def read_file():
	temperature =[]
	cp = []

	for line in open('data','r'):
		value = line.split(',')
		temperature.append(float(value[0]))
		cp.append(float(value[1]))

	return[temperature,cp]


#Main program
temperature,cp =read_file()
popt,pcov = curve_fit(func,temperature,cp)
fit_cp = func(np.array(temperature),*popt)
print(popt)

plt.plot(temperature,cp,color ="blue",linewidth="3")
plt.plot(temperature,fit_cp,color="red",linewidth ="3")
plt.legend(['Actual Data','Linear curve fit'])
plt.xlabel('Temperature[K]')
plt.ylabel('Specific Heat(cp)')
plt.show()
5. What needs to be done in order to make the curve fit perfect?
- From tha above two methods shows that while using the higher order equation , we will get the accurate result according to the data we have , so its suggest to use higher order equation for desired reault with minimum error.
6. Show empirically as to how well your curve has been fit.
Finally, a program using PYTHON for curve fitting done successfully