Week 5 - Curve fitting
popt : gives array for optimal values for provided parameters so that sum of square of residuals is minimum
pcov : another array with covariance og parameters in popt to calculate standard deviation
np.array : stores values of temperature to pass on to function
*in*popt : stores value of constant parameters
Code :
#curve fit for linear equation

import numpy as np
import matplotlib.pyplot as plt
from scipy.optimize import curve_fit

#curve fit function
def func_linear(t,a,b):
	return a*t+b

#reading thermodynamic data file
def read_file():
	temperature=[]
	cp=[]
	for line in open('data','r'):
		values=line.split(',')
		temperature.append(float(values[0]))
		cp.append(float(values[1]))

	return[temperature,cp]

#main program
temperature,cp=read_file()
popt,pcov=curve_fit(func_linear,temperature,cp)
fit_cp=func_linear(np.array(temperature),*popt)

plt.plot(temperature,cp,color="blue",linewidth=3)
plt.plot(temperature,fit_cp,color="red",linewidth=3)
plt.title('Specific Heat Vs Temperature')
plt.legend(['Actual data','Curve fit'])
plt.xlabel('Temperature[K]')
plt.ylabel('cp')
plt.show()

#curve fit for cubic equation

import numpy as np
import matplotlib.pyplot as plt
from scipy.optimize import curve_fit

#curve fit function
def func_cubic(t,a,b,c,d):
	return a*pow(t,3)+b*pow(t,2)+c*t+d

#reading thermodynamic data file
def read_file():
	temperature=[]
	cp=[]
	for line in open('data','r'):
		values=line.split(',')
		temperature.append(float(values[0]))
		cp.append(float(values[1]))

	return[temperature,cp]

#main program
temperature,cp=read_file()
popt,pcov=curve_fit(func_cubic,temperature,cp)
fit_cp=func_cubic(np.array(temperature),*popt)

plt.plot(temperature,cp,color="blue",linewidth=3)
plt.plot(temperature,fit_cp,color="red",linewidth=3)
plt.title('Specific Heat Vs Temperature')
plt.legend(['Actual data','Curve fit'])
plt.xlabel('Temperature[K]')
plt.ylabel('cp')
plt.show()
Result for linear, quadratic and cubic curve fit respectively :
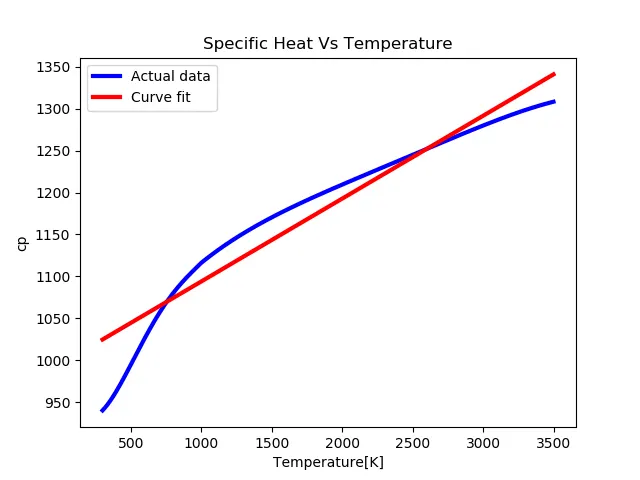
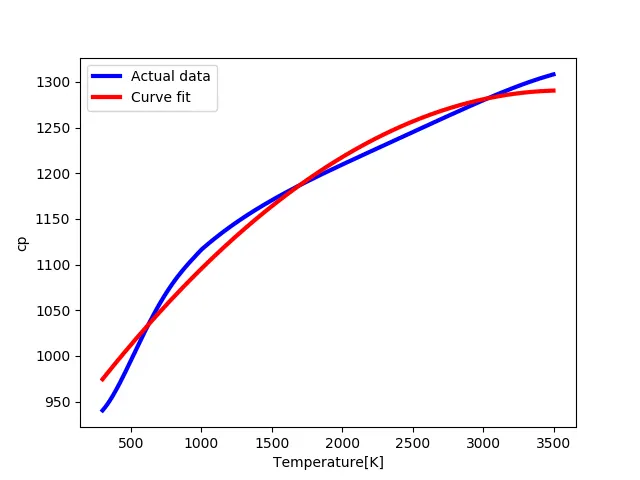
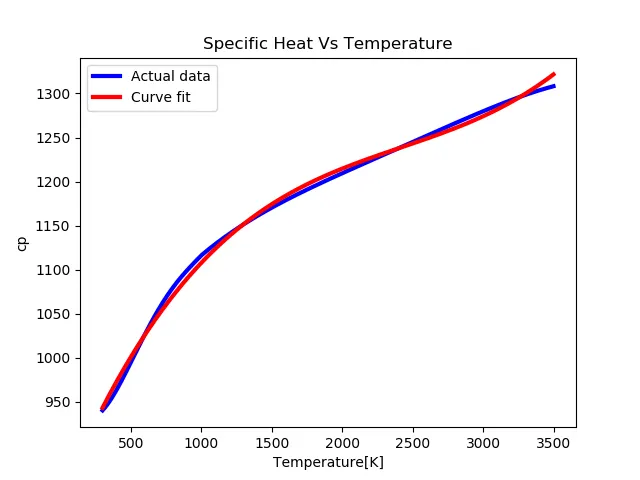
It can be observed that the deviation from actual data decreases with increase in degree of polynomial function.