Week 5 - Curve fitting
1)What do popt and pcov mean?
- popt - they are an array of optimal values which minimize the sum of squares of residuals
pcov - 2d array of residual which contains the covariance of popt, the diagonals provide the variance of the parameters estimate.
2)What does np.array(temperature) do?
- np.array is used to convert the python list to an array that can be easily read on python.
3)What does the * in *popt mean?
- this command refers to the values stored inside the array
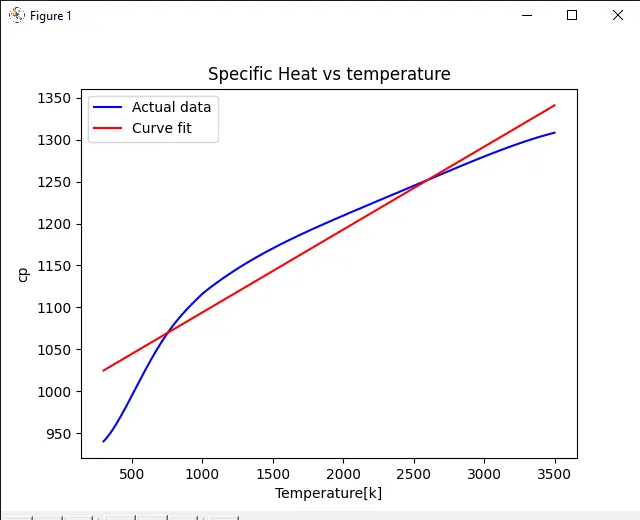
4) Write code to fit a linear and cubic polynomial for the Cp data. Explain if your results are good or bad.
import math
import matplotlib.pyplot as plt
import numpy as np
from scipy.optimize import curve_fit

 #curve fit function
def func_linear(t,a,b):
 	return a*t+b

 #thermodynamic data file read
def read_file():
 	temperature = []
 	cp = []
 	for line in open('data','r'):
 		values = line.split(',')
 		temperature.append(float(values[0]))
 		cp.append(float(values[1]))

 	return[temperature,cp]

#main program
temperature,cp = read_file()
popt,pcov = curve_fit(func_linear,temperature,cp)
fit_cp=func_linear(np.array(temperature),*popt)

#plotting
plt.plot(temperature,cp,color ="blue")
plt.plot(temperature,fit_cp,color="red")
plt.title('Specific Heat vs temperature')
plt.legend(['Actual data','Curve fit'])
plt.xlabel('Temperature[k]')
plt.ylabel('cp')
plt.show()


#curve fit for cubic equation

def func_cubic(t,a,b,c,d):
	return a*pow(t,3)+b*pow(t,2)+c*t+d

#reading thermodynamic data file
def read_file():
	temperature =[]
	cp = []
	for line in open('data','r'):
		values = line.split(',')
		temperature.append(float(values[0]))
		cp.append(float(values[1]))

	return[temperature,cp]

#main program
temperature,cp = read_file()
popt,pcov = curve_fit(func_cubic,temperature,cp)
fit_cp = func_cubic(np.array(temperature),*popt)

#plotting
plt.plot(temperature,cp,color ="blue")
plt.plot(temperature,fit_cp,color="red")
plt.title('Specific Heat vs temperature')
plt.legend(['Actual data','Curve fit'])
plt.xlabel('Temperature[k]')
plt.ylabel('cp')
plt.show()
plots:
linear plot
cubic plot:
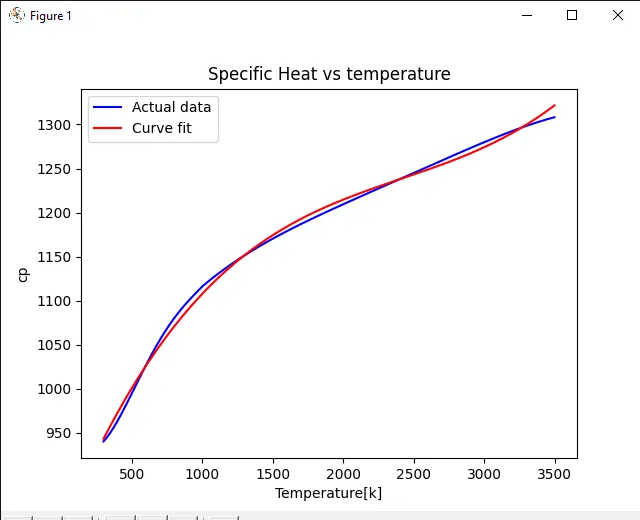
From the above plots, we can conclude that the cubic plots are much accurate and aligned with the actual values compared to the linear approach.
5) What needs to be done in order to make the curve fit perfect?
- As we increase the degree the accuracy of the curve increases
- if we consider higher-order power such as a 4-degree polynomial we can increase the accuracy of the curve compared to the cubic curve.
- increase in the order of polynomial computational time and variables increases, hence it may consume more computational time but the accuracy will also increase substantially. Hence we can conclude that 4th order polynomial can be used to higher accuracy curve fitting.