Curve fitting
Curve Fitting using Constant Pressure vs Temperature
Aim:
To able to write the python program to find the best curve fit from linear, quadratic and cubic polynomial equations by using the constant pressure & temperature data file and also answer the following questions:
1.What does popt and pcov mean?
2.What does np.array(temperature)do?
3.What does the "in" popt mean?
4.Write code to fit a linear and cubic polynomial for cp data.Explain if your results are good or bad.
5.What needs to be done in order to make the curve fit perfect?
6.Show empirically as to how well your curve has been fit.
Software Required:
1.Python
2.Sublime
Theory:
Curve fitting is the process of constructing a curve, or mathematical functions, which possess the closest proximity to the real series of data. By curve fitting, we can mathematically construct the functional relationship between the observed dataset and parameter values, etc. It is highly effective in the mathematical modeling of some natural processes.
Curve fitting is a type of optimization that finds an optimal set of parameters for a defined function that best fits a given set of observations.
Unlike supervised learning, curve fitting requires that you define the function that maps examples of inputs to outputs.
The mapping function, also called the basis function can have any form you like, including a straight line (linear regression), a curved line (polynomial regression), and much more. This provides the flexibility and control to define the form of the curve, where an optimization process is used to find the specific optimal parameters of the function.
Questions:
1.What does popt and pcov mean?
Sol:popt- An array of optimal values for the parameters which minimizes the sum of squares of residuals. pcov-2d array which contains the estimated covariance of popt. The diagonals provide the variance of the parameter estimate.
2.What does np.array(temperature) do?
Sol:This np.array(temperature) stores the values of temperature in the form of array and passes it to the module numpy.
3.What does the "in" popt mean?
Sol:It store the values of the constant parameters(a,b,c,d) in the array popt.
4.Write code to fit a linear and cubic polynomial for cp data.Explain if your results are good or bad.
Sol: Program calculations and its Explanations:
Initially we need to comment what the progamme is about then import the necessary modules and functions which are required for the plotting the linear, quadratic & cubic polynomial equations. And also find the R values for each polynomial equation to find the perfect curve.
Programme for finding the curve fit and numerical r values for finding best:
Curve fit for linear polynomial equation:
"""
Program for finding the curve fit for linear equation
by thulasi ram
"""

import numpy as np
import matplotlib.pyplot as plt
from scipy.optimize import curve_fit

#Curve fit function
def func(t, a, b, c, d):
	return a*t+b

#Reading thermodynamic data file
def read_file():
	temperature=[]
	cp=[]
	for line in open('data','r'):
		values=line.split(',')
		temperature.append(float(values[0]))
		cp.append(float(values[1]))

	return[temperature, cp]

#Main program
temperature, cp=read_file()
popt, pcov=curve_fit(func, temperature, cp)
fit_cp=func(np.array(temperature),*popt)

# Error_Quadratic
Error_1=np.array(cp)-np.array(fit_cp)
Error_2=np.square(Error_1)
SSE=sum(Error_2)
SSR_x1=np.array(fit_cp)-np.mean(cp)
SSR_x2=np.square(SSR_x1)
SSR=sum(SSR_x2)

#R^2=(SSR/SST)
R_SQR=(SSR/(SSR+SSE))

print("R_value",R_SQR)

plt.plot(temperature,cp,color="blue",linewidth=3)
plt.plot(temperature,fit_cp,color="red",linewidth=3)
plt.legend(['Actual data','curve fit'])
plt.title('Curve_fit_for_linear_equation')
plt.xlabel('temperature[k]')
plt.ylabel('cp')

plt.show()
Output:
Curve fit for quadratic polynomial equation:
"""
Program for finding the curve fit for quadratic equation
by thulasi ram
"""

import math
import numpy as np
import matplotlib.pyplot as plt
from scipy.optimize import curve_fit

#Curve fit function
def func(t, a, b, c):
	return a*pow(t,2)+b*t+c

#Reading thermodynamic data file
def read_file():
	temperature=[]
	cp=[]
	for line in open('data','r'):
		values=line.split(',')
		temperature.append(float(values[0]))
		cp.append(float(values[1]))

	return[temperature, cp]

#Main program
temperature, cp=read_file()
popt, pcov=curve_fit(func, temperature, cp)
fit_cp=func(np.array(temperature),*popt)

# Error_Quadratic
Error_1=np.array(cp)-np.array(fit_cp)
Error_2=np.square(Error_1)
SSE=sum(Error_2)
SSR_x1=np.array(fit_cp)-np.mean(cp)
SSR_x2=np.square(SSR_x1)
SSR=sum(SSR_x2)

#R^2=(SSR/SST)
R_SQR=(SSR/(SSR+SSE))

print("R_value",R_SQR)

plt.plot(temperature,cp,color="blue",linewidth=3)
plt.plot(temperature,fit_cp,color="red",linewidth=3)
plt.legend(['Actual data','curve fit'])
plt.title('Curve_fit_for_quadratic_equation')
plt.xlabel('temperature[k]')
plt.ylabel('cp')

plt.show()
Output:
Curve fit for cubic polynomial equation:
"""
Program for finding the curve fit for cubic equation
by thulasi ram
"""

import numpy as np
import matplotlib.pyplot as plt
from scipy.optimize import curve_fit

#Curve fit function
def func(t, a, b, c, d):
	return a*pow(t,3)+b*pow(t,2)+c*t+d

#Reading thermodynamic data file
def read_file():
	temperature=[]
	cp=[]
	for line in open('data','r'):
		values=line.split(',')
		temperature.append(float(values[0]))
		cp.append(float(values[1]))

	return[temperature, cp]

#Main program
temperature, cp=read_file()
popt, pcov=curve_fit(func, temperature, cp)
fit_cp=func(np.array(temperature),*popt)

# Error_Quadratic
Error_1=np.array(cp)-np.array(fit_cp)
Error_2=np.square(Error_1)
SSE=sum(Error_2)
SSR_x1=np.array(fit_cp)-np.mean(cp)
SSR_x2=np.square(SSR_x1)
SSR=sum(SSR_x2)

#R^2=(SSR/SST)
R_SQR=(SSR/(SSR+SSE))

print("R_value",R_SQR)

plt.plot(temperature,cp,color="blue",linewidth=3)
plt.plot(temperature,fit_cp,color="red",linewidth=3)
plt.legend(['Actual data','curve fit'])
plt.title('Curve_fit_for_cubic_equation')
plt.xlabel('temperature[k]')
plt.ylabel('cp')

plt.show()
Output:
Results:
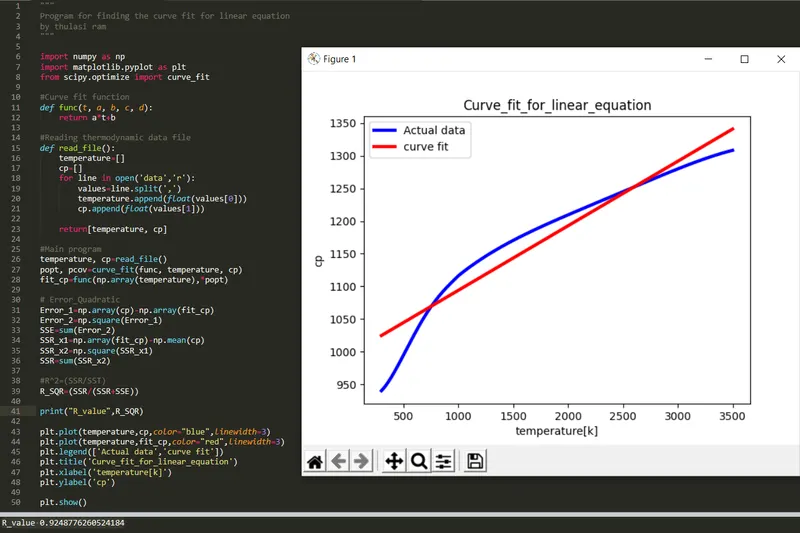
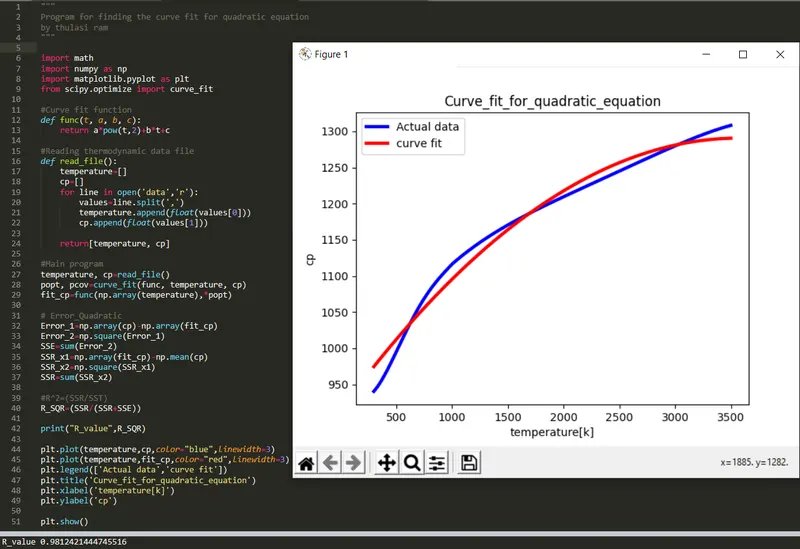
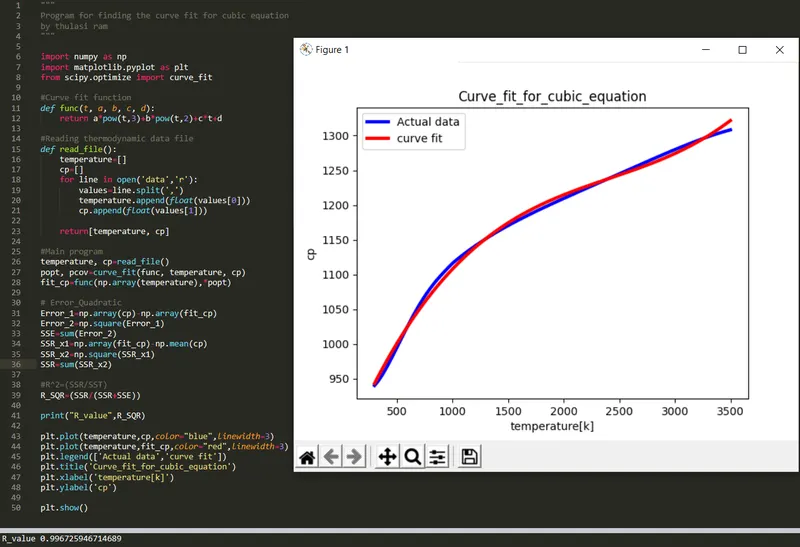
1.While comparing the visuvalization of the three graphs, the cubic polynomial is better then quadratic polynomial, quadratic polynomial is better then linear polynomial because of cubic curve is higher degree polynomial then quadratic and linear.
2.As per the numerical analysis (R_square value) cubic curve fit is best(good) among the quadratic and linear fit because as per the R_square value which lies between the 0.95 to 1 is good fit.So, the cubic fit is good as per the numerical results.
5.What needs to be done in order to make the curve fit perfect?
Sol: As per the linear, quadratic and cubic polynomial equations and its curves it is clearly know that the increasing of the order of polynomial gives the better curve fit then previous one. This is also done with the help of splitting the data into small values.
6.Show empirically as to how well your curve has been fit.
Sol: To show the curve is empirically fit or best we need to calculate the R_square value for given polynomial function. If the r value lies between the 0.95 to 1 then it will be best curve fit.
Conclusion:
Hence as per linear, quadratic and cubic curve fits it is concluded that cubic curve is best curve based on the numerically analysis by using the constant pressure and temperature data file.