Week 5 Battery characteristics using drive cycle
Aim:- Battery characteristics using drive cycle
Object:-
Simulate generic battery model charge discharge using UDDS data.
Theory:-
A driving cycle is a series of data points representing the speed of a vehicle versus time. Driving cycles are produced by different countries and organizations to assess the performance of vehicles in various ways, as for example fuel consumption and polluting emissions.
UDDS stands for URBAN DYNAMOMETER DRIVING SHEDULE and refers to the United States Environmental Protection Agency mandated dynamometer test on fuel economy that represents city driving condition which are used for light duty vehicle testing.
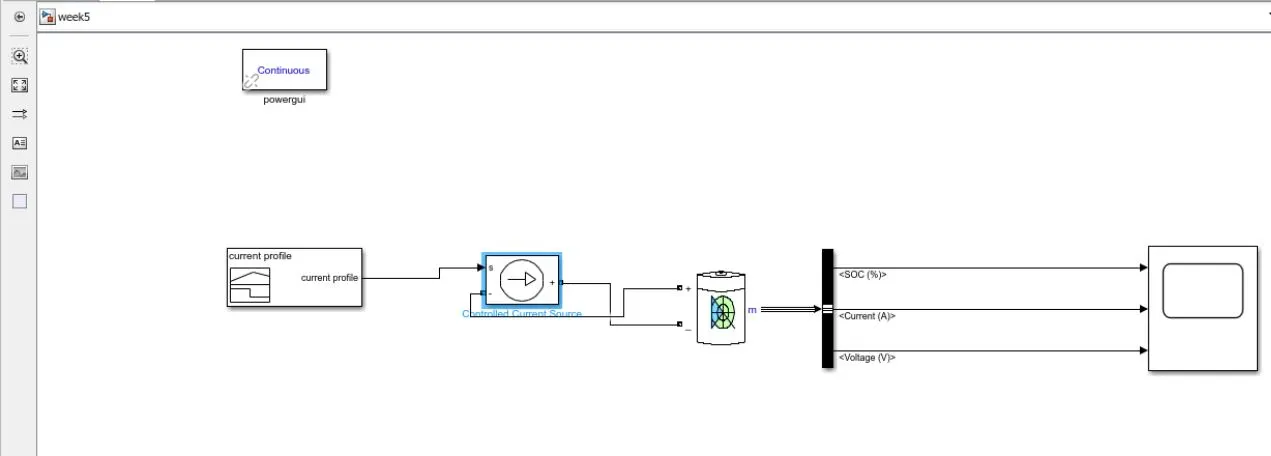
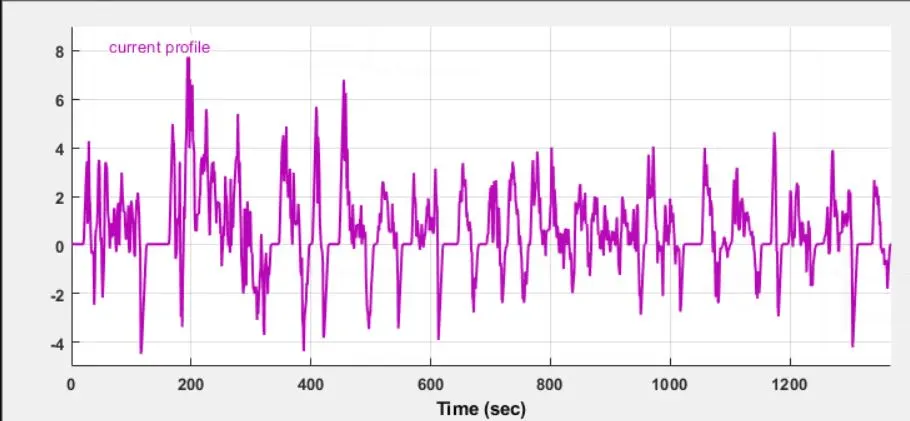
We start with taking the datasheet of the UDDS and due to the limittation of the signal builder is that it accept data in the formof only the current profile, so from the datasheet, we will consider the values of current vs time and feed these values into the signal builder(input), then the input values go to the controlled current sources which takes the values from the Simulink model and convert it into equivalent current source, this current source is now ready to be fed into the battery to complete the initial circuit which is readable for the battery and can perform functions accordingly, now we need a bus selector to filter the output results we want into the scope which is readable for humans and the final plots can seen here.
Powergui acts as a solver for the circuit, it is used to solve the circuit or equivalent model is solved using the Powergui Block.
Model:-
Inputs:-
1. Signal Builder- The Signal Builder Block allows you to create interchangeable groups of piecewise liner signal sources and use them in a model. You can quickly switch the signal groups into and out of a model to facilitate testing. In Signal Builder window create signals and define the output waveforms.
2. Controlled Current Source- The controlled current source the Simulink input Signal into an equivalent current source. The genereted current is driven by the input signal of the block. The positive current direction is shown by the arrow in the block icon.
You can inialize the controlled current source block with a specific AR or DC current. If we want to start the simulation in steady-state, the block input must be connected to a signal starting as a sinusoidal or DC waveform corresponding to the initial values. Double click controlled current source and from the drop-down menu of measurement select current. The signal output will connect with a scope by adding the current signal to it, (+) the terminal will connect with the battery(-) terminal.
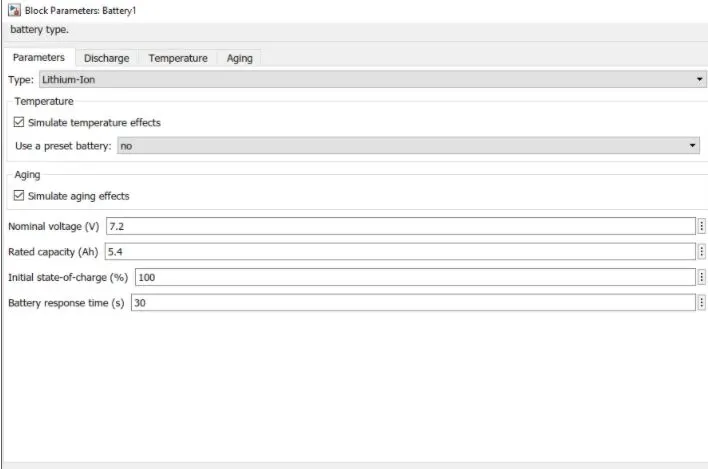
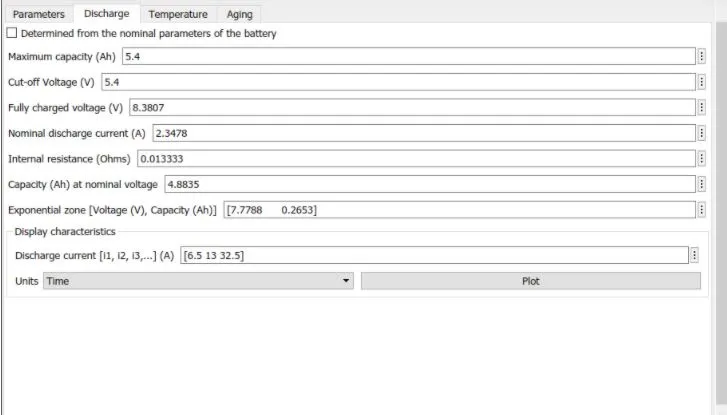
3. Battery- The Battery Block implements a generic dynamic model that represnets the most popular types of rechargeable batteries.
4. BUS Selecter- The BUS Selecter Block outputs the signal you select from the input BUS. The Block can output the selected elements seperately or in a new virtual BUS. So from input of battery select SOC%, current and voltage to output scope.
5. Powergui- The Powergui Block allows you to choose one of these methods to solve your circuit. Which uses a variable-step solver from Simulink, Discretization of the electrical system for a solution at fixed time steps continous or discrete phasor solution. The Powergui block aslo open tools for steady-states and simulation results analysis and for advance parameter design.
You need the Powergui block to simulate any Simulink model containig Simscape Electrical Specialized Power Systems blocks. It stores the equivalent Simulink circuit that represents the state-space equations of the model.
6. Scope- Display signals genereted during simulation.
Battery Input-
Output:-
Observation:-
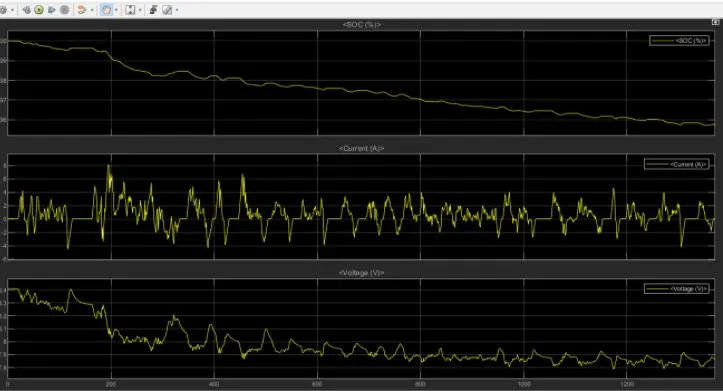
- We can observe the rate of discharge of the battery as time progress as the battery has crest which implies the battery was charged at some points of the drive cycle which indicates that there is a regeneretive braking application, whenever the vehicle is braked the battery is recharged, the simultion was done for 1371 seconds and SOC of the battery can be concluded to be around 96%-95.5%.
- From the current and voltage curves, we can clearly see an inverse relationship between the current and voltage as the current increases the voltage curve decreases, the negative current shows that the battery is being charged and current is being delivered at any level when required, the different peaks of the current indicated the speed required, a lot can be learned just by the current plots abouts the driver's behavior such as hard braking points peak acceleration points and more.
- The voltage of the battery gradually decreases as it dischrages. In a lithium-ion battery the decrease is extremely small until the unit is almost flat at which point the voltage falls of very quickly, for every through of voltage curve there will be a crest for the current due the presence of internal resistance.
Conclusion:-
THE SIMULINK OF THE GENERIC BATTERY MODEL'S DISCHARGE HAS BEEN PERFORMED USING THE UDDS DRIVE CYCLE DATA WITH SIMULINK. THE RESULTS OF THE BATTERY VOLTAGE CURRENT AND STATE OF CHARGE HAVE BEEN PLOTED AND THE OBSERVATION HAVE BEEN EXPALINED AS WELL.