Week 4: Project - Transient simulation of flow over a throttle body
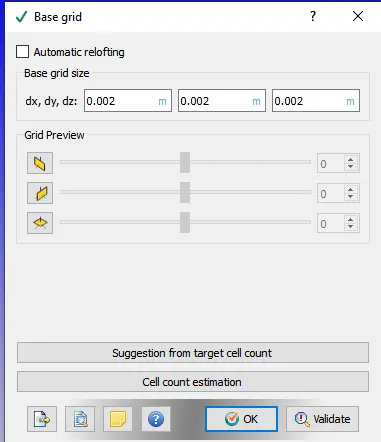
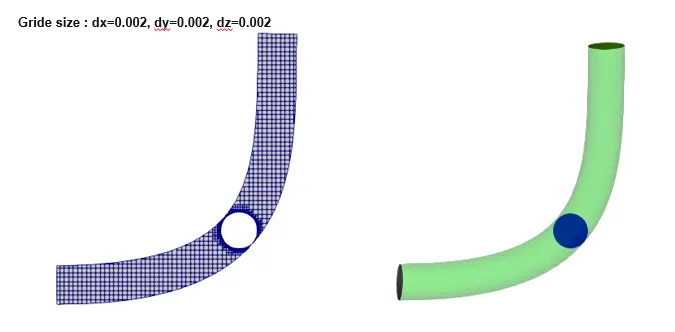
AIM: To perform transient state simulation for flow over throttle body having mesh size dx = 2e-3m, dy = 2e-3m & dz = 2e-3m and achieve the below enclosed objectives.
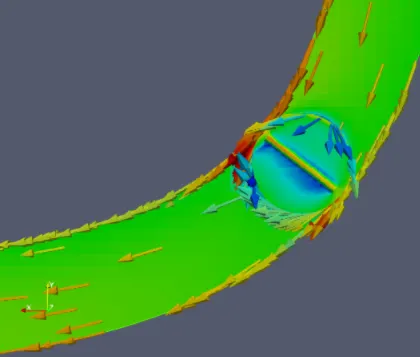
- Post process the results and show pressure and velocity contours.
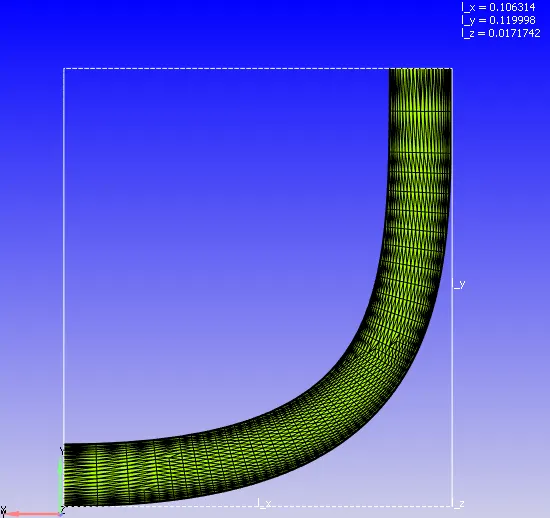
- Show the mesh (i.e surface with edges)
- Show the plots for pressure, velocity, mass flow rate and total cell count.
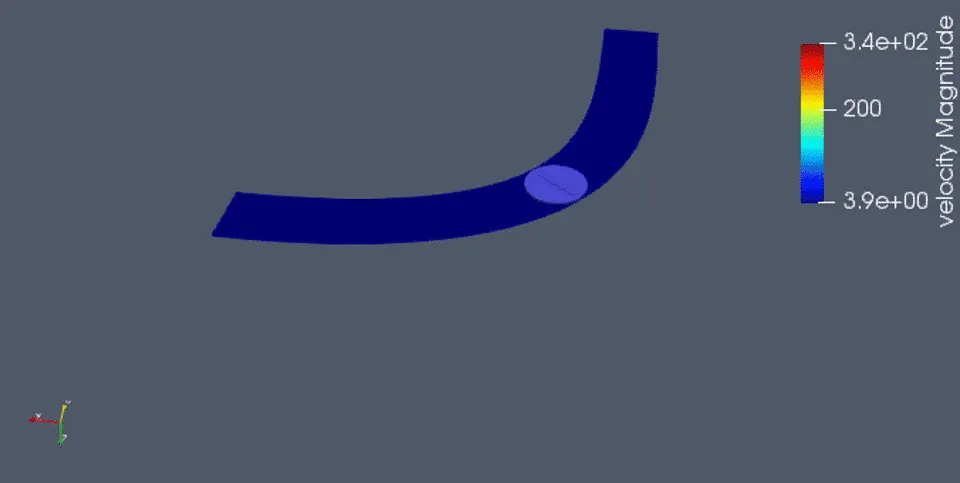
- Create an animation with throttle movement
METHODOLOGY OR CASE SETUP:
Introduction:
A throttle is a device used to control the fluid flow especially in engines sto regulate the amount of fuel or the air. In this simulation the fluid flow over a throttle valve is studied at transient state.
1. Geometry
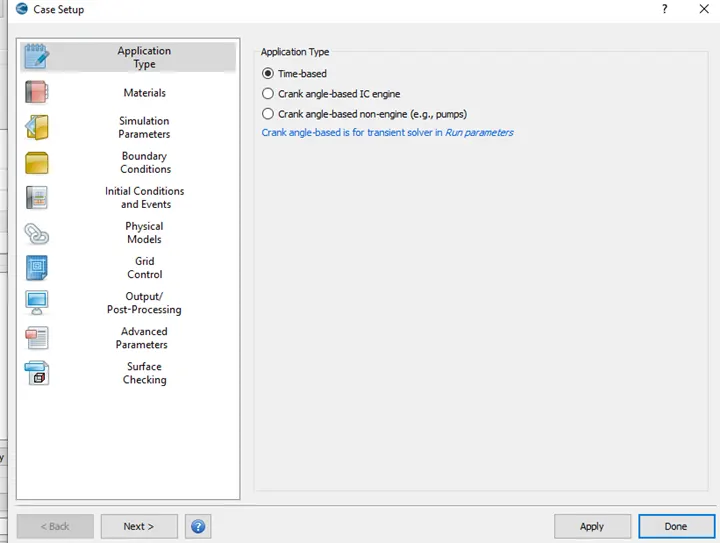
Application Type = Time-based
2. Mesh
- dx = 2e-3m, dy = 2e-3m, dz = 2e-3m
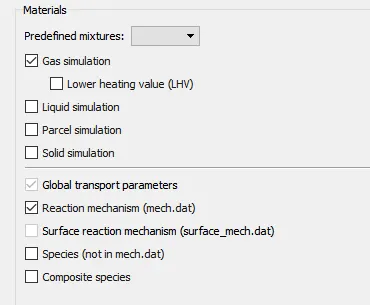
3. Material: Air
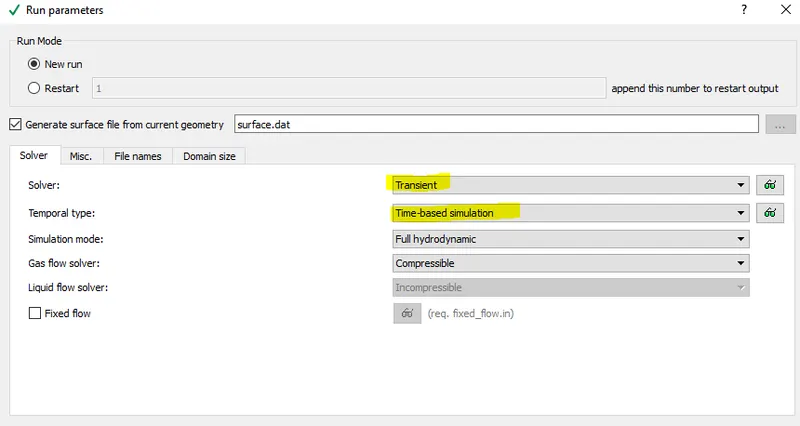
4. Time parameters:
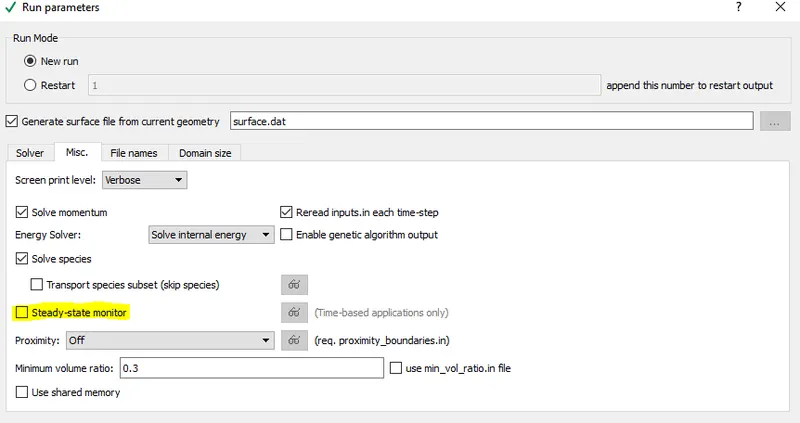
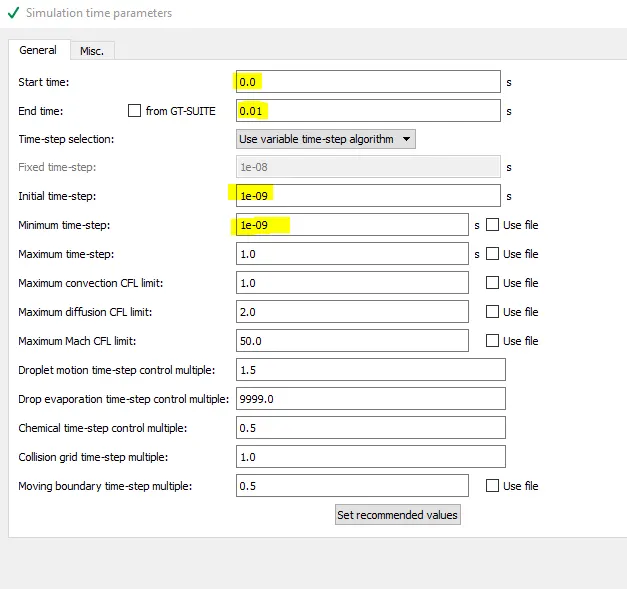
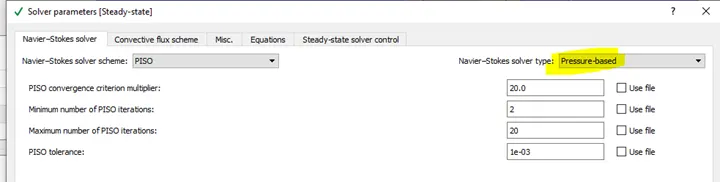
Steady state solver with simulation end time of 15000 cycles and other parameters are shown below.
End Time Calcuation
| Parameters | Value | Unit | Remarks |
| Length of pipe | 0.2 | m | |
| Average Velocity | 190 | m/s | Taken from Steady state flow |
| Time for 1 cycle | 0.001053 | sec | = length of pipe/Average Velocity |
| End Time | 0.01 | sec | Cycle is Run for 10 times = Time for 1 cycle *10 |
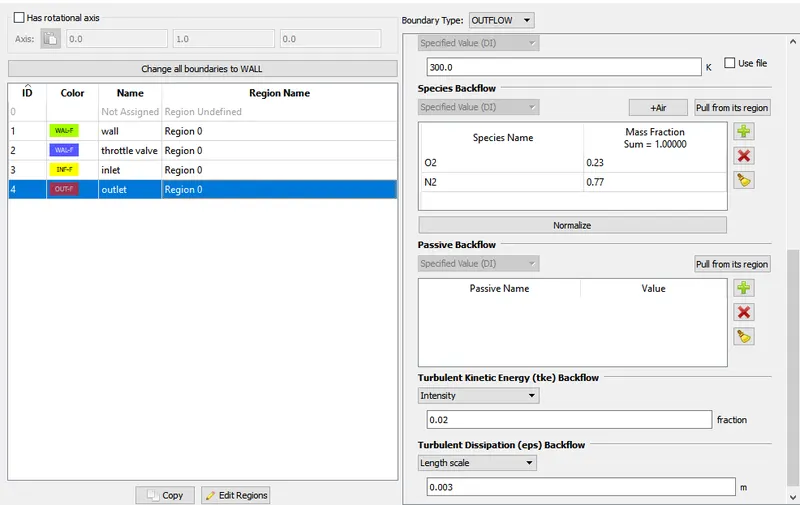
4. Boundary Conditions:
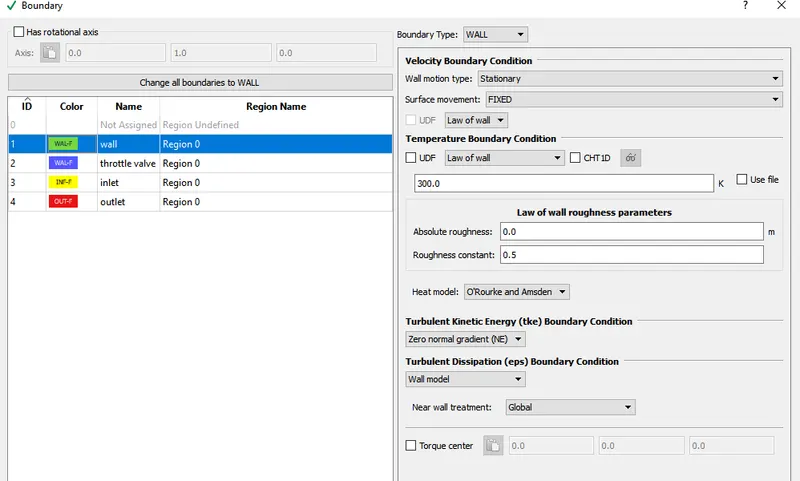
Wall:
Throttle valve:
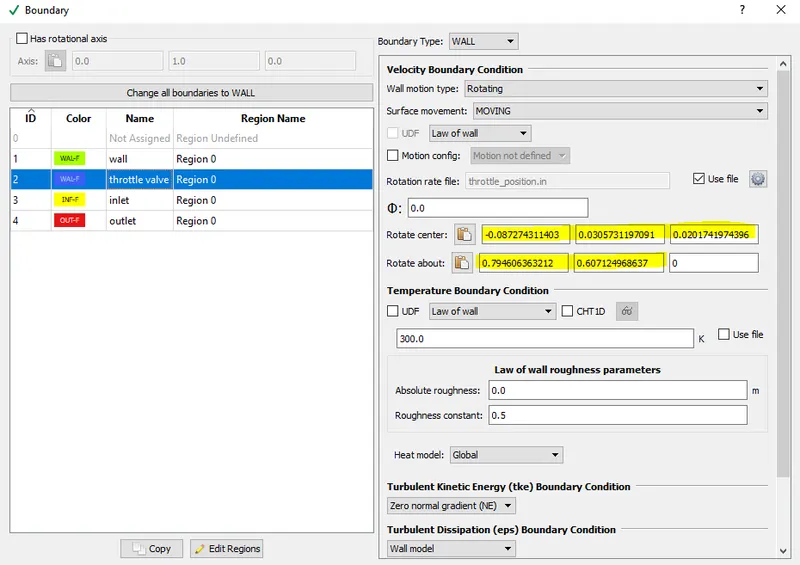
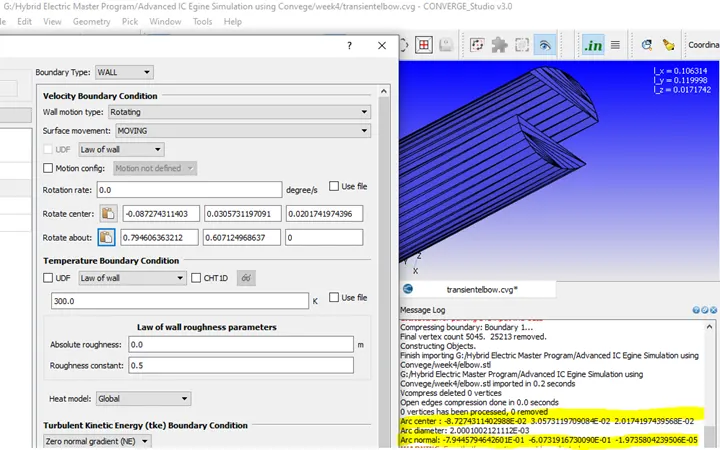
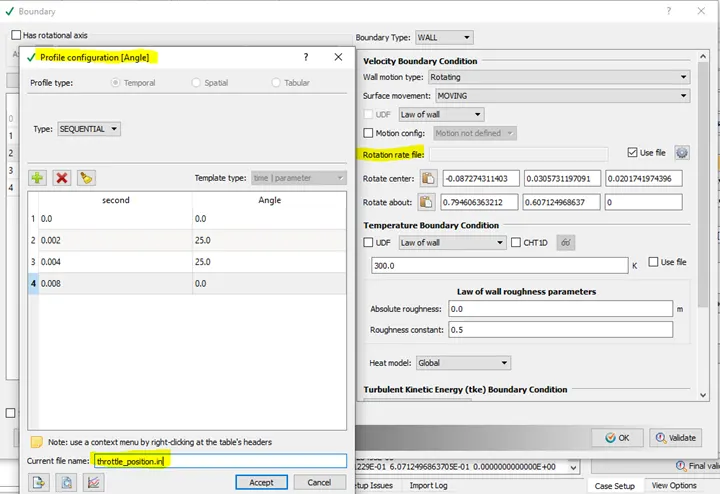
Rotating Axis Coordinates and Setting up Throttle movement:
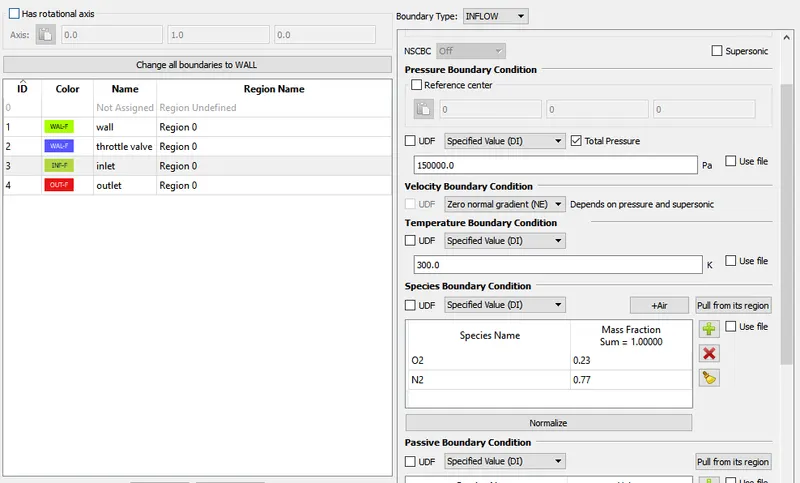
Inlet:
Outlet:
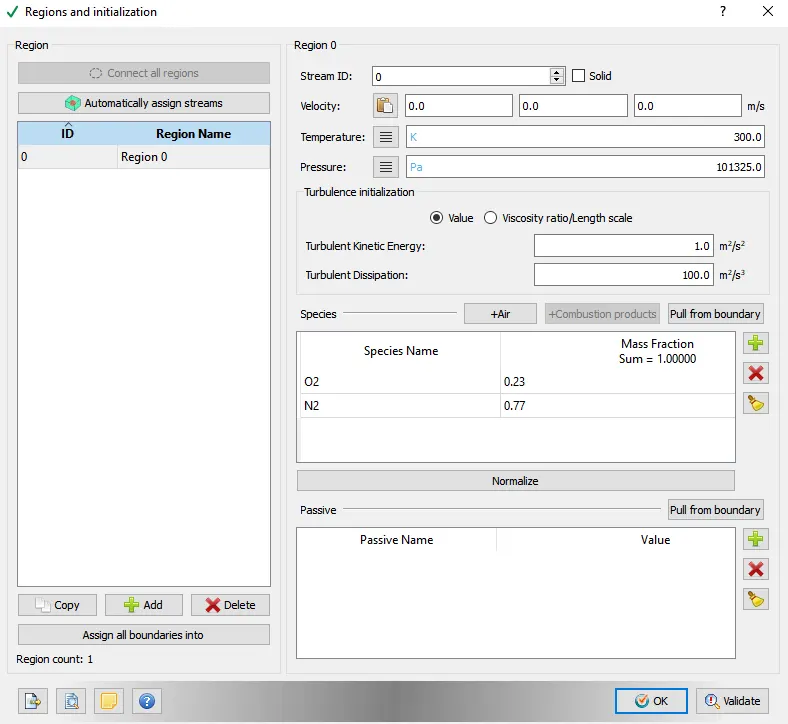
5. REGIONS AND INITIALISATION
Air present at 300K and 101325 Pa
6. GRID Size
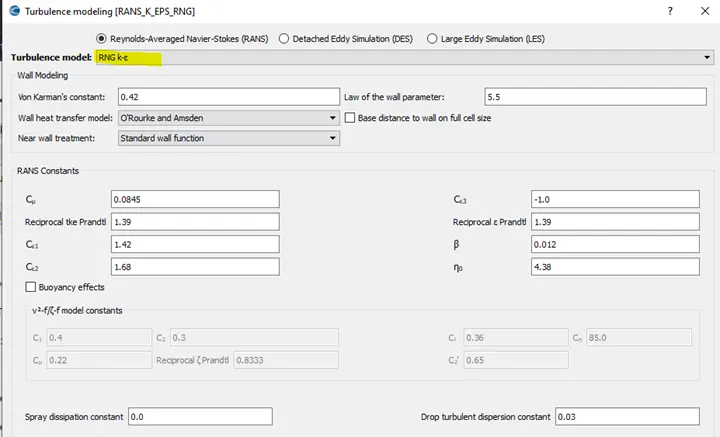
7. TURBULENCE MODELLING
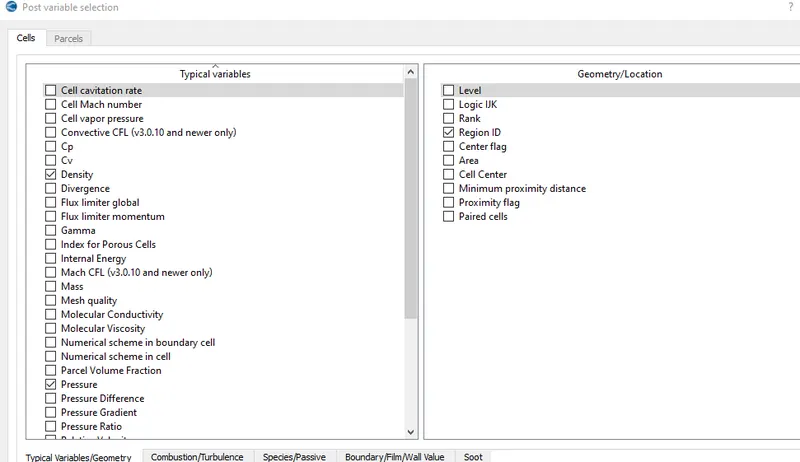
8. POST VARIABLE SELECTION
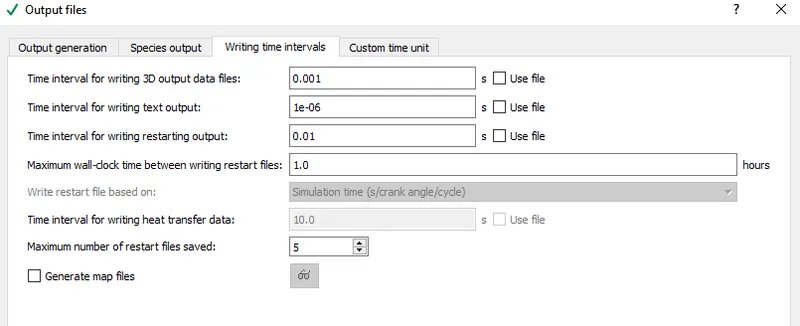
9. OUTPUT FILES
RESULTS AND DISCUSSION
Grid Size
VELOCITY CONTOUR
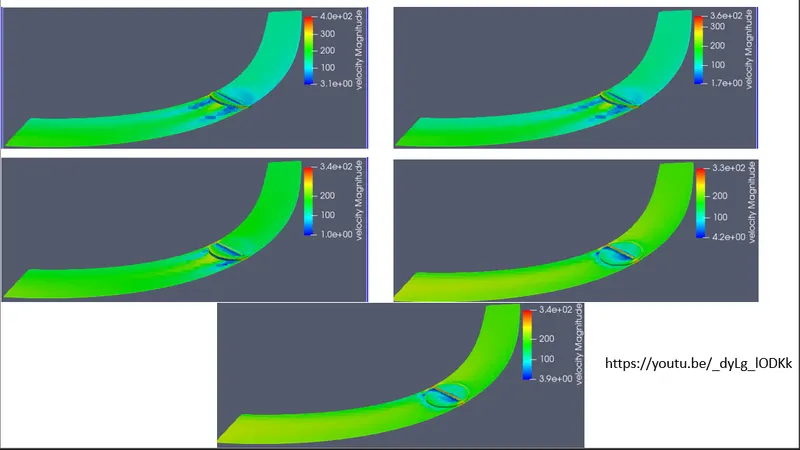
Animation Youtube link:https://youtu.be/_dyLg_lODKk
PRESSURE CONTOUR
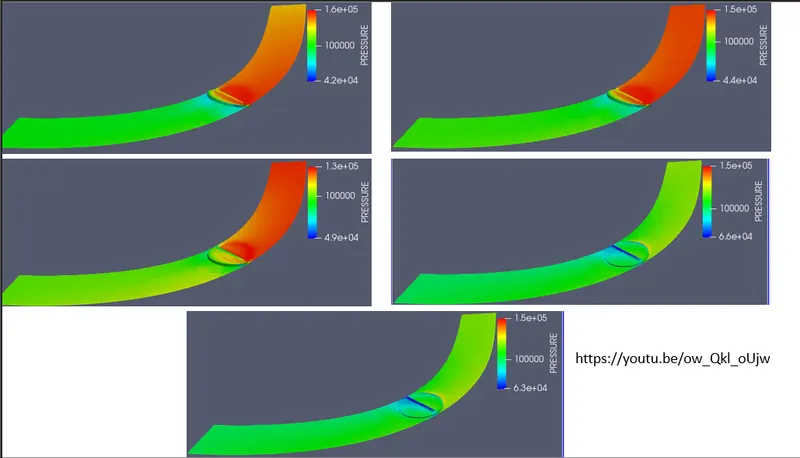
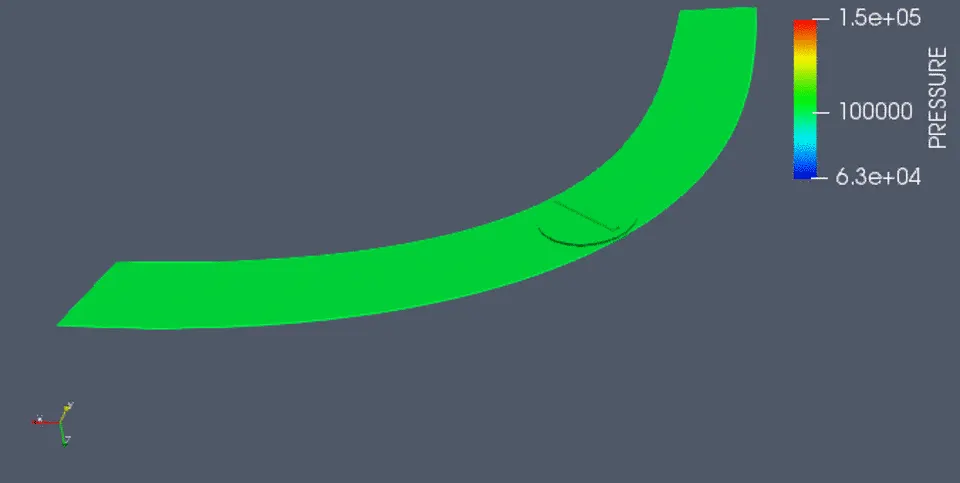
Animation Youtube link: https://youtu.be/ow_Qkl_oUjw
Velocity Vector
Velocity Stream Lines
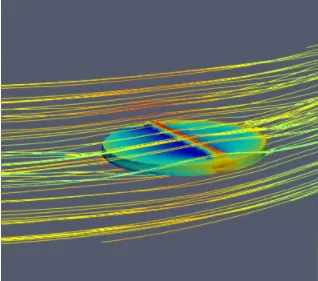
Inference: Streamlines refer to the path taken by particles of fluid under steady flow. If flow lines are curve then the tangent at any point on the curve gives the direction of the fluid velocity at that point.
LINE PLOTS
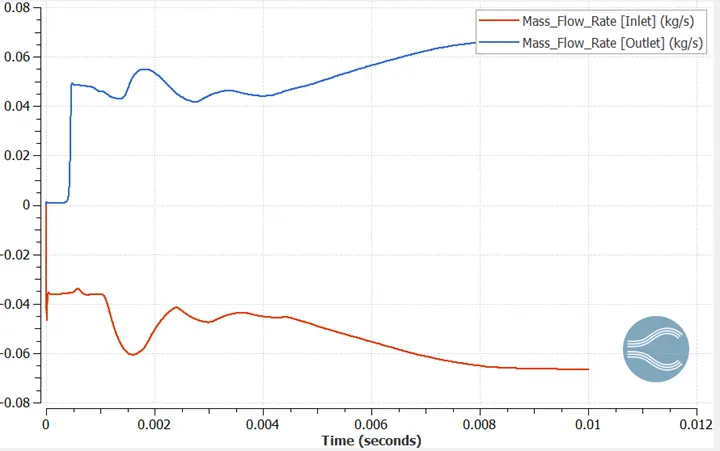
1. Mass Flow Rate
2. Total Pressure
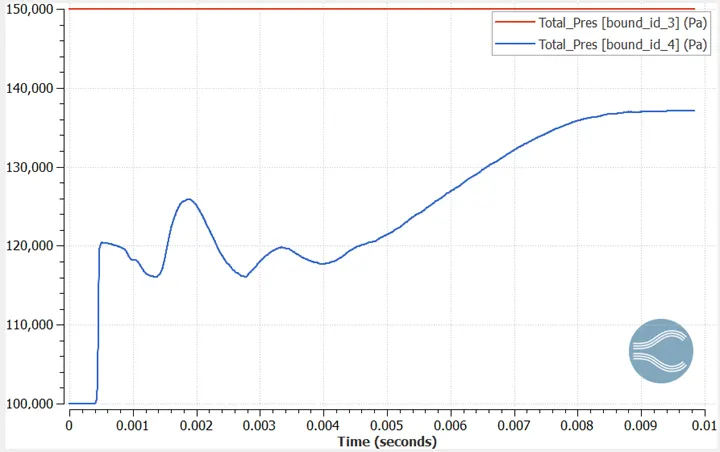
The Total Pressure is the sum of the Static Pressure and the Dynamic Pressure.
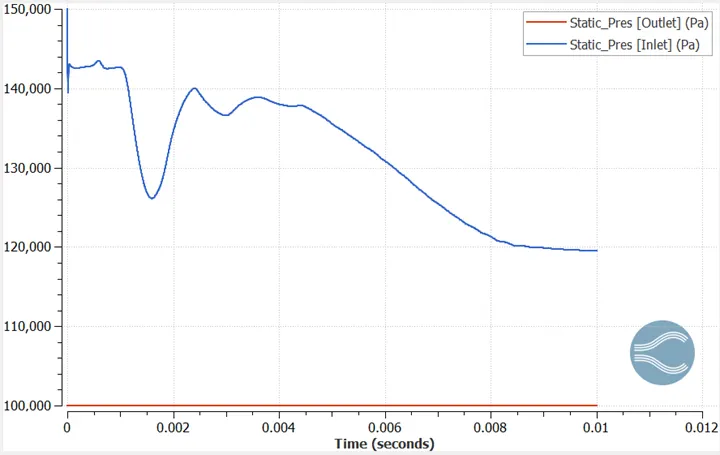
3. Static Pressure
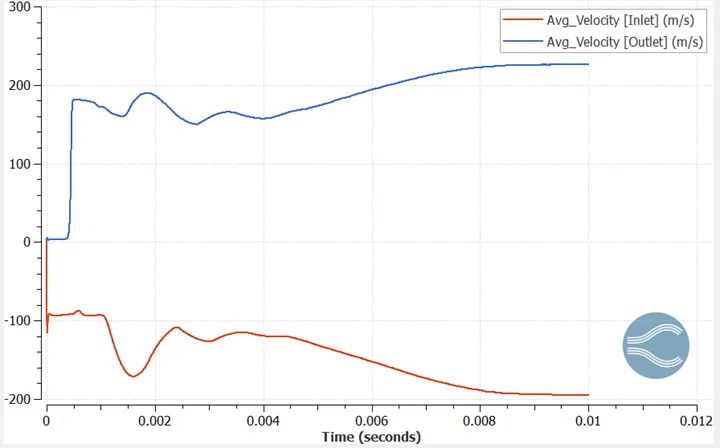
4. Average velocity
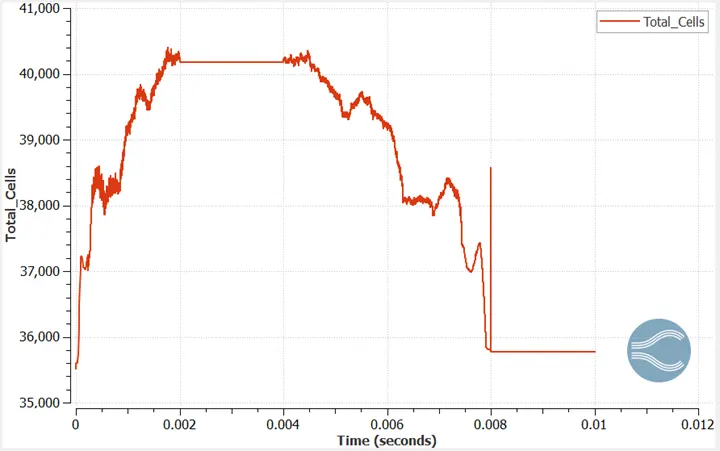
5. Total Cells
Inference:
- Pressure Contour: Pressure is high at the region where the flow hits the throttle valve and Pressure behind the throttle valve is reduced due to the formation of low pressure region or drop in static pressure.
- Velocity Contour: Due to the restriction in flow caused by throttle plate the velocity at the outlet varies ie., when there is less restriction in flow then less energy is lost by the flow particles and velocity at the outlet increases.
- It is envisaged from the plots that as mesh is made finer the valve contour is more explicit and accurate results are observed.
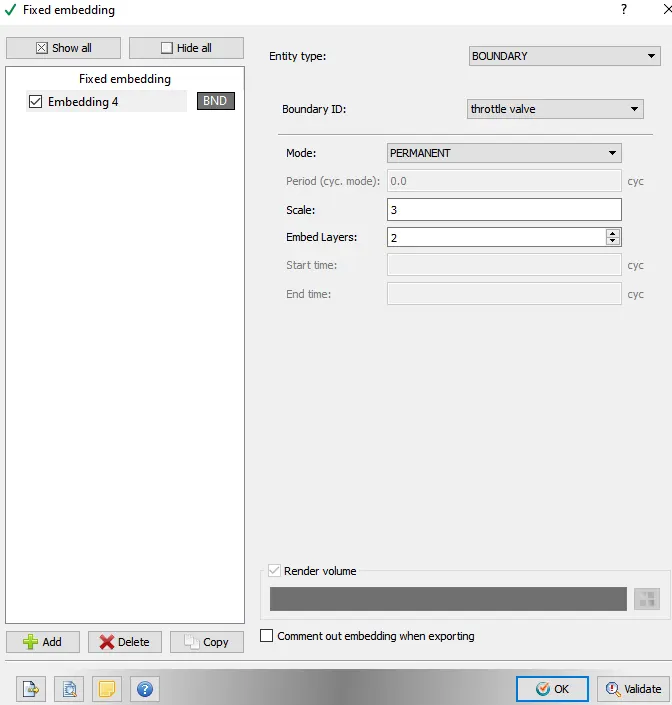
- By using fixed embedding feature the flow over the throttle valve (Embeded layers =2 and Scale=3) is made more accurate due to the refinement of mesh along the throttle position.
- Due to moving mesh the number of total cells are comparatively high w.r.t steady state and thus the compuation time is also high.
CONCLUSION: The transient state simulation of fluid flow over throttle valve using Converge CFD was simulated successfully.