Week 4: Project - Transient simulation of flow over a throttle body
AIM: To Setup and run transient state simulation for flow over a throttle body and Post process the results
Theoritical Background:
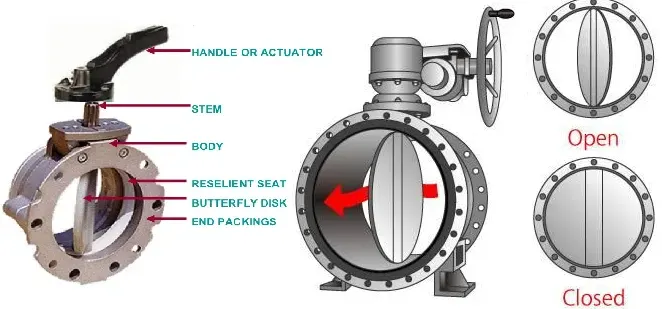
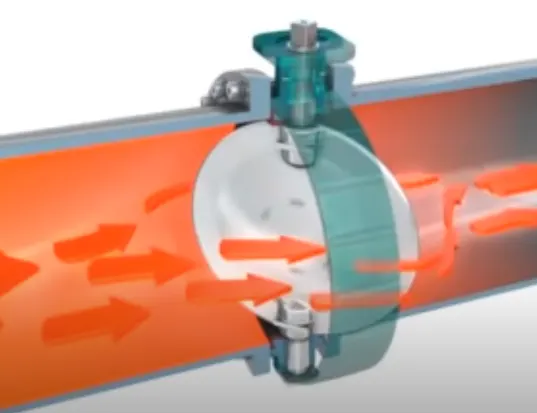
Throttling valves are a type of valve that can be used to start, stop and regulate the flow of fluid through a rotodynamic pump. When the flow of a pump is regulated using a throttling valve, the system curve is changed. The operating point moves to the left on the Pump curve when the flow is decreased
A throttle is the mechanism by which fluid flow is managed by constriction or obstruction. The term throttle refers to any mechanism by which the power or speed of an engine is regulated, such as a car's accelerator pedal.
An engine power can be increased or decreased by the restriction of inlet gases (by the use of a throttle), but usually decreased. Throttle is also called a thrust lever, particularly for jet engine powered aircraft. The throttle pedal or lever acts as a direct linkage. The butterfly valve of the throttle is operated by means of an arm piece, loaded by a spring. This arm is usually directly linked to the accelerator cable, and operates in accordance with the driver, who hits it. The further the pedal is pushed, the wider the throttle valve opens.The throttle body is the part of the air intake system that controls the amount of air flowing into the engine, in response to driver accelerator pedal input in the main. The largest piece inside the throttle body is the throttle plate, which is a butterfly valve that regulates the airflow.
Geometry:
Meshing:
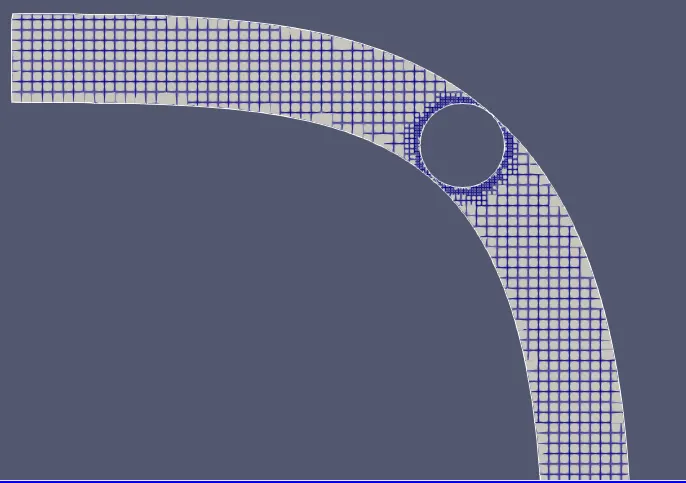

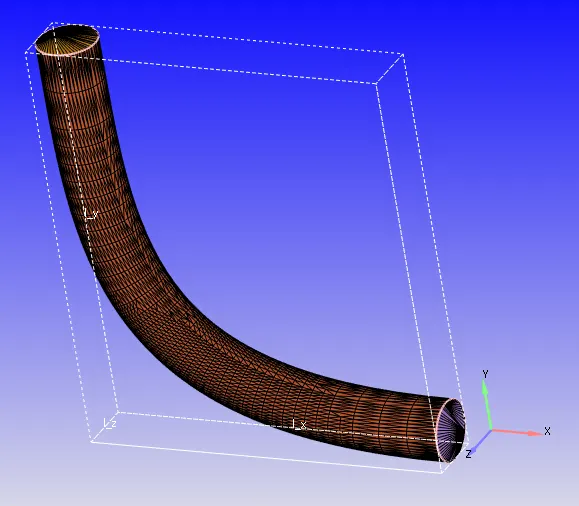
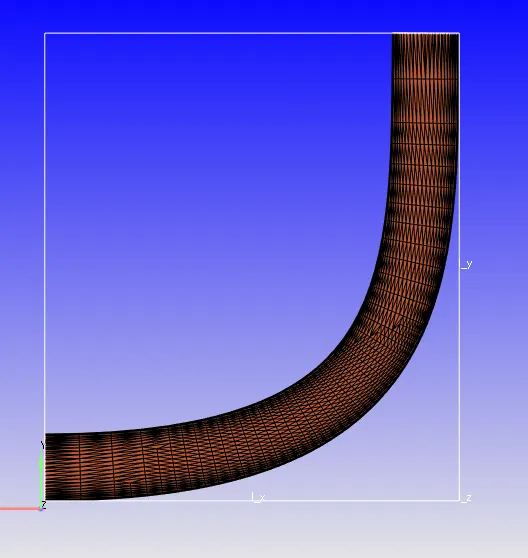
Mesh size is decreased around the throttle, which helps in capturing the results at the boundary of the throttle more accurately and also results in smoothing of the countour around the throttle. This leads to more computational time.
Case Setup:
1. Fluid: Air
Mass fractions of Nitrogen: 0.77, Mass fractions of Oxygen: 0.23
2. Solver: Transient solver is used to simulate the flow.
3. Boundary Conditions:
We have to assign boundary conditions for different faces of Geometry as shown in the table below

4. Regions and Initialization:
Flow region: Volumetric Flow region, Total Pressure: 101325 Pa, Temperature: 300 K, Species : Air
5. Turbulance Model: RNG k-ε.
6. Grid Control: dx=dy=dz=2e-3 m
Fixed embedding - Entity type - Boundary, Boundary ID - Throttle , Mode - Permanent, Scale - 3, Embed layers - 2
7. Rotation rate file:
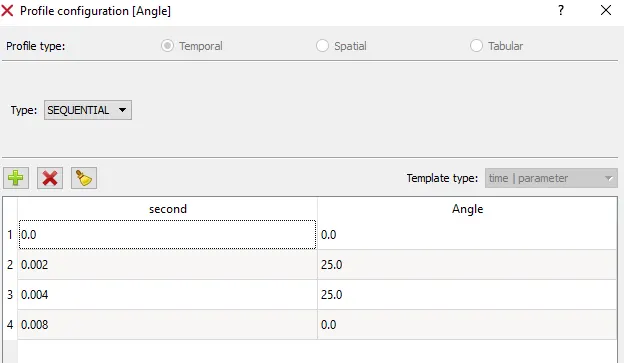
From 0 to 2 ms the valve should rotate by 25 degree
From 2 to 4 ms the valve should stay at 25 degree
After by which 8 ms the valve should get back to its original position
Post Processing:
Mass flow rate(kg/s)
Total Pressure(Pa) and Static Pressure(Pa)
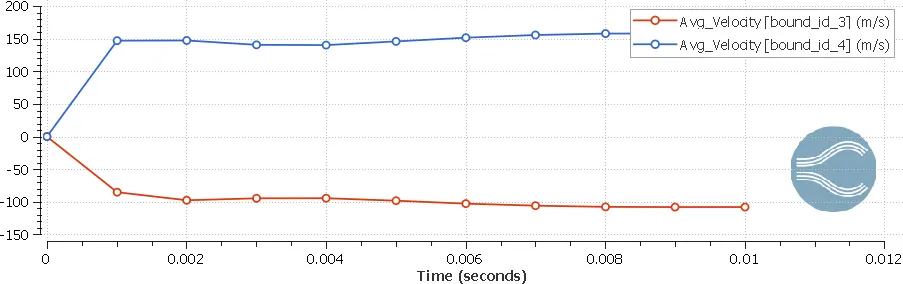
Average Velocity(m/s)
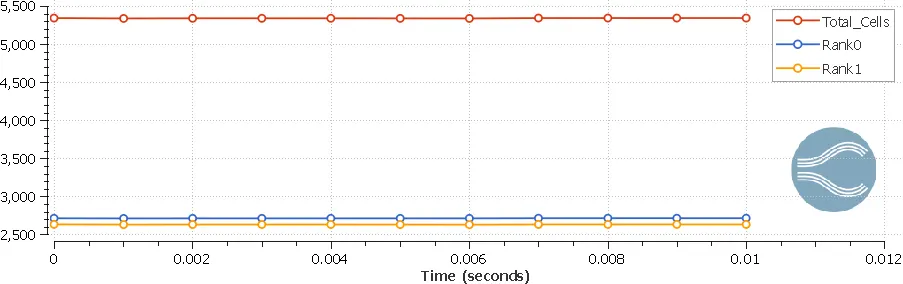
Total Cell count
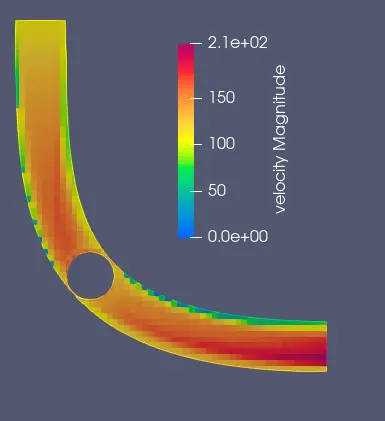
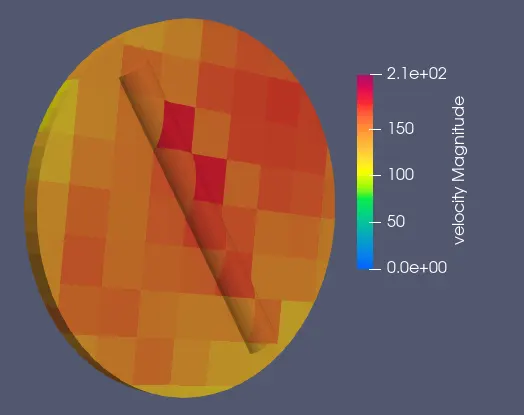
Velocity Contour
When the valve begins to close the velocity of the fluid decreases. This results in sudden increase in the pressure in the region behind the throttle as the kinetic energy gets converted to pressure energy.
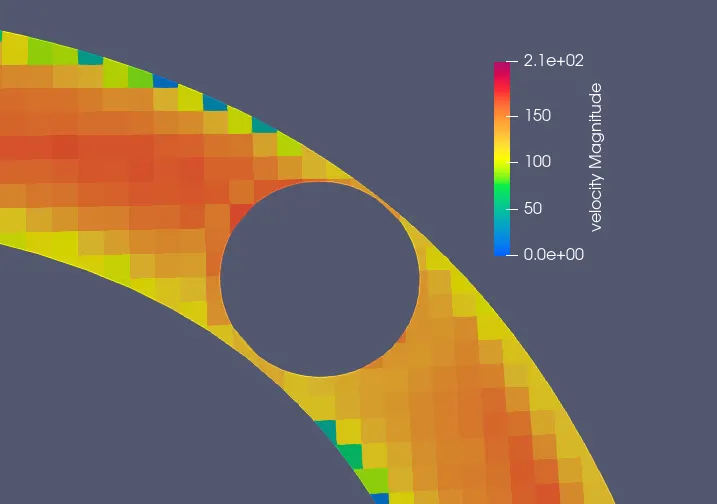
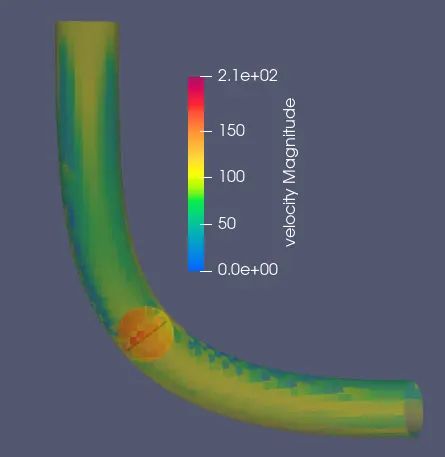
Velocity distribution on the throttle
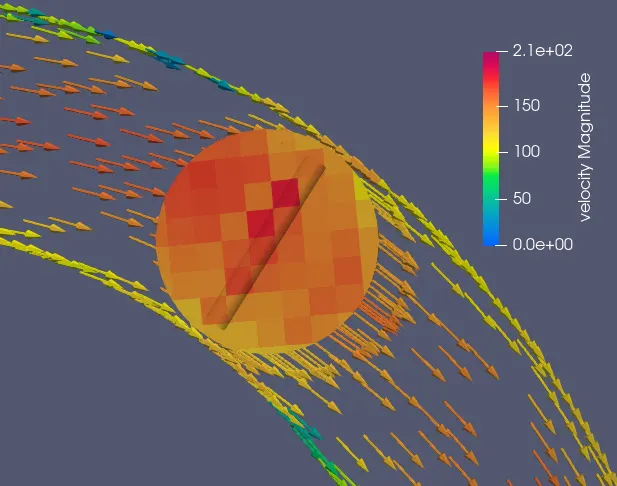
Velocity vector around the throttle
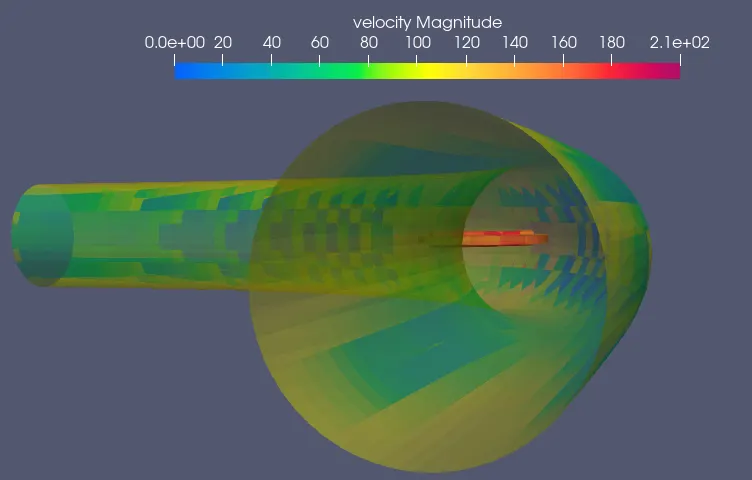
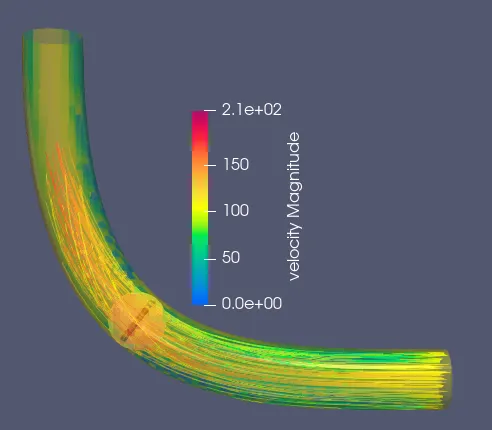
Velocity Streamlines
The velocity streamlines represents the direction in which the fluid element will travel at any point in time. During the small rotation of the throttle valve a lot of disturbances are created which can be analysed by using the streamlines
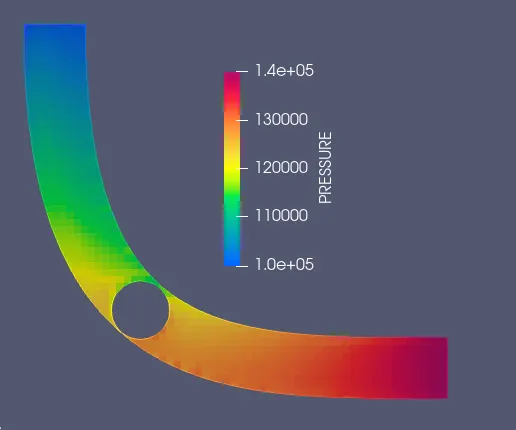
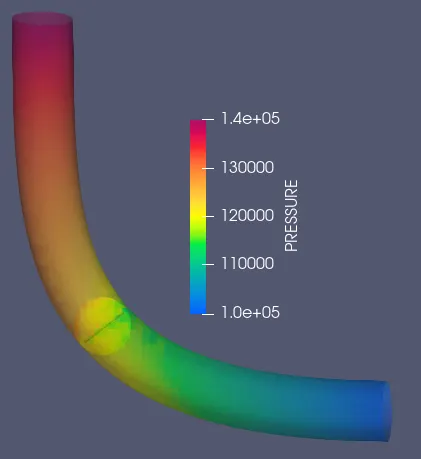
Pressure Contour
Pressure distribution on the throttle
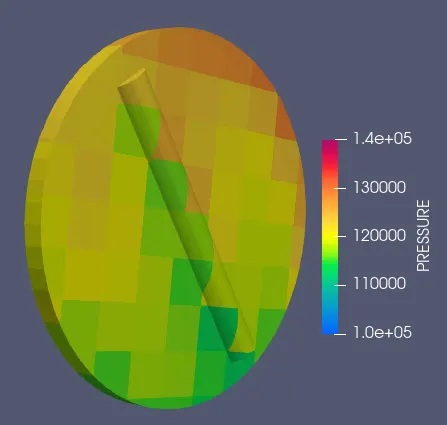
Pressure vector around the throttle
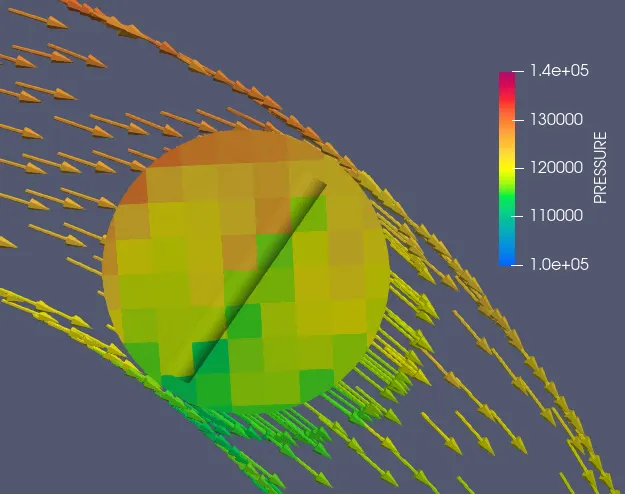
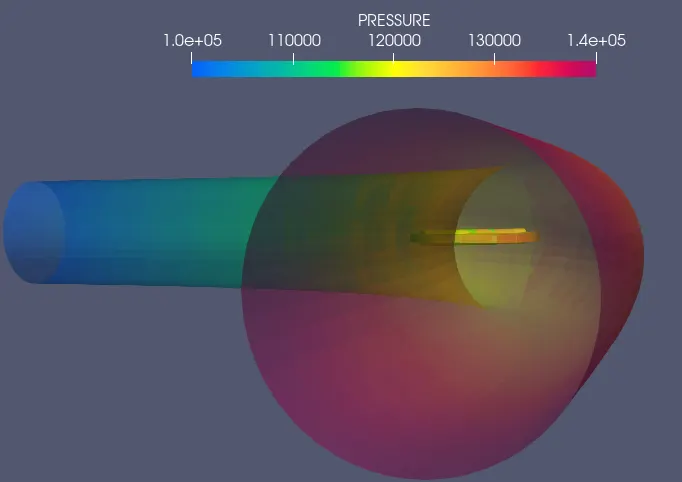
At 0.002s the throttle position is at 25 degrees thus due to the sudden restriction in the flow the velocity decreases. As the flow area is minimized the flow velcoity decreases, but after the flow passes over the throttle the velocity reaches its highest point due to sudden expansion of area. The velocity oscillates at the beggining due to the obstruction in the flow but after that the velocity increases.
Observations:
1] The throttle plate and the throttle shaft provides restriction for the flow of intake air. Lesser is the restriction across the flow, lower is the loss of energy. This increases the velocity at the outlet of the throttle body. Due to the sudden expansion of the area the velocity increases as ther flow passes over the throttle.
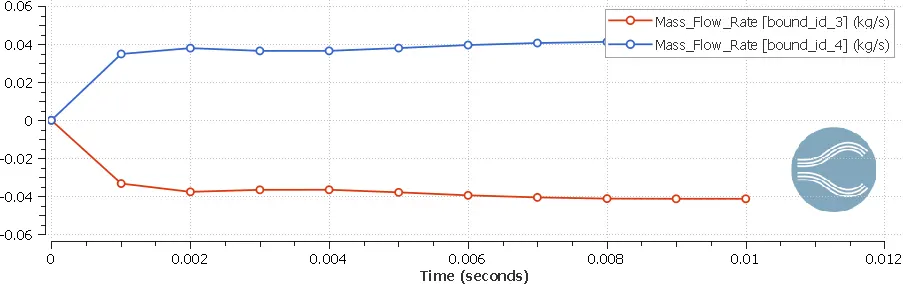
2] The Mass flow rate takes turbulance initially and converges over the period. The Inflow mass flow rate is balanced with the outflow mass flow rate following the law of conservation of Energy. From 0.002 to 0.004 seconds the fluctuation decreases and after 8 miliseconds the mass flow rate converges.
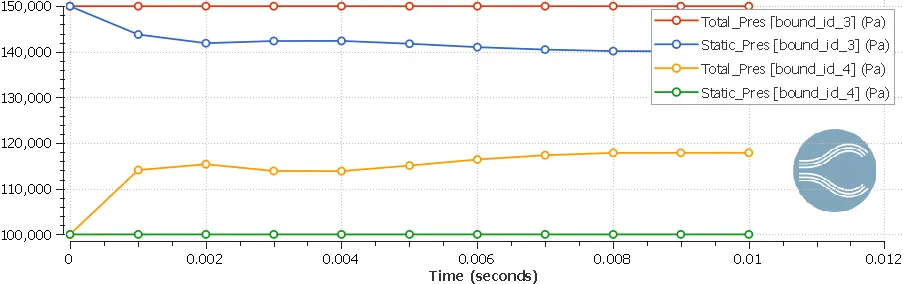
3] The Static pressure at the Inlet region drops due to increase in velocity and gets stable as the simulation proceeds. The total pressure increases at the outlet region and converges over a period of time.
4] Flow control and throttle movement can be easily understood by analysing the behaviour of fluids.