Week - 4 - crash box simulation
TITLE: CRASH BOX SIMULATION USING LSDYNA
OBJECTIVE: TO CREATE A RIGID WALL AND PERFORM A CRASH BOX SIMULATION USING LS DYNA.
- At first I opened the mesed model of box in LS prepost and then look for part card and rename ita s box.
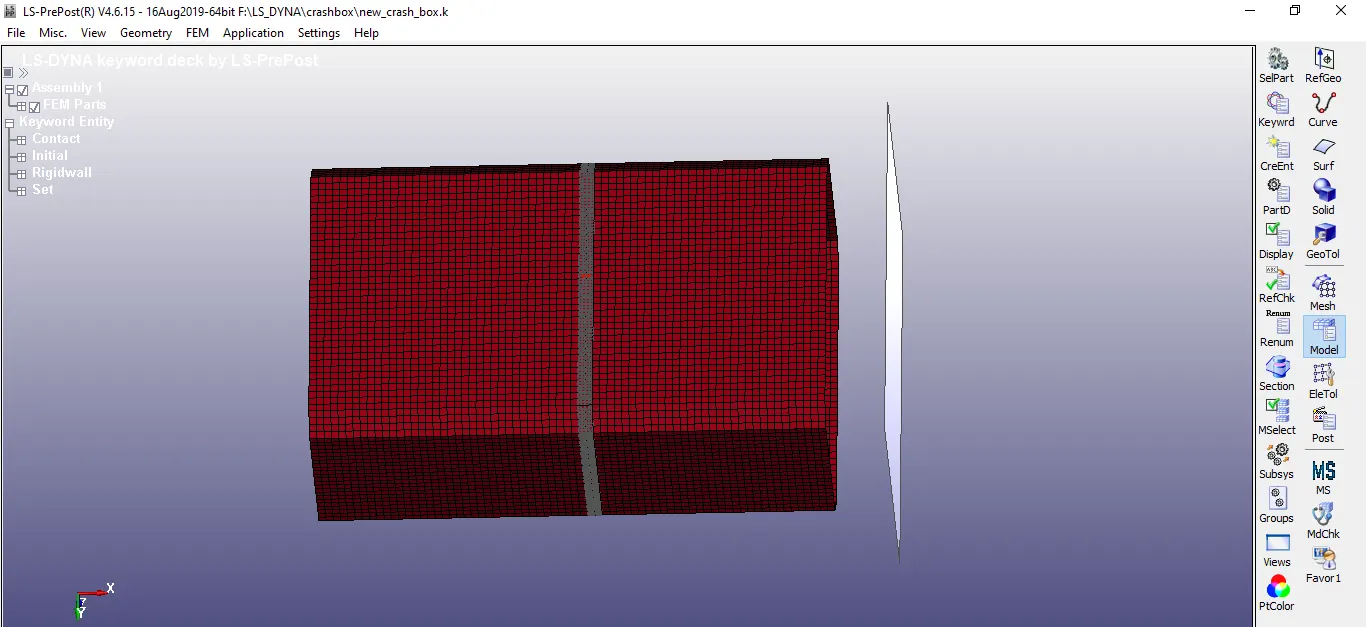
- Then I create a rigid wall using create option then rigid and 1+N option from the box.
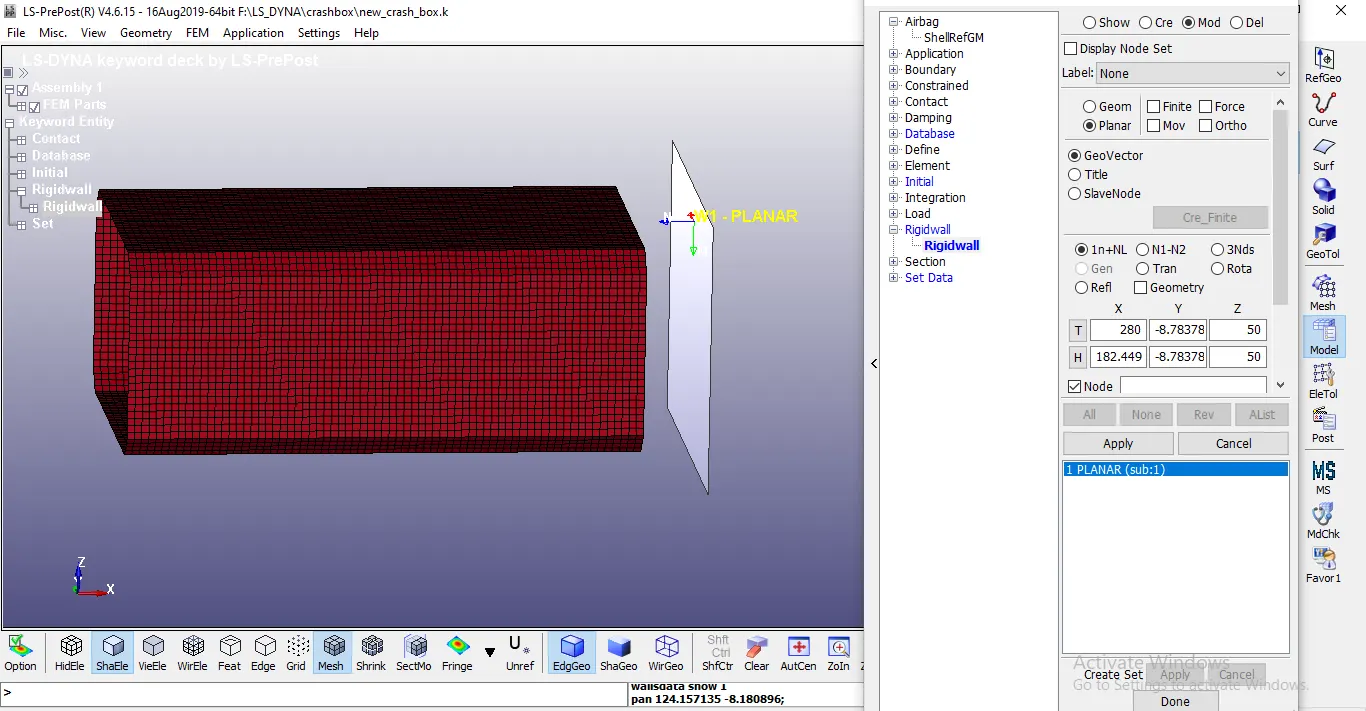
- After creating wall,now I assign material and section to the box part.
- Material used here is matwise linear plastic(024) and properties of steel are used.
- Section Shell is created with ELFORM2.
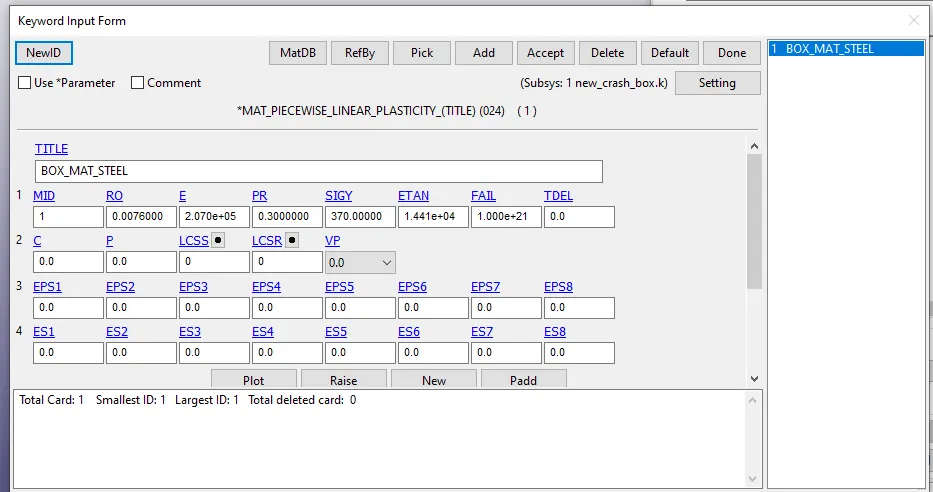
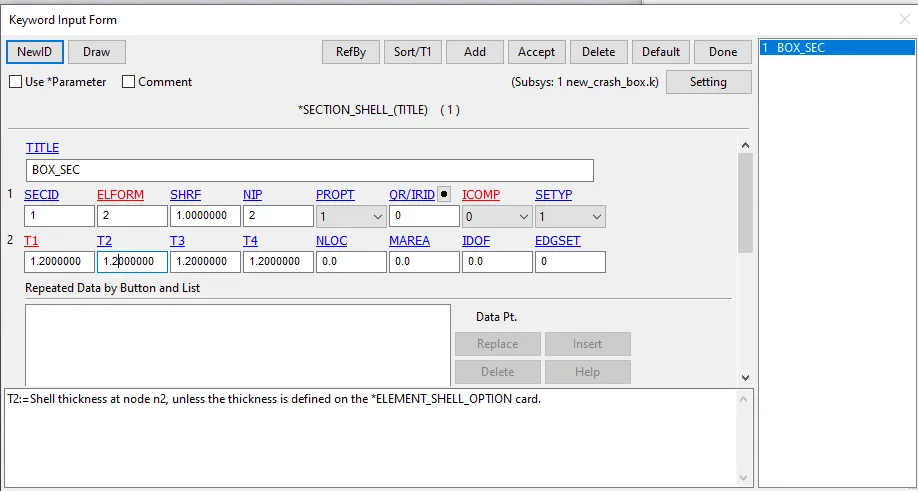
- After creating section and shell,Its time to define them in part id.
- After assigning them in part ID,Boundary card is used to create boundary condition where initial velocity is applied to the box as 50kmph i.e 13.889mm/ms.
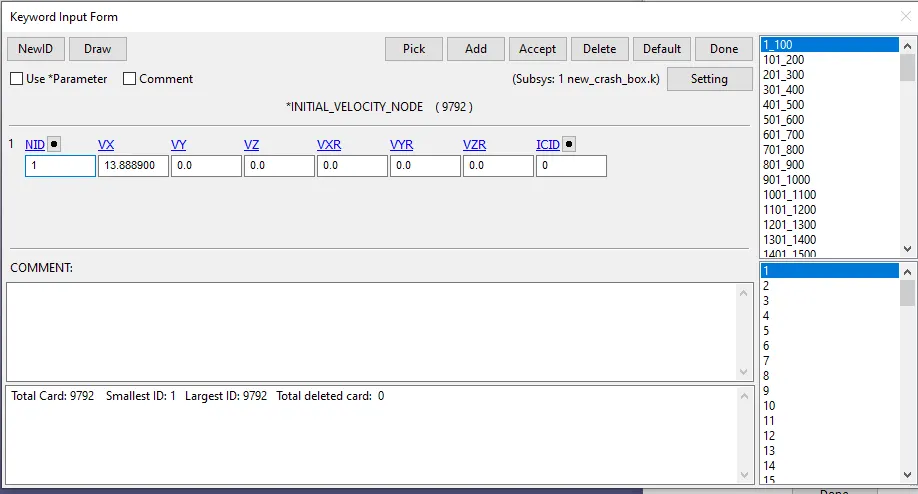
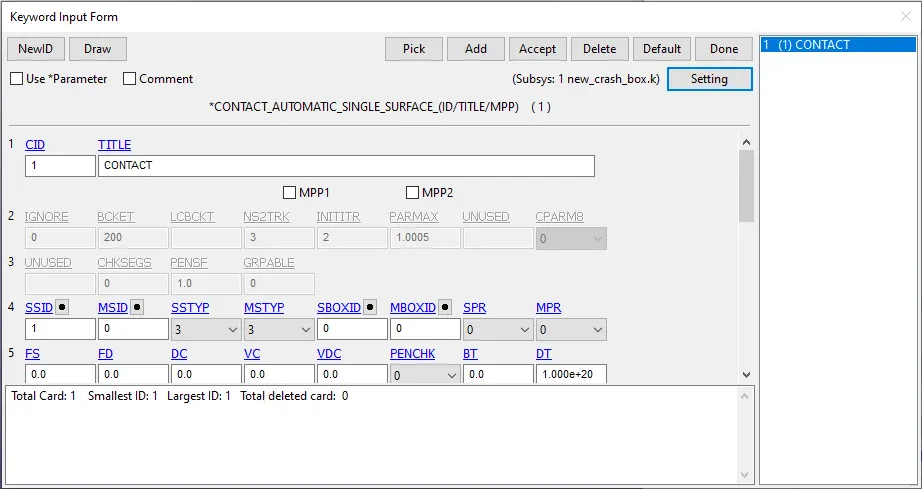
- After defining the boundary condition its time to define the contact.As the box will collide and bounce back therefore automatic single surface contact is given in contact defination.
- Now as contacts are also defined.I look for defining the control cards.
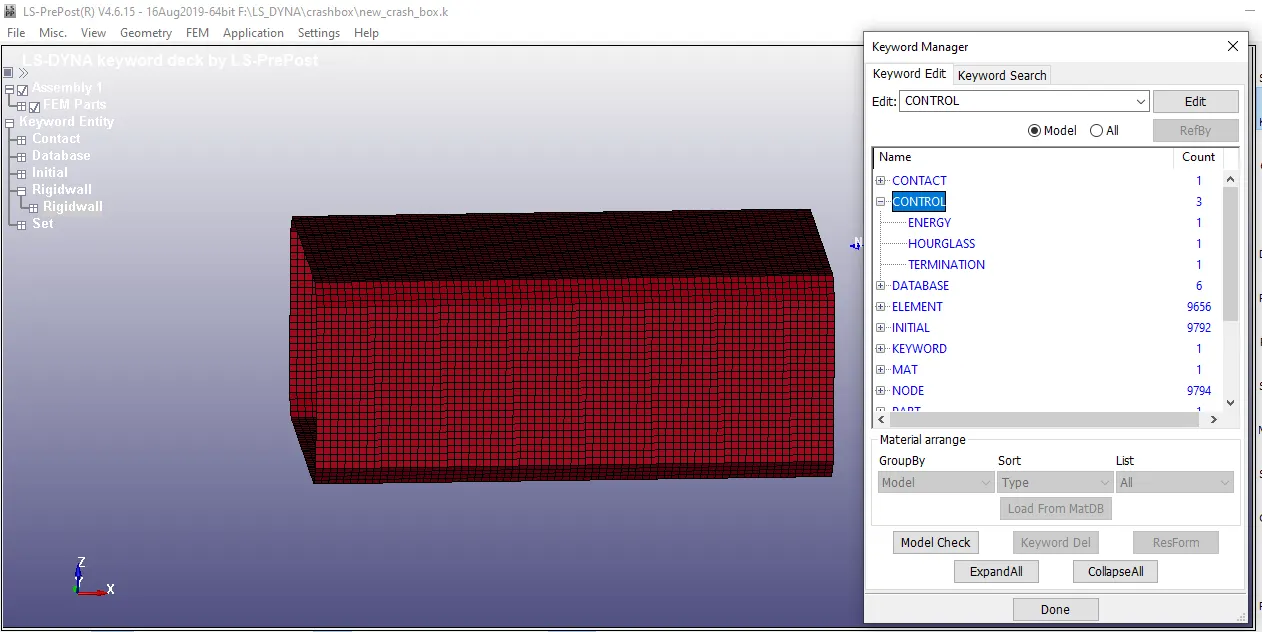
- Here three control cards are given,those are termination,hourglass and energy.
- All the default statndard values are used for in the control card.
- Control termination time is used is 3ms.
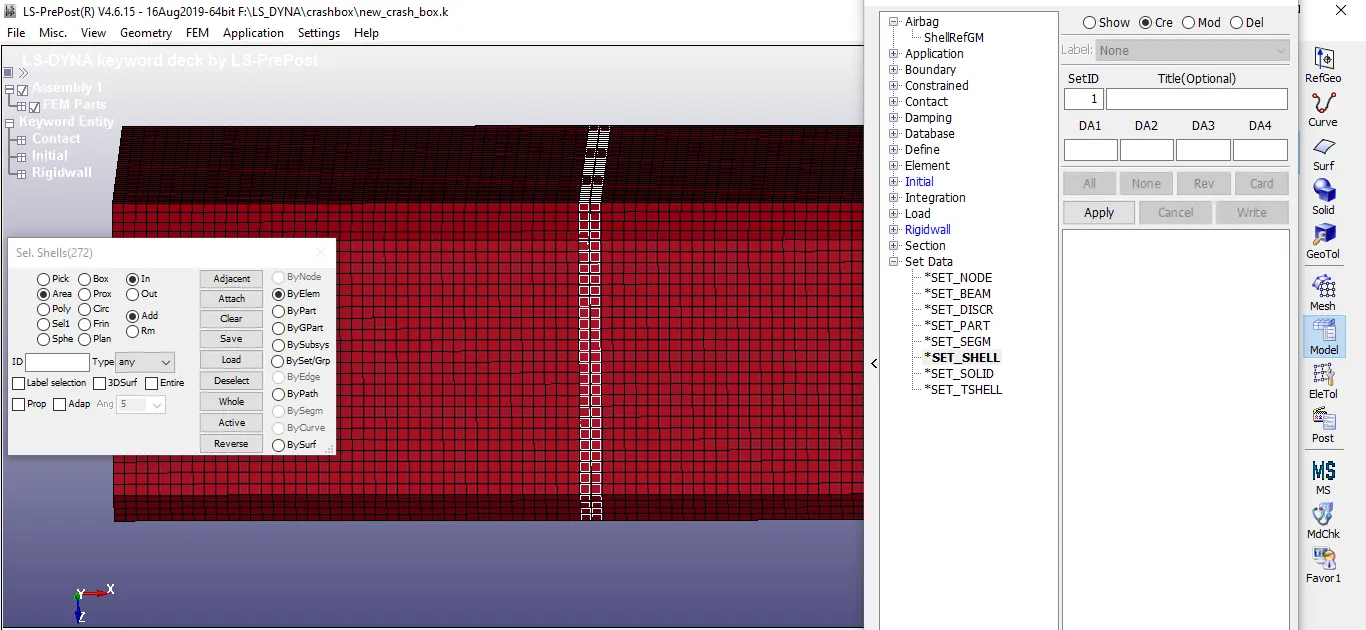
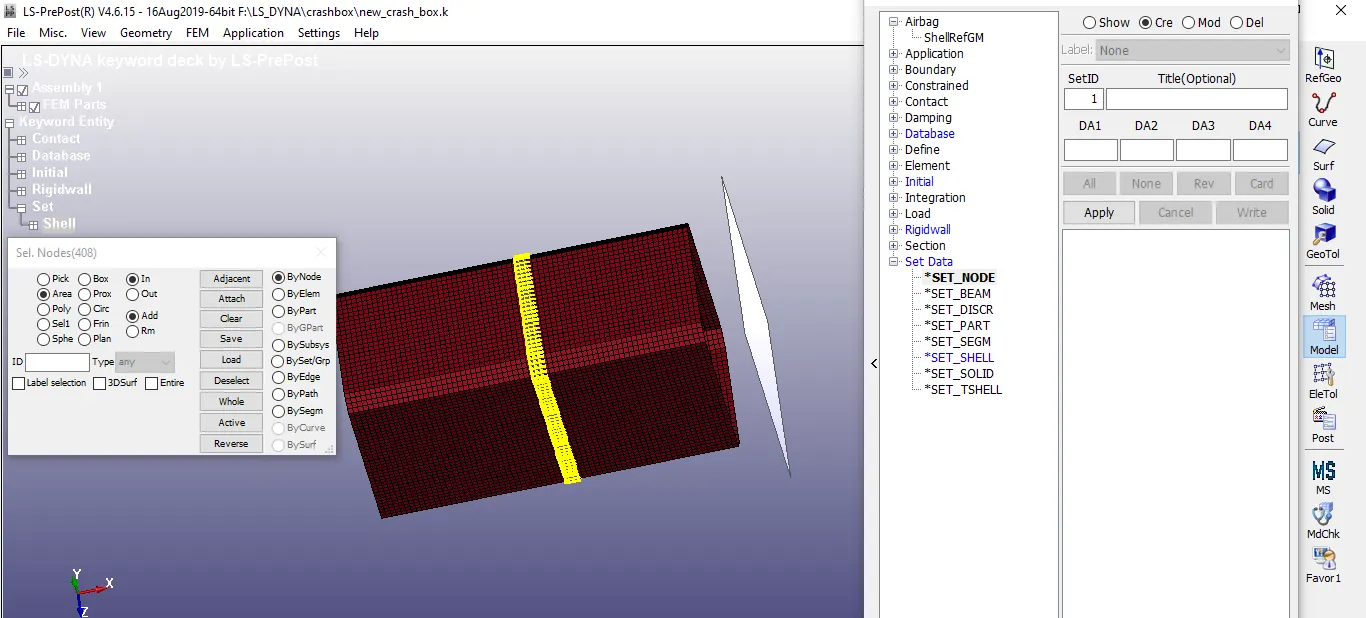
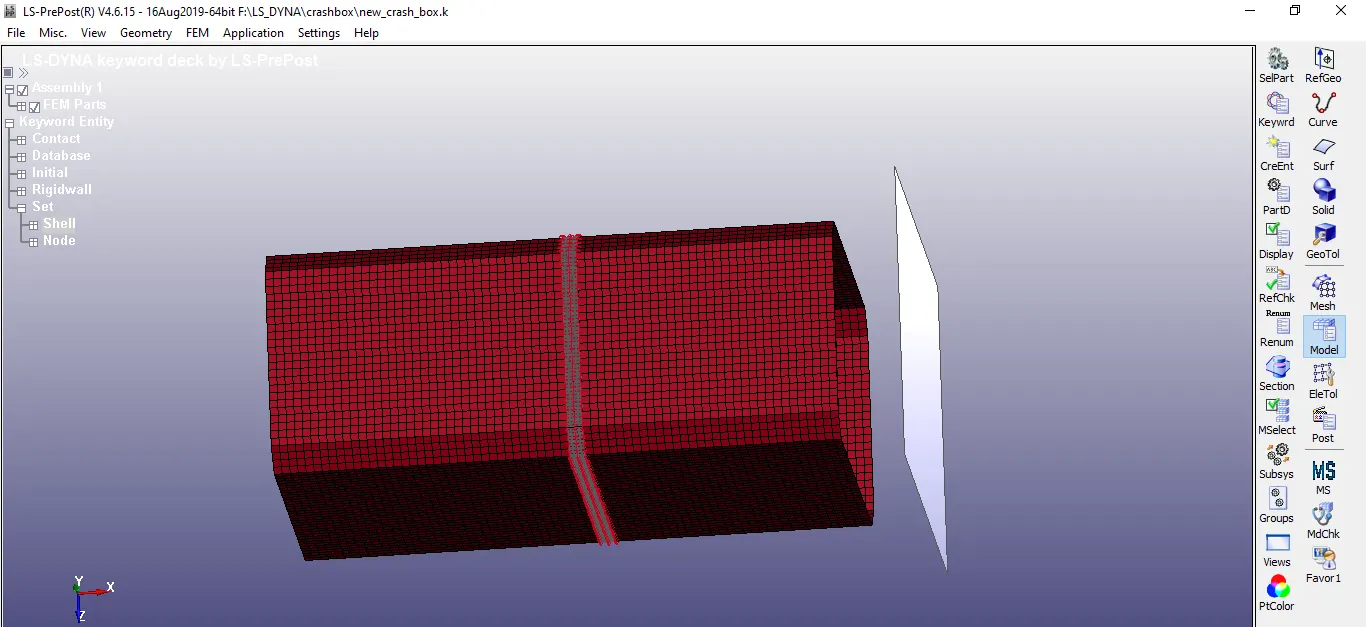
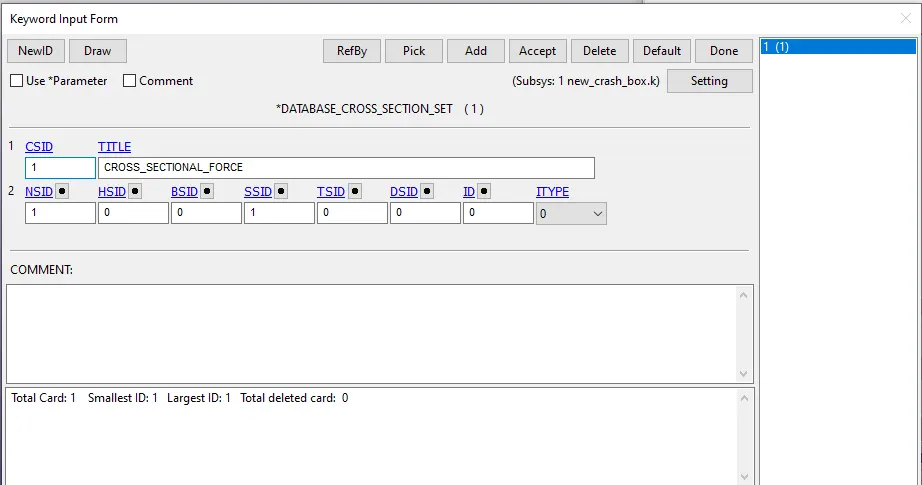
- Now I define the final output cards, as section force is needed in the middle of the therefore I need to define the set of nodes and elements to define the cross section card.
- The define the set of nodes and elements create option is used there set is used.
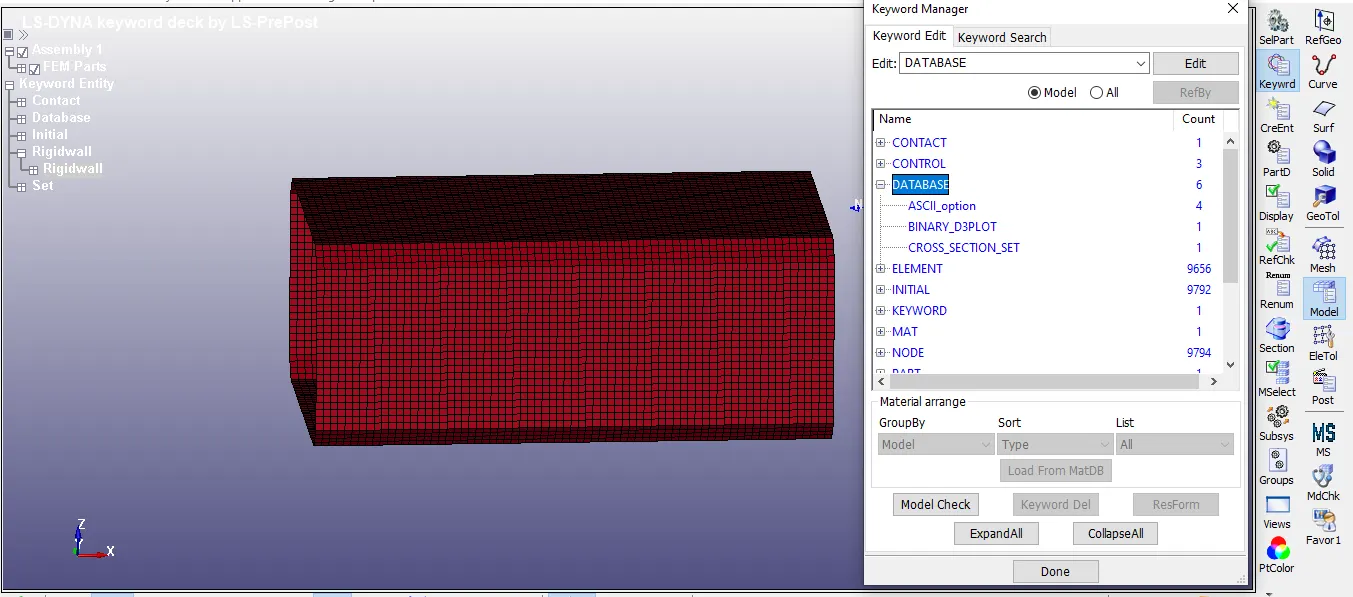
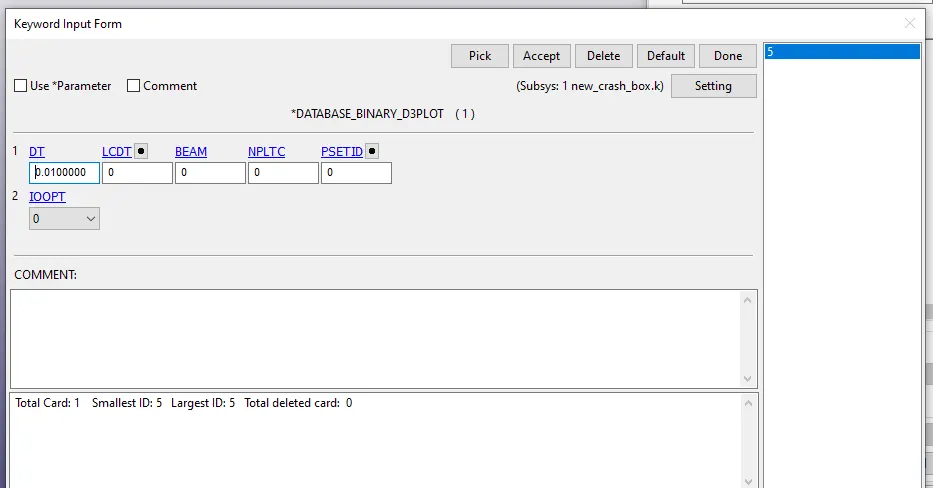
- Now I define the data base cards.
- Those are ASCII,D3PLOT,CROSS SECTION FORCE
- In ASCII card glsat,sleout,rcforc and sec force is defined.
RESULTS:
- FOR T = 1.2mm
- Stress contour
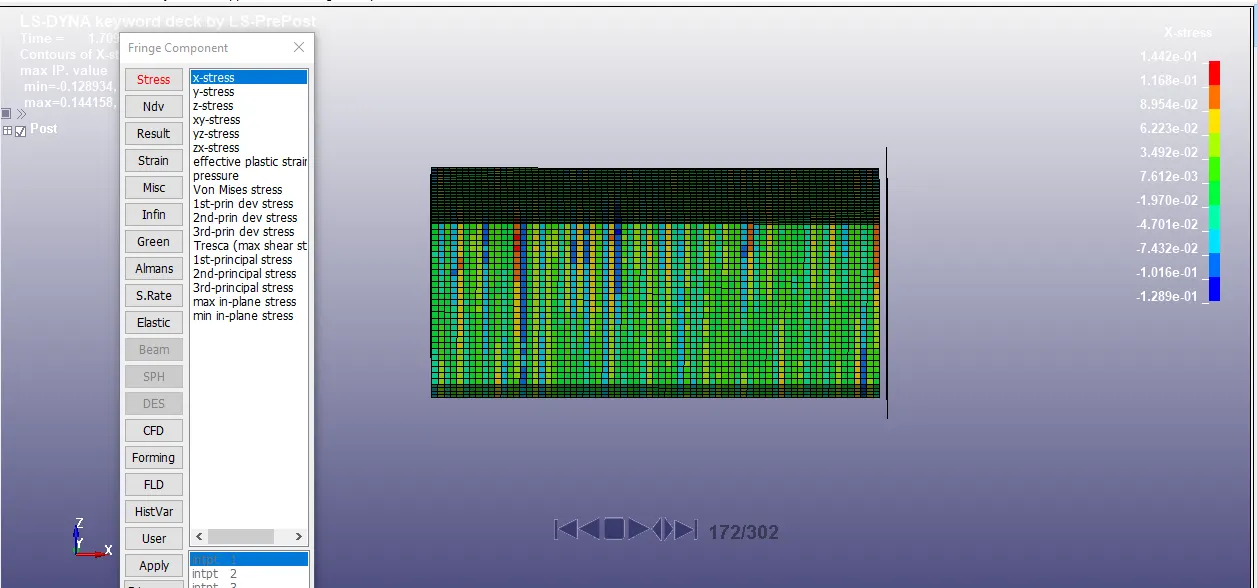
Stress = 1.44e-1
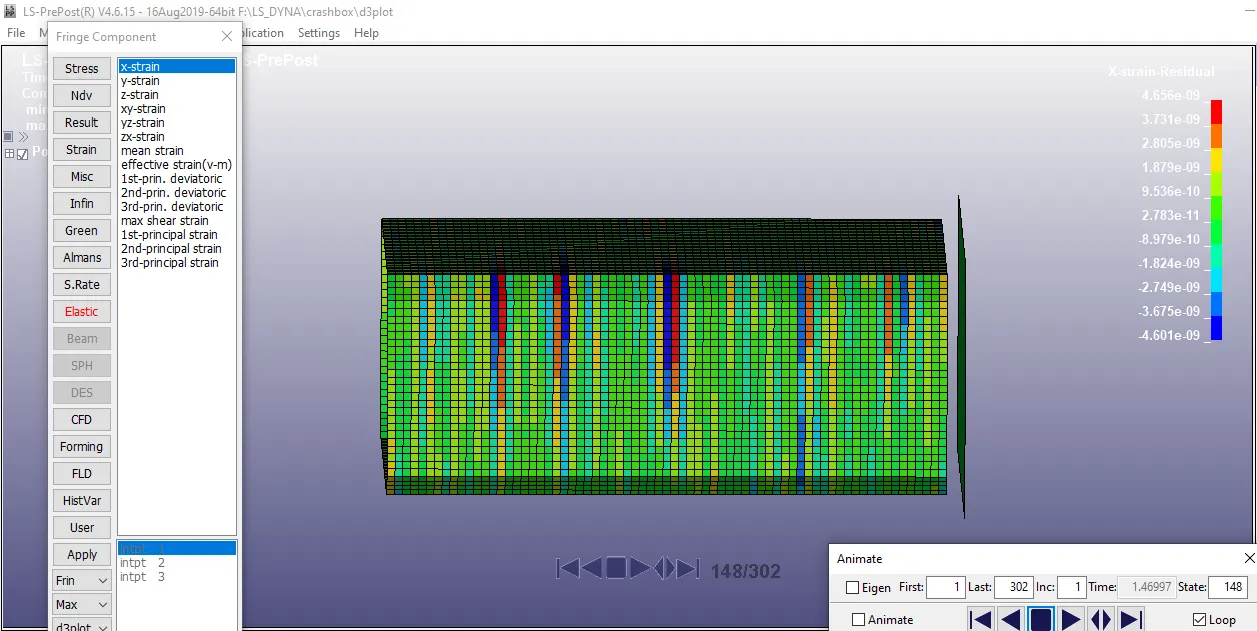
- Strain contour
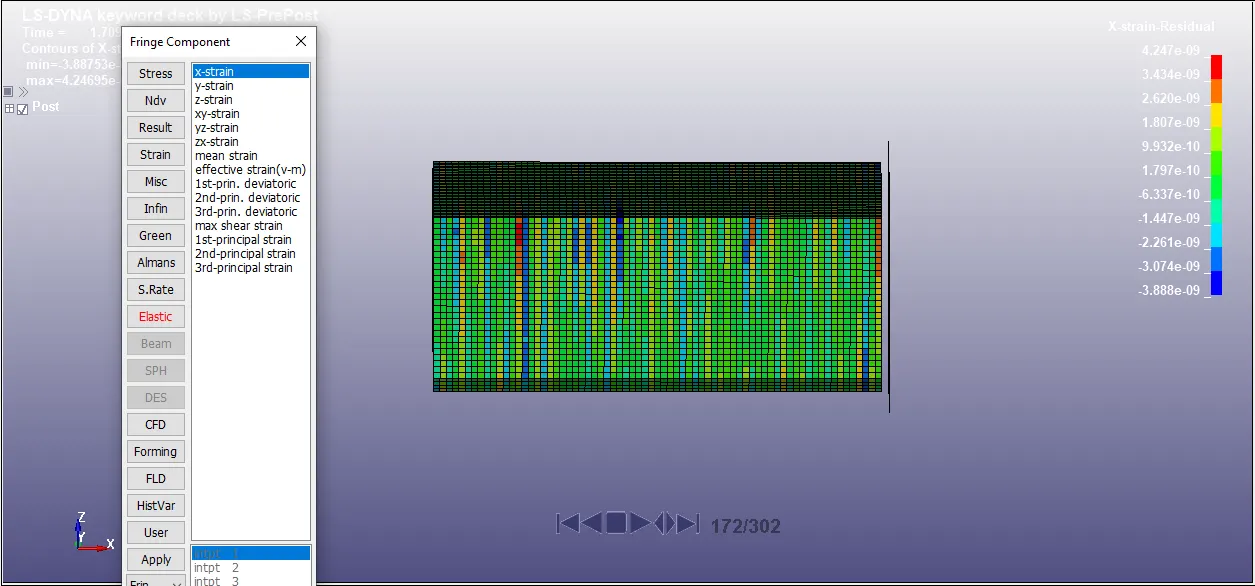
Strain = 4.27e-09
- SECTIONAL FORCE ALONG LENGTH (T = 1.2mm)
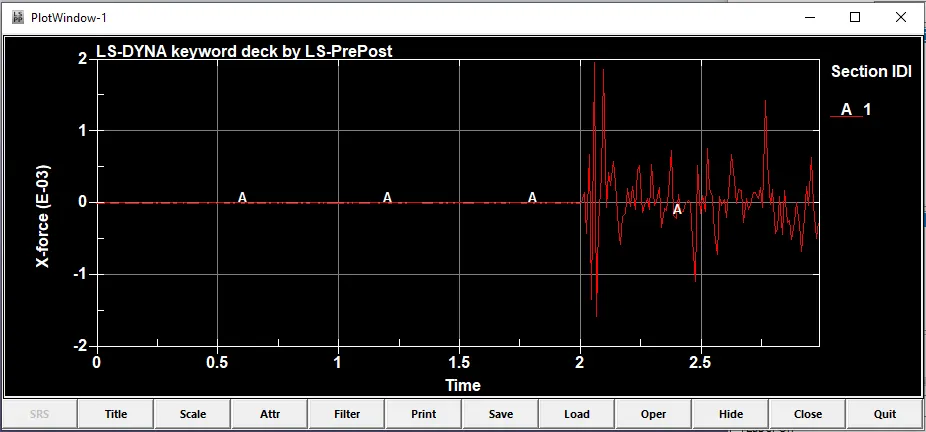
In this curve it seen the curve is very noise after 2ms when the box section collide with the wall.Where as maximum force is seen to happen around 2.1ms.
- Energy plots.
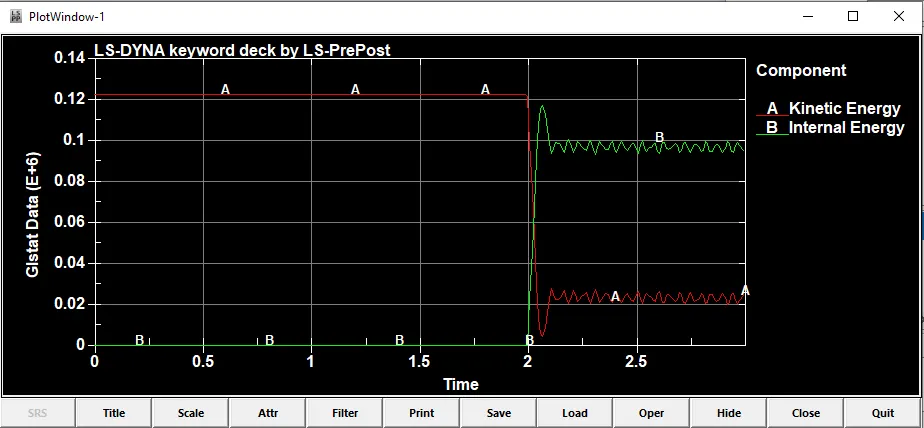
Here the plot justifies the crash situation,as internal engergy increases then kinetic energy decreases .
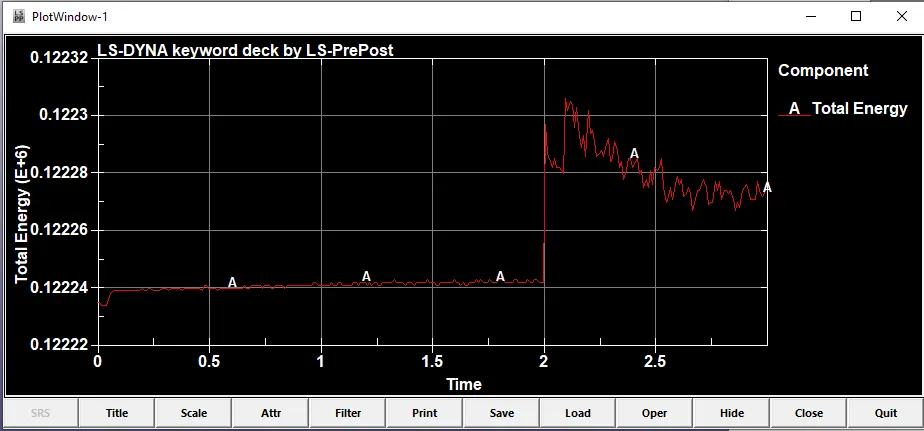
Total energy increases after crash in 2ms.
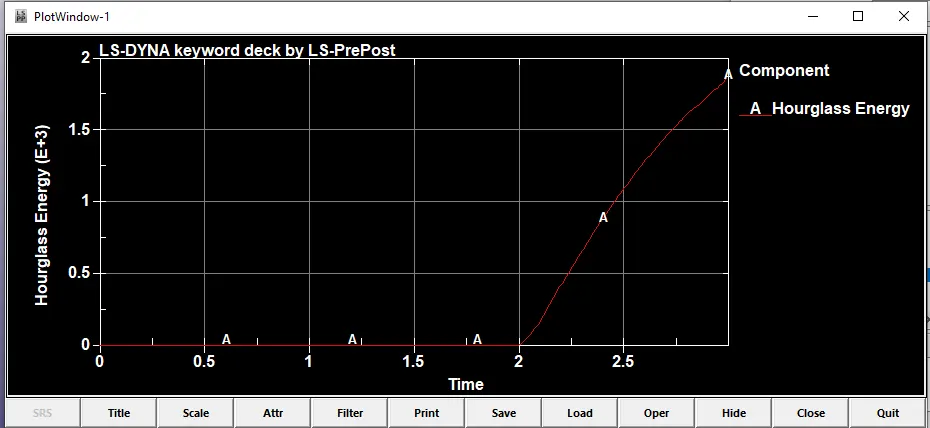
There is sudden rise in the hourglass energy seen after 2ms.
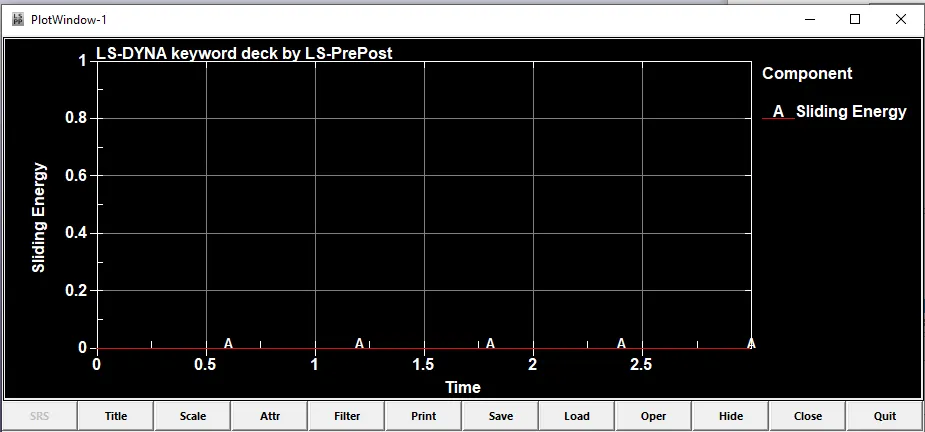
Sliding energy seems to be flat in this experiment.
- DIRECTINONAL STRESS
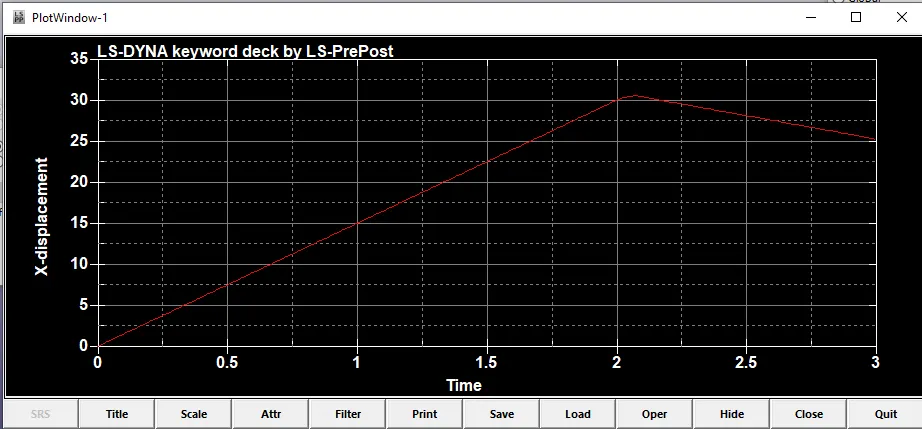
Here is seen to ncreasing gradually from begining and the after 2.1ms it goes decreasing
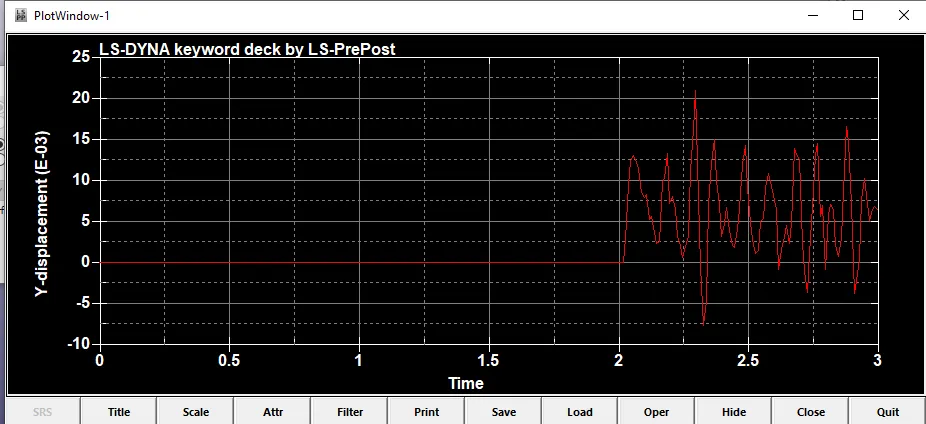
After 2ms its flucuating.
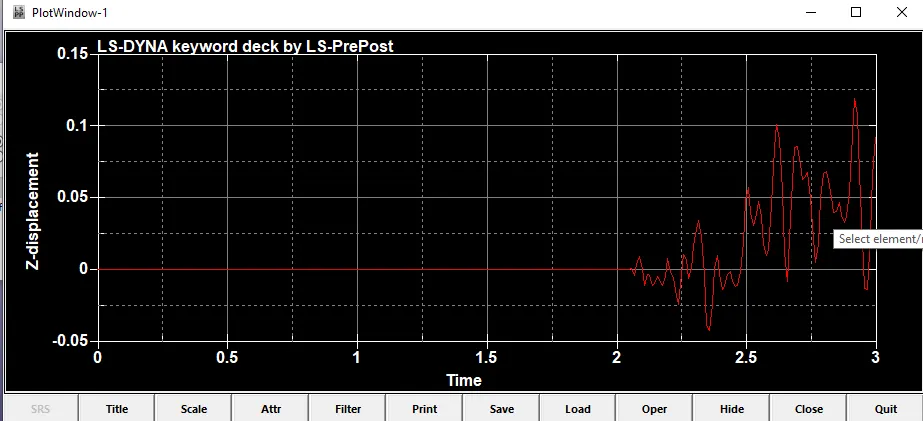
After 2.2ms its flucuating.
2) T = 1.5mm
- Energy plot
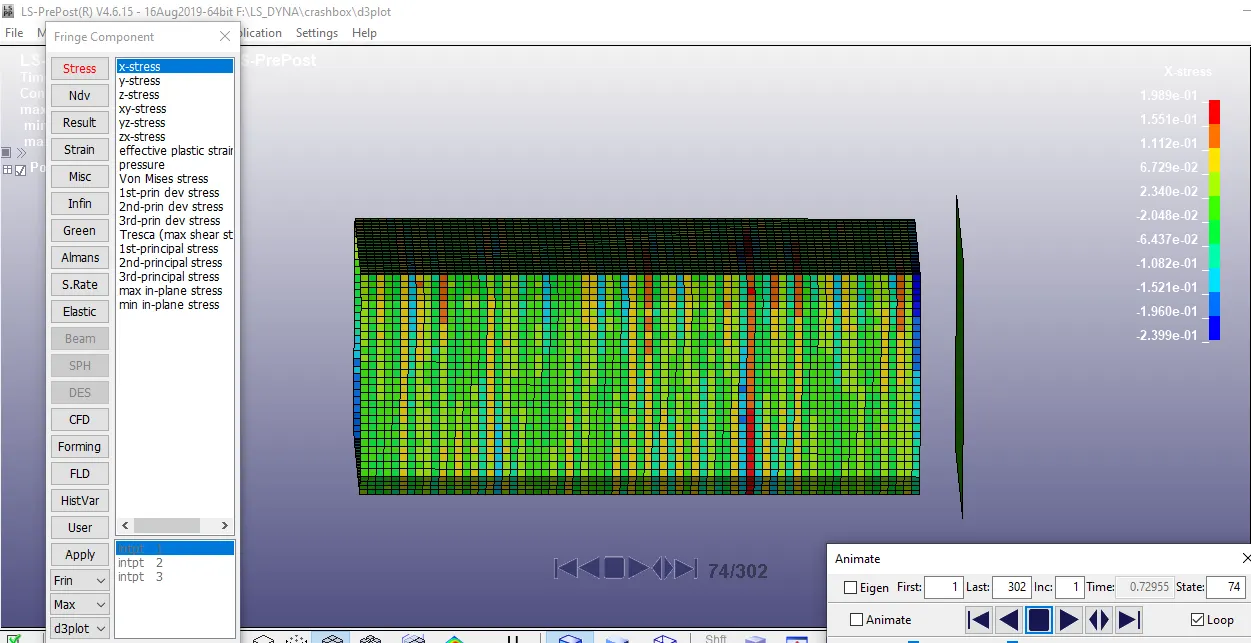
- SECTION FORCE
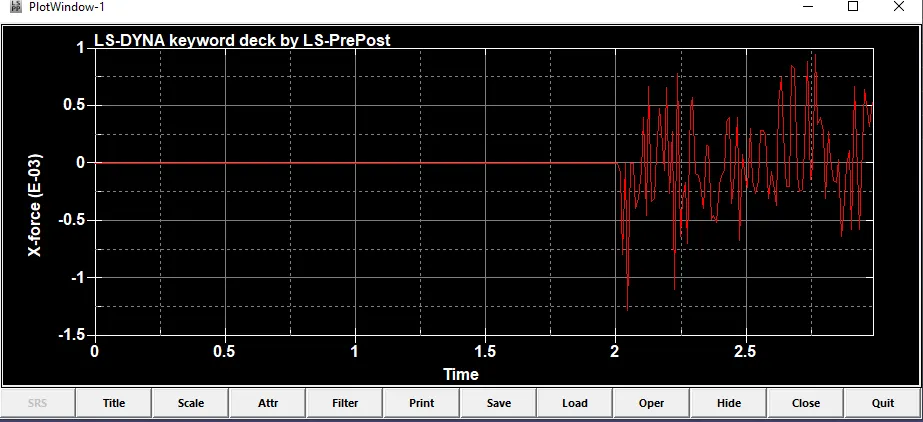
Here the graph is flucuating after 2ms of time i.e after 2ms the box crashes to the wall.
- Enegry plots
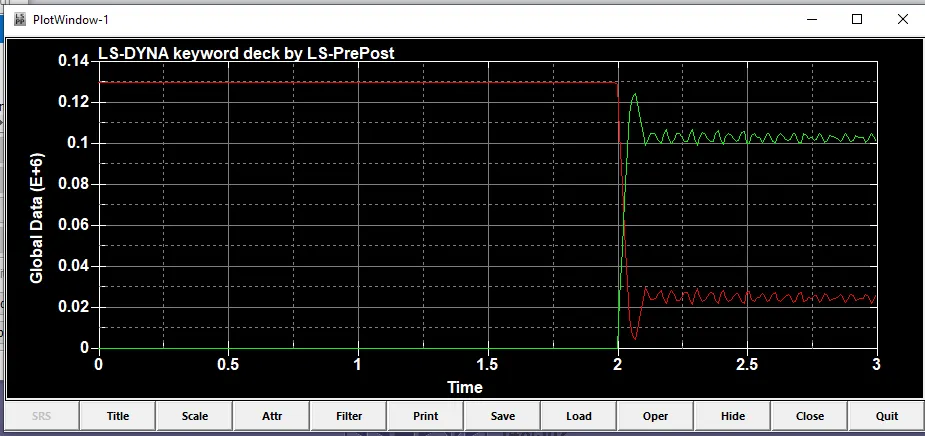
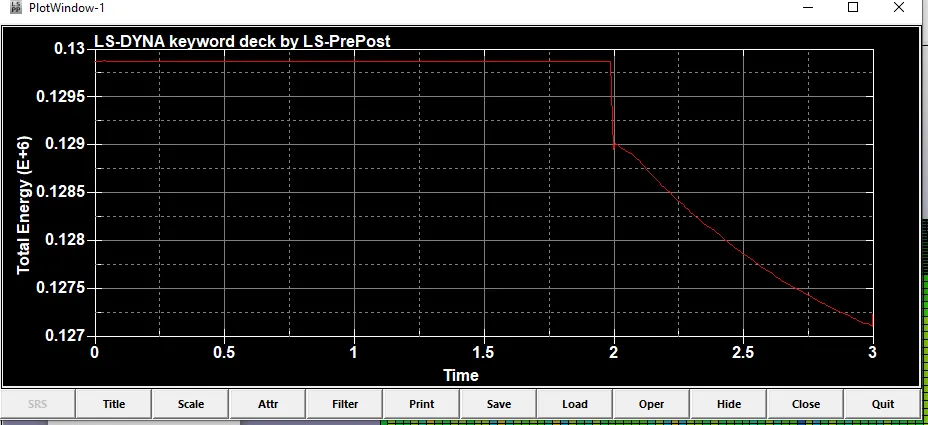
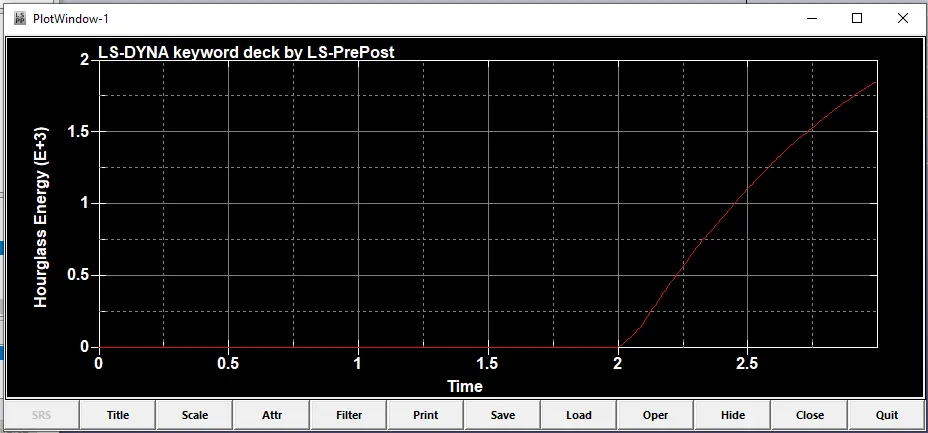
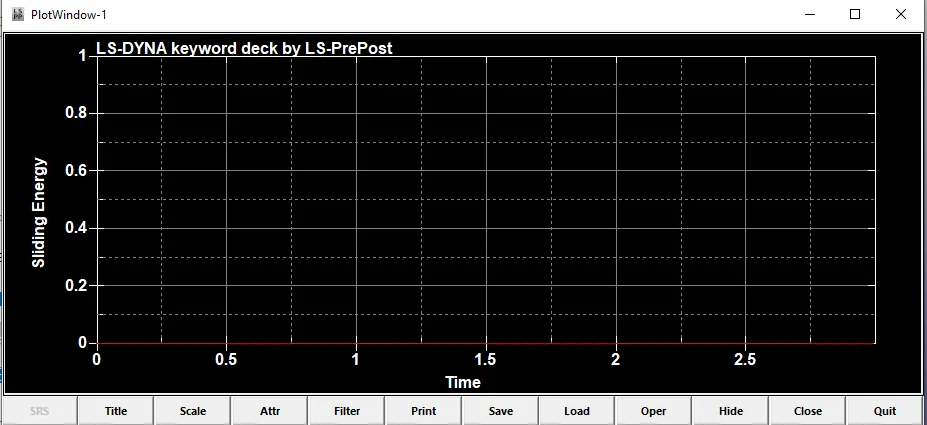
ALL THE GRAPHS OF ENERGIES ARE SIMILAR TO THE ABOVE VALUES i.e T= 1.2mm.
COMPARING THE GRAPHS OF T= 1.2mm and T = 1.5mm
- ACCELERATION(T=1.2mm)
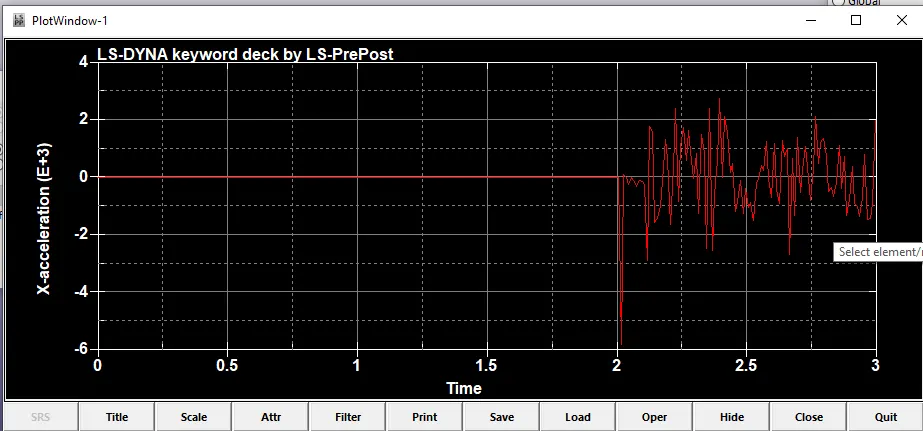
Here after 2ms graphs is decreased in -6 and the peak value is around 2.4ms.
- ACCELERATION(T= 1.5mm)
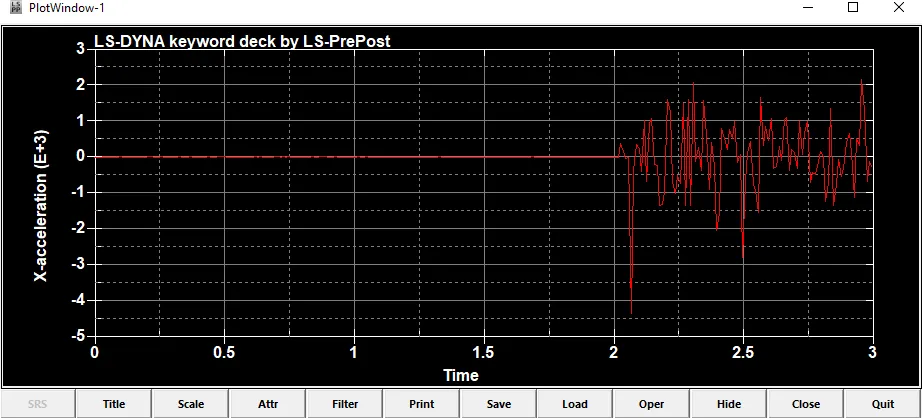
Here after 2ms graphs shows small peak then it go down aand the peak is around 2.9ms.
2. STRESS/STRAIN PLOT
- T = 1.2mm
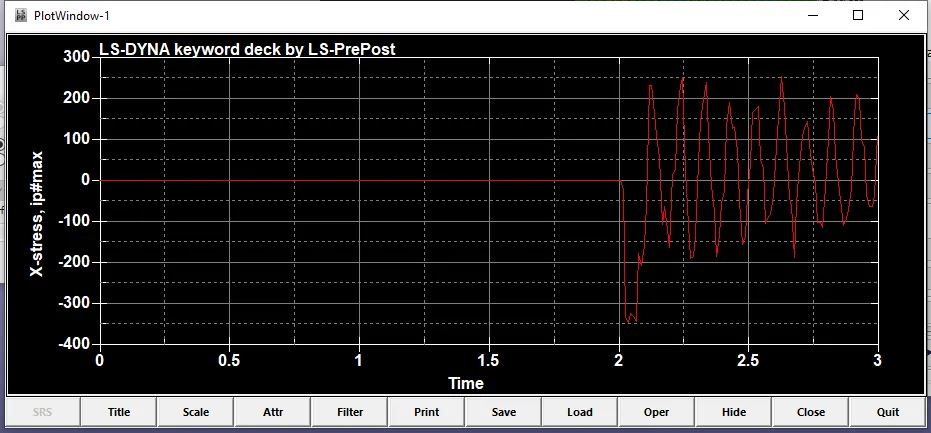
Here the peak is around 2.6ms.
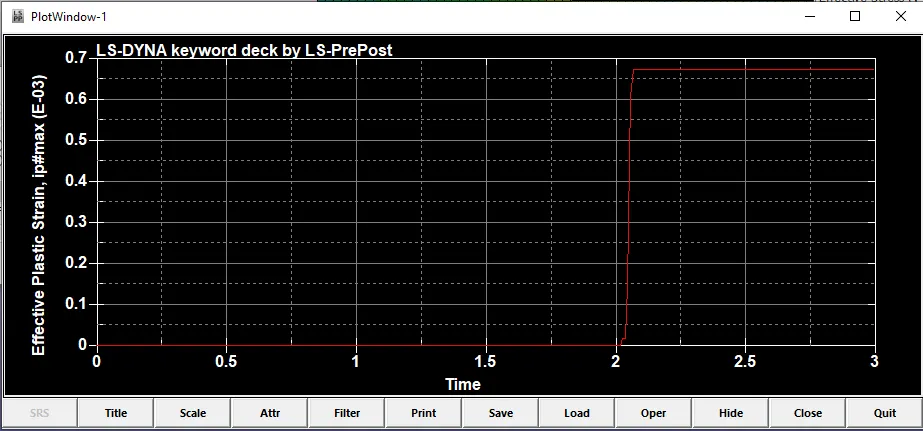
After 2.1ms its shows smooth line.
- T= 1.5mm
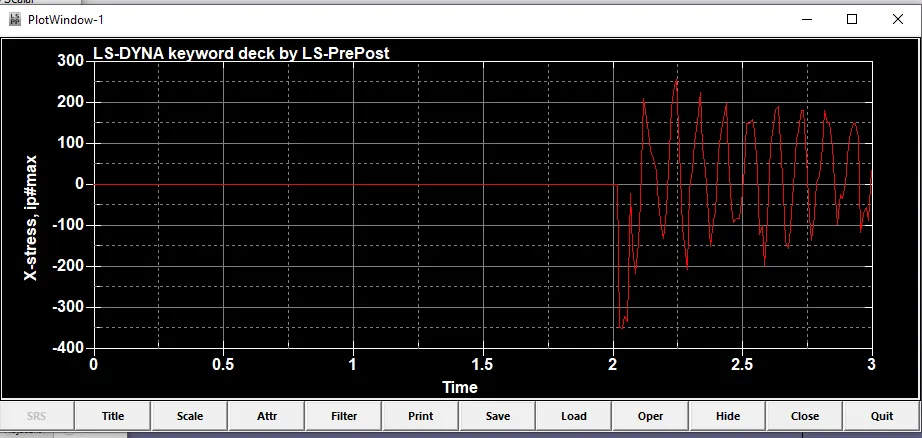
Here the peak is around 2.3ms
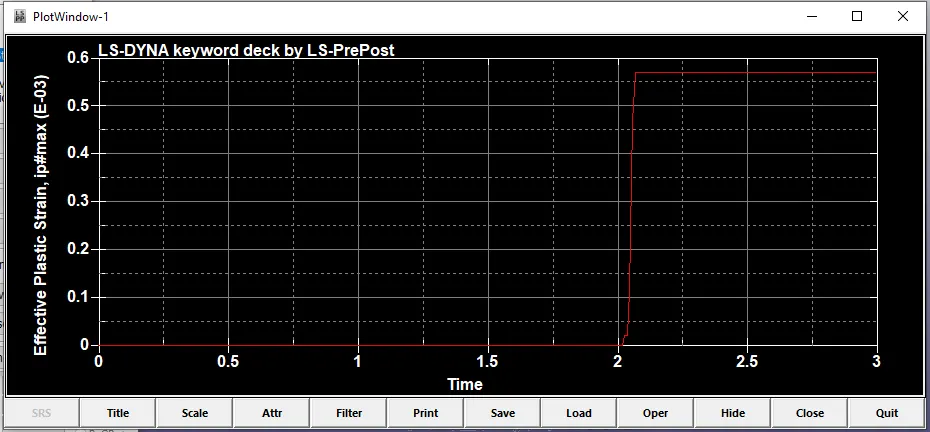
Here the peak is around 2.1 and then smooth line.
Table to compare the results.
Maximum values
Acceleration(mm/ms2) time(ms) Stress(Mpa) time(ms) strain(mm)(e-3) time(ms)
T= 1.2mm 2.9 e+3 2.4 250 2.6 0.68 2.1
T= 1.5mm 2.1 e+3 2.9 250 2.3 0.58 2.1
CONCLUSION:
- Two different simulations are performed using different shell thickneses.
- Results are compared and found useful.
- Graphs are plotted sucessfully.