Week - 4 - crash box simulation
Assignment 4 - Crash box simulation
With this project, the objective is to create a running simulation and extract useful results starting from a mesed component.
1. Material definition
The material of the crash box is steel, whose properties are:
- Young's Modulus: E = 200 GPa
- Poisson's ratio: `\nu` = 0.3
- Density: `\rho = 7.8 {Kg}/m^3`
To express the Young's Modulus and the density in the correct unit system, the following calculations were performed:
`200 GPa = 200 \times 10^{9}frac{Kg\times m/s^2}{m^2} = 200 \times 10^{9}frac{1000 g\times \frac{1000 mm}{(1000 ms)^2}}{(1000mm)^2} = 200 000 \frac{g}{mm\timesms^2}`
`\rho = 7.8 \frac{Kg}{m^3}= 7800 g/(1000mm)^3=7.8\times10^{-6}g/{mm^3}`
The material that is going to be defined is a linear static isotropic material without failure criteria, therefore, these are the only properties required to define it.
2. Section definition
The part was associated with a section (SECTION_SHELL) where it was defined that the material should have an element formulation of the type Belytschko-Tsay and that the thickness attributed to the shell elements must be 1.2 mm.
3. Rigid wall definition
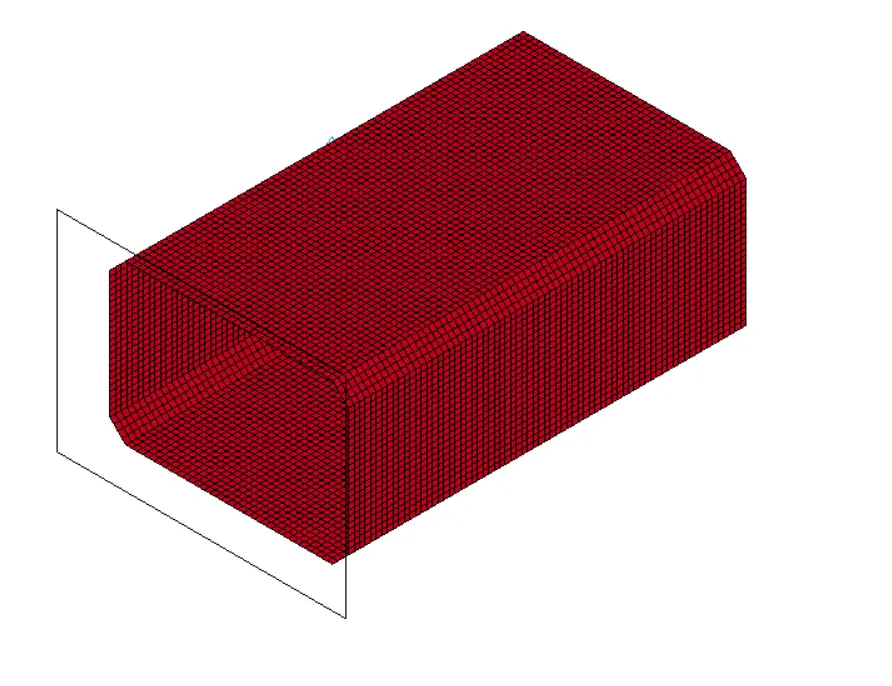
The rigid wall was created via the 'new entity' menu. The rigid wall is 10 mm apart from the crashbox edge.
3. Contacts
Only one contact was dedined, the self-contact. This contact was defined for the event of two elements of the crasbox coming into contact with each other.
4. Initial velocity
The initial velocity of 50Km/h was converted to the unit system used by performing the following calculations:
`50 \frac{Km}{h} = 50 \frac{1000 000 mm}{3600 000 ms} = 13.89 \frac{mm}{ms}`
5. Simulation controls
5.1. Termination
The CONTROL_TERMINATION keyword was created to define the total simulation time.
The following calculation was carried to determine the simulation time before impact:
`t_{be\f\o\re impact} = \frac{d}{v}= \frac{10 mm}{13.89 \frac{mm}{ms}} = 0.72 ms`
Having this in consideration, the total simulation time was set at 1.5 s to evaluate properly the behaviour of the crash box after the impact.
5.2. Energy
A CONTROL_ENERGY keyword was activated to calculate the total hourglass energy and to take it into account in the total energy balance.
6. Output request
6.1. Cross sectional force
A cross-section was defined by selecting the nodes shown in the following figure:
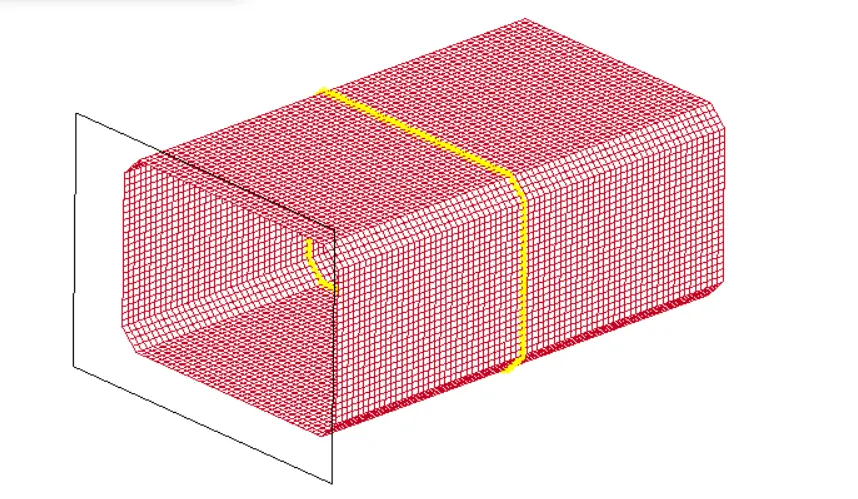
This node set was associated to a DATABASE_CROSS_SECTION_SET keyword.
6.2. Acceleration plot
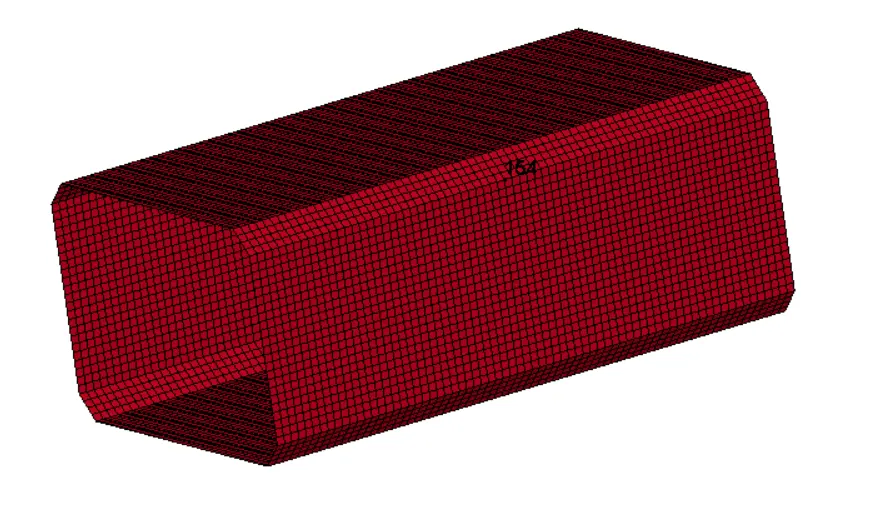
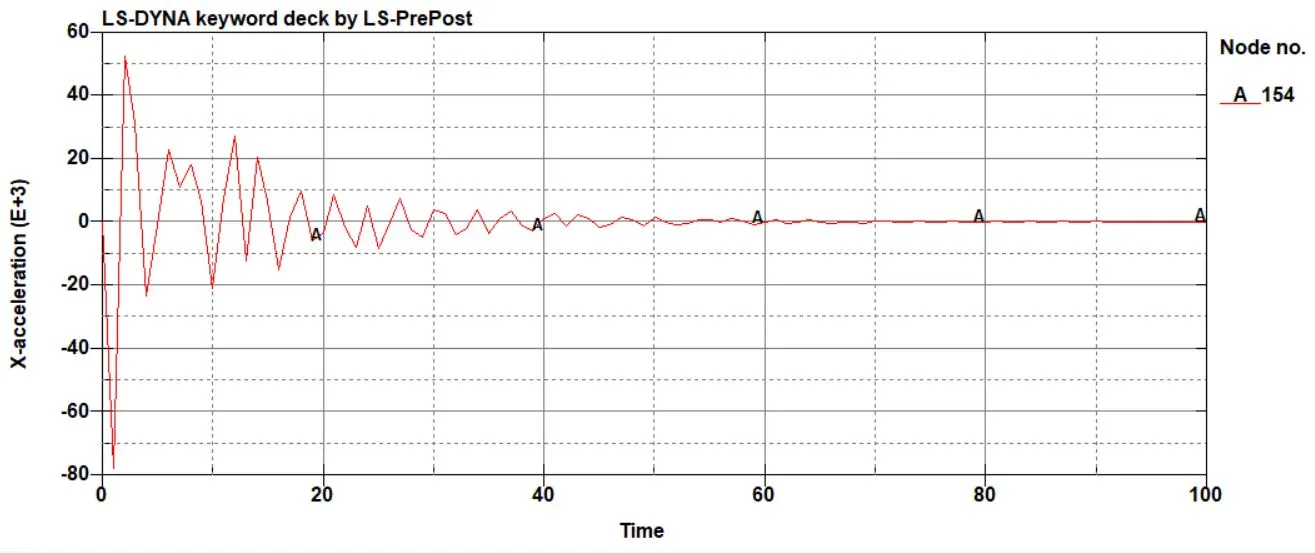
To obtain this data, the point shown in the image was selected. The accelerations measured at node 154.
6.3. ASCII outputs
The following ASCII outputs were activated:
- NODOUT
- GLSAT
- RWFORC
- SECFORC
All the time steps were set to 0.05 ms
7. Results
7.1. 1.2 mm thickness
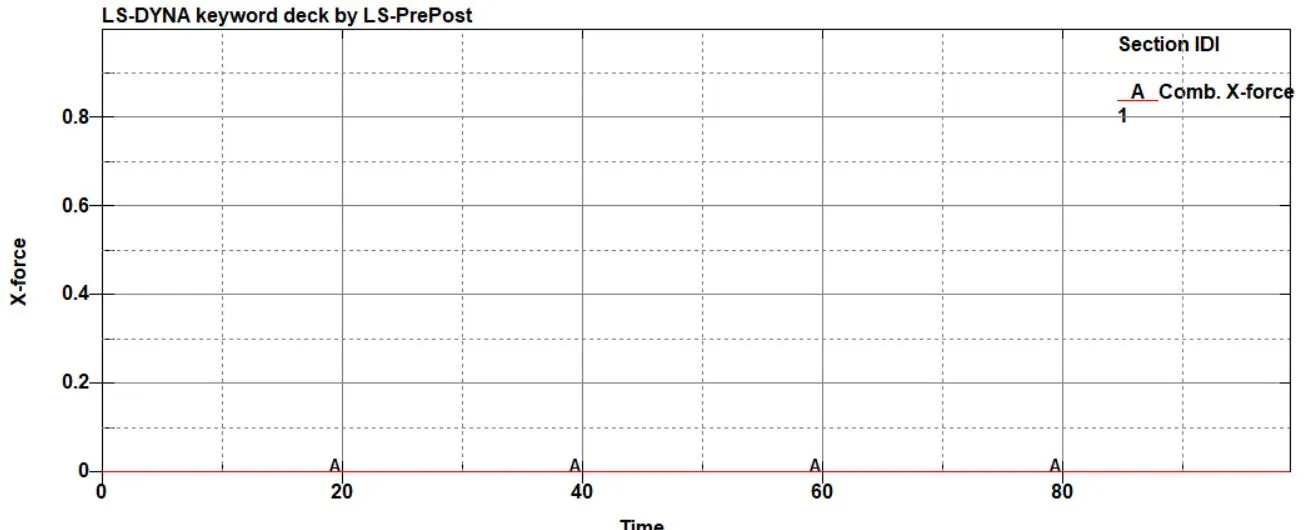
7.1.2. Cross-sectional force generated in the middle of the crashbox
7.1.3. Acceleration of node 154
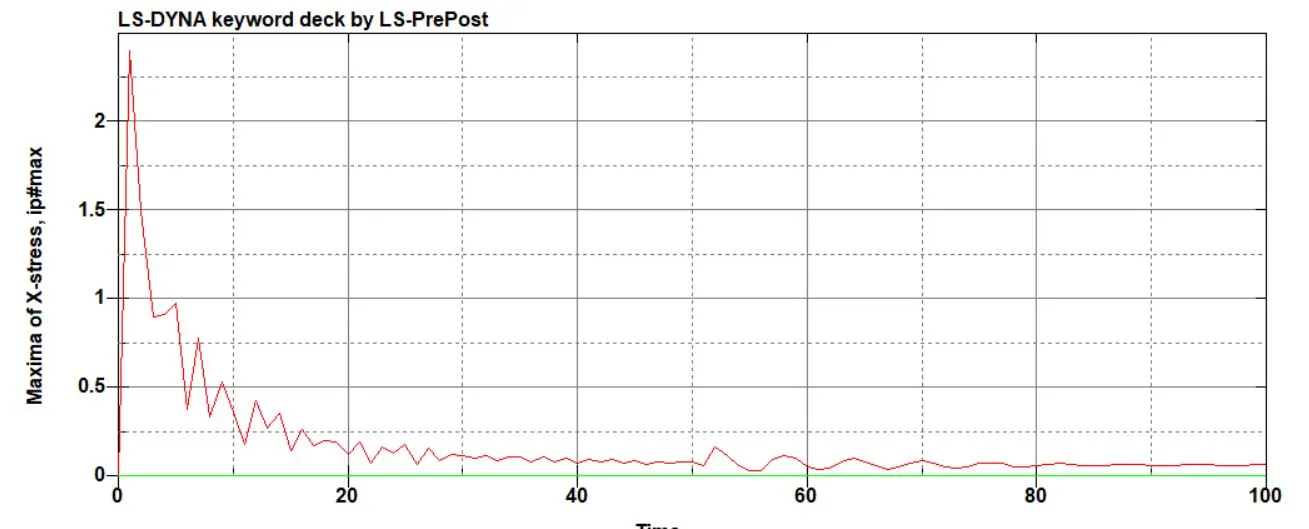
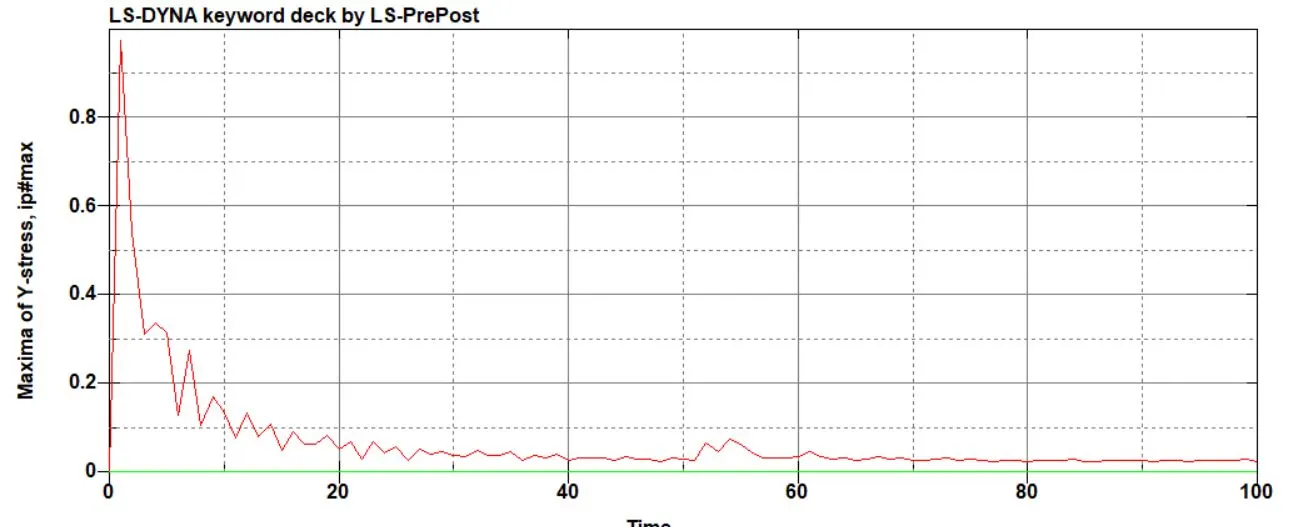
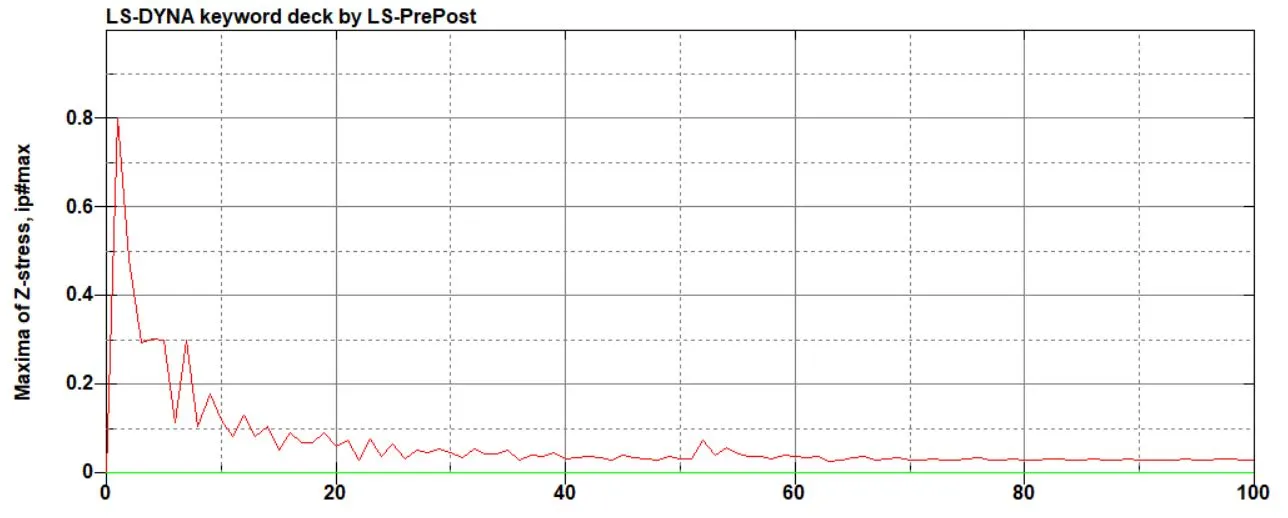
7.1.4. Maximum x,y and z stresses
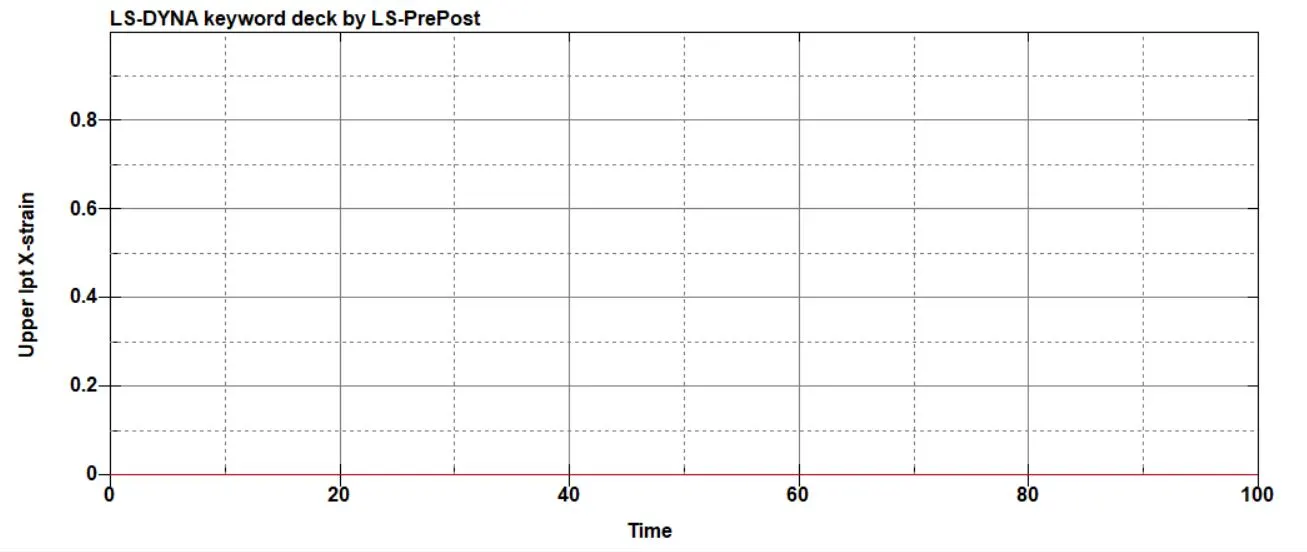
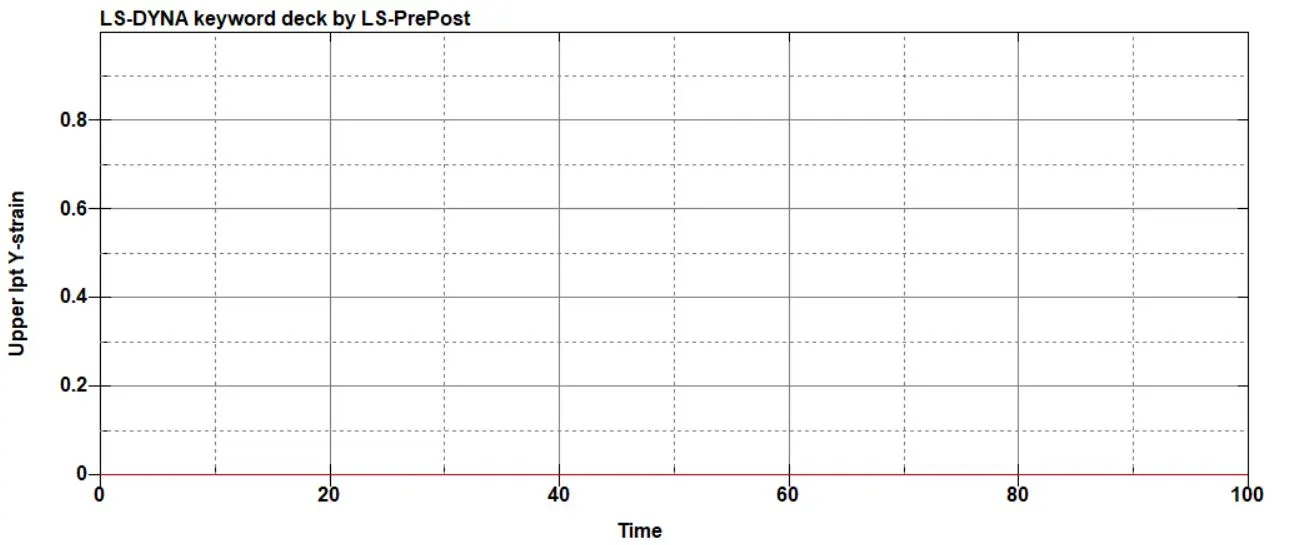
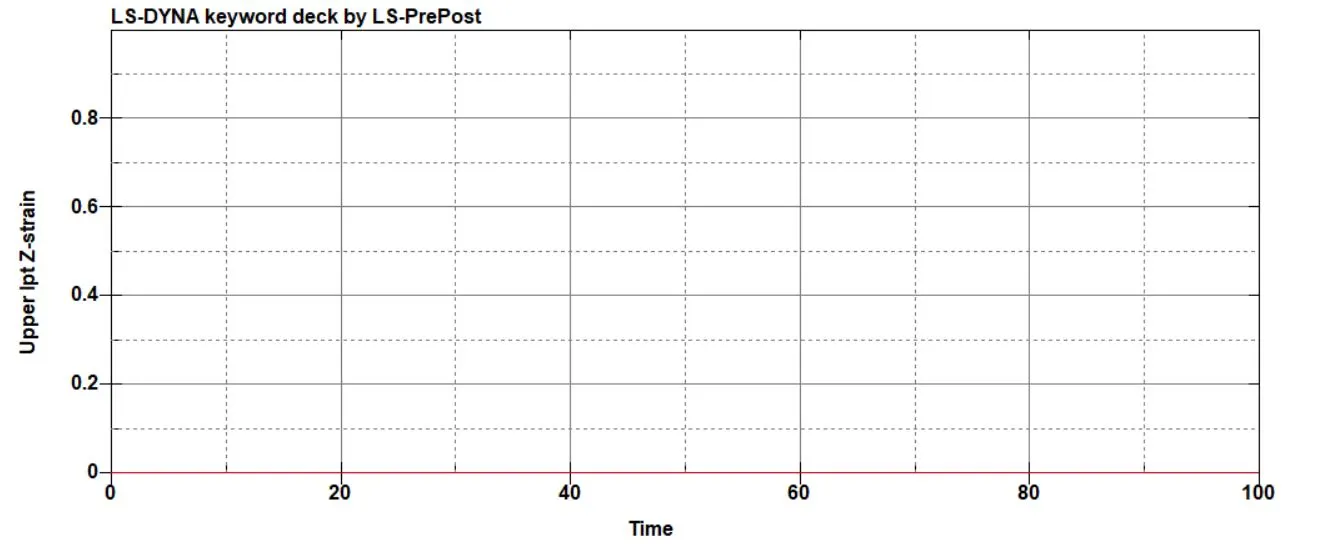
7.1.5. Maximum x,y and z strains
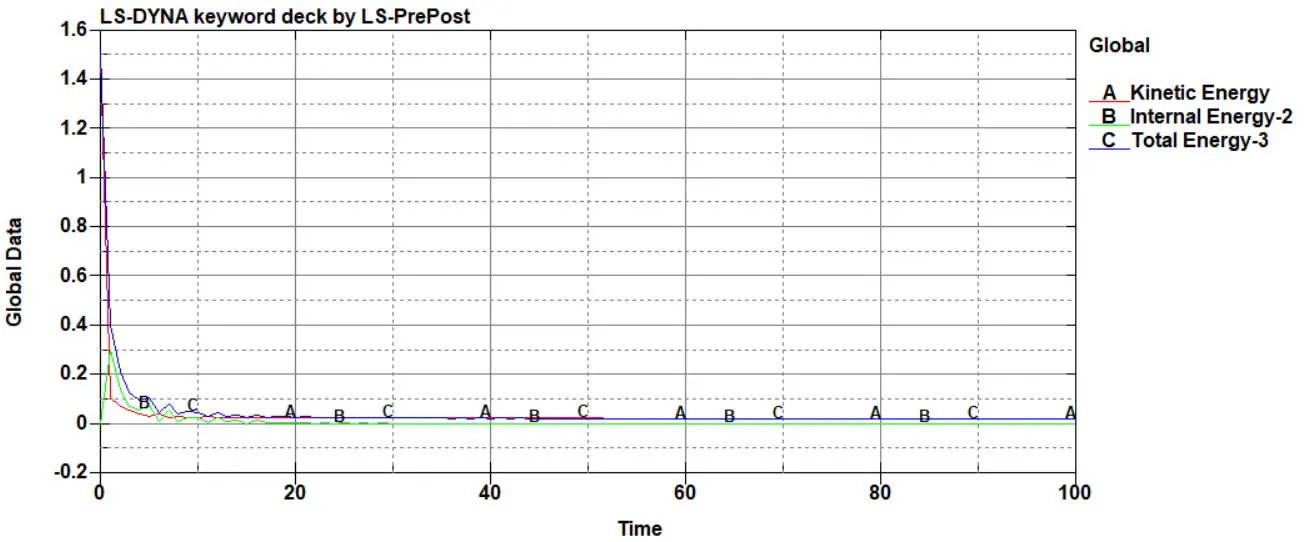
7.1.6. Plot of all energies
7.1.7. Comparison between the stress and strain plots for 1.2 and 1.5 mm thickness
For both cases, the strain plots are null.
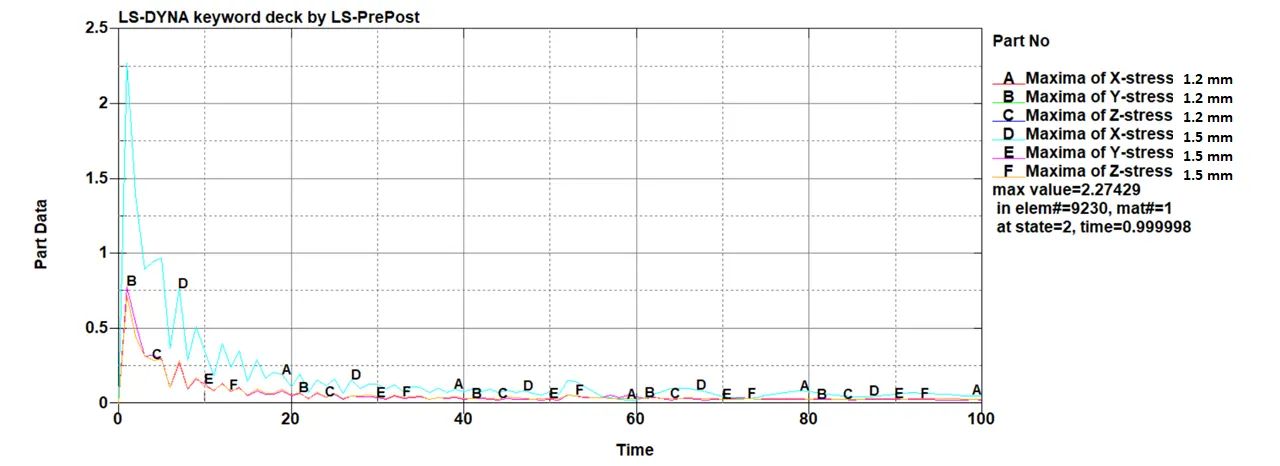
The change of thickness appears to have a greater impact in the values of the X-stress.
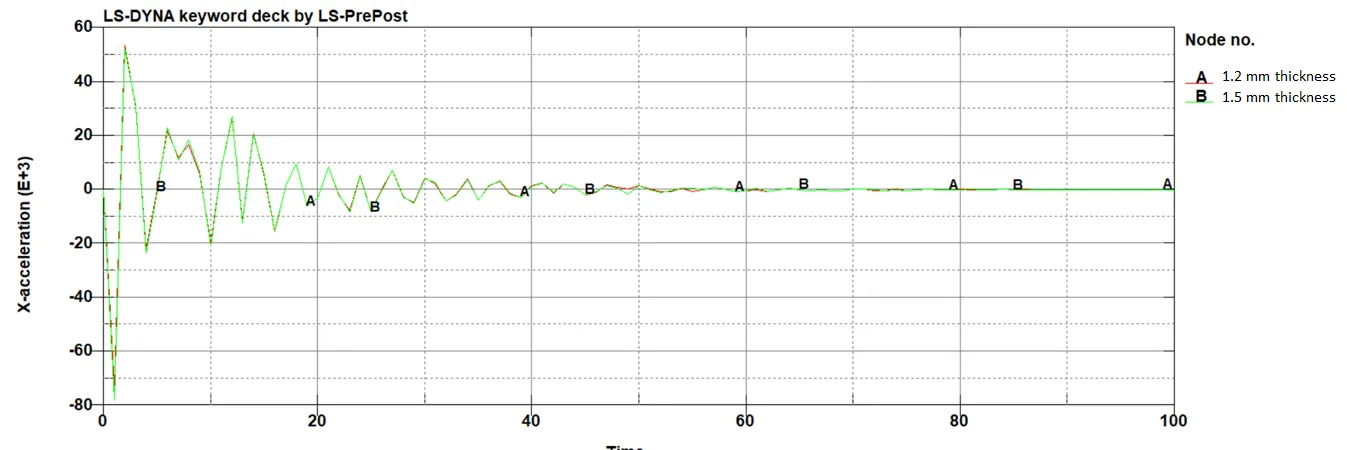
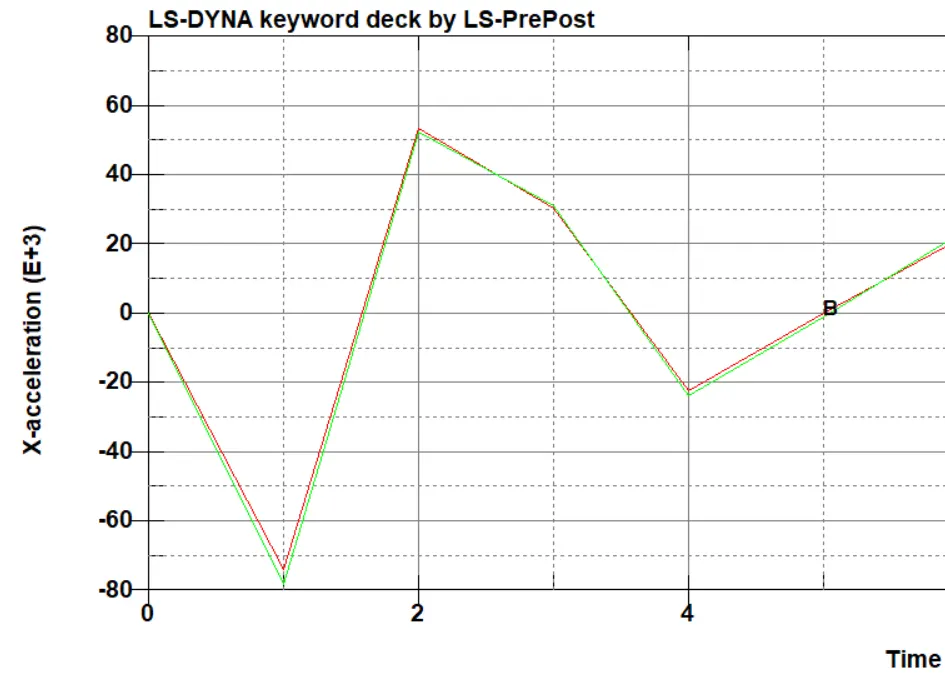
7.1.8. Comparison between the accelerations of node 154 for 1.2 and 1.5 mm thickness
8. Conclusions
- The acceleration plots have approximately the same shape regardless of the thickness. Nevertheless, the plot of the acceleration for the thickness of 1.2 mm appears to reach slightly higher values. The reason for this is the fact that the crashbox that has a thickness of 1.2 is lighter, meaning that the nodal accelerations are greater.
- Most of the graphs relative to stresses, strains and forces are (almost) null. The reason for this is because the deformation of the crashbox is too small to capture, which can be confirmed in the animation video of the Von Mises stresses. One way to obtain more significant values for strain, stresses and forces would be to define an imposed velocity instead of an initial velocity. Because, by doing this, the crashbox would be forced to fold onto itself, producing much greater deformations. In the case of the simulation that was run here, the crashbox seems to hit the wall and go back to its original position, suffering very little deformations.
- In line with the problem denoted in the previous topic, one way to obtain a more realistic simulation would be to create a mass load on the edge of the crash box opposite to the rigid wall, simulatig the inertia of a car hitting the wall. By doing this, the crashbox would have to deform more in order to dissipate the kinetic energy added by the mass of the car.
- The Hourglass energy was not reported. The reason for that the MATSUM option in the ASCII outputs was not activated. Re-run these simulations with the MATSUM option activated would be extremely time-consuming.
- The calculated time for the simulation was 1.5 ms. But, from the simulation results, it was possible to see that, after 1.5 ms, the crash box did not hit the wall. To obtain the final simulation files, the simulation time was updated to 100 ms. The reason for this mistake is still to be determined.