Week-4 Challenge WOT Condition Part-2
- What is the difference between mapped and dynamic model of engine, motor and generator? How can you change model type?
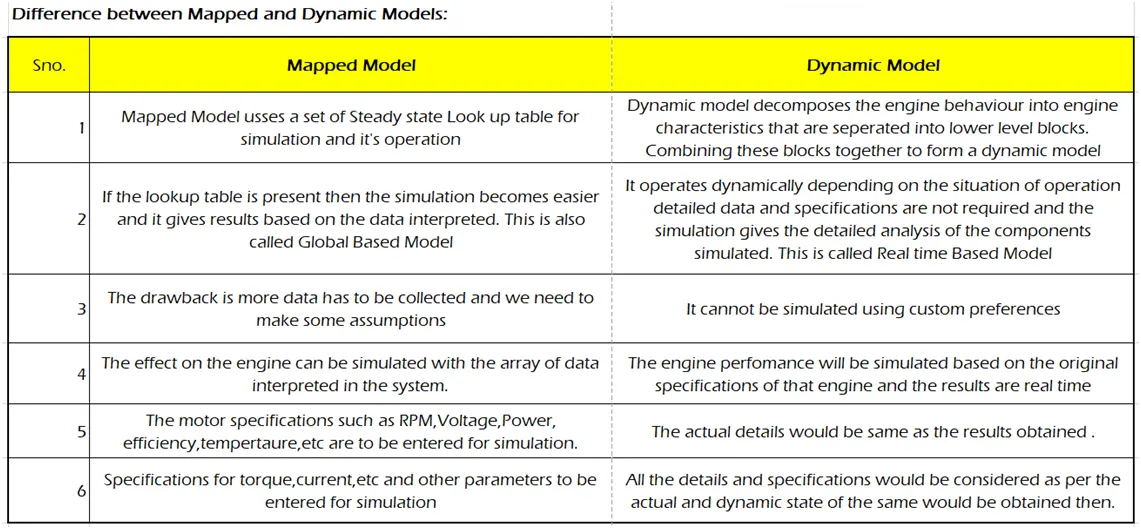
How can you change model type?

- <!--[endif]-->Enter to Passenger Car module -> Electric plant -> Powertrain Blockset -> Right click on Motor module, then select variant option from drop down list.
- <!--[endif]-->From variant option -> select “Label Mode Active Choice” -> then select required mode (MotGenEvDynamic / MotGenEvMapped).
2. How does the model calculate miles per gallon? Which factors are considered to model fuel flow?
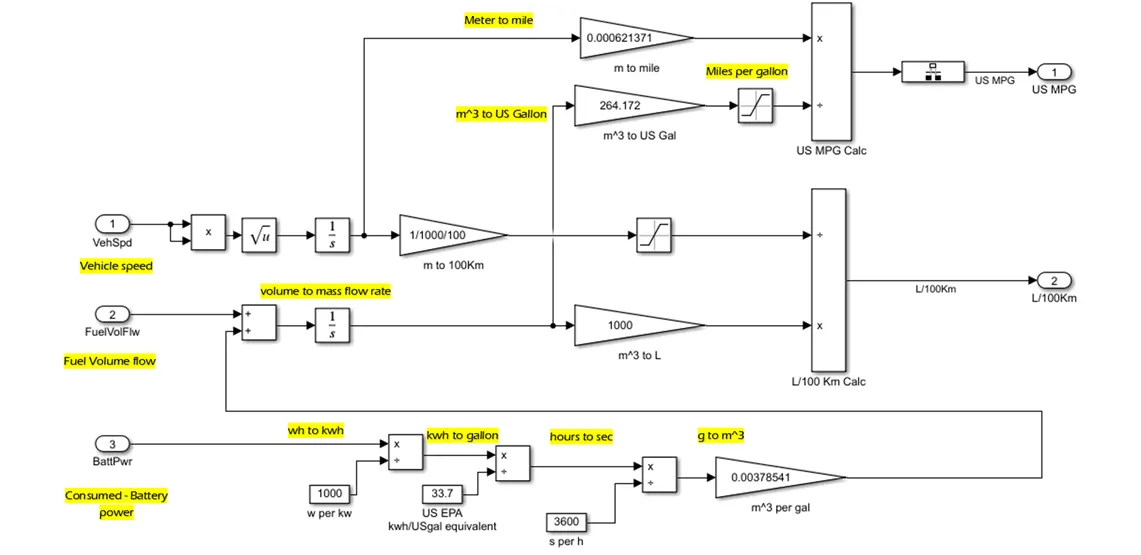
- <!--[endif]-->Converting of battery power from watt hour to kwh, we have to divide the battery power by 1000.
- <!-- [if !supportLists]-->By dividing 33.7, we are going to convert kwh to equivalent Gasoline of per gallon (As per US Environment Protection Agency – One gasoline Gallon is equivalent to 33.7 kwh). kwh/US gallon.
- Now change from hours to sec by dividing 3600, then convert it to equivalent energy of gallon to m^3 by multiply with 0.00378541.
- Add converted volume of energy with fluid volume flow block, then by Integrating of added value to convert volume to mass flow rate.
- By multiplying result with 264.172 for converting from m^3 to equivalent US gallon.
- Now comparing resultant fluid flow with vehicle speed, we can get mpg consumption.
- By Integrating of vehicle speed, we can get total distance travelling by the vehicle in meter, then convert this meter to miles by multiplying with 0.000621371.
- Finally Dividing of Distance in miles by Gallon of fluid, we can get our result MPG (Miles per Gallon)
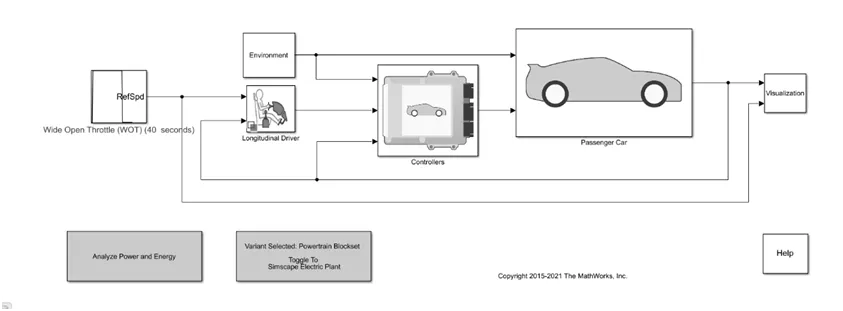
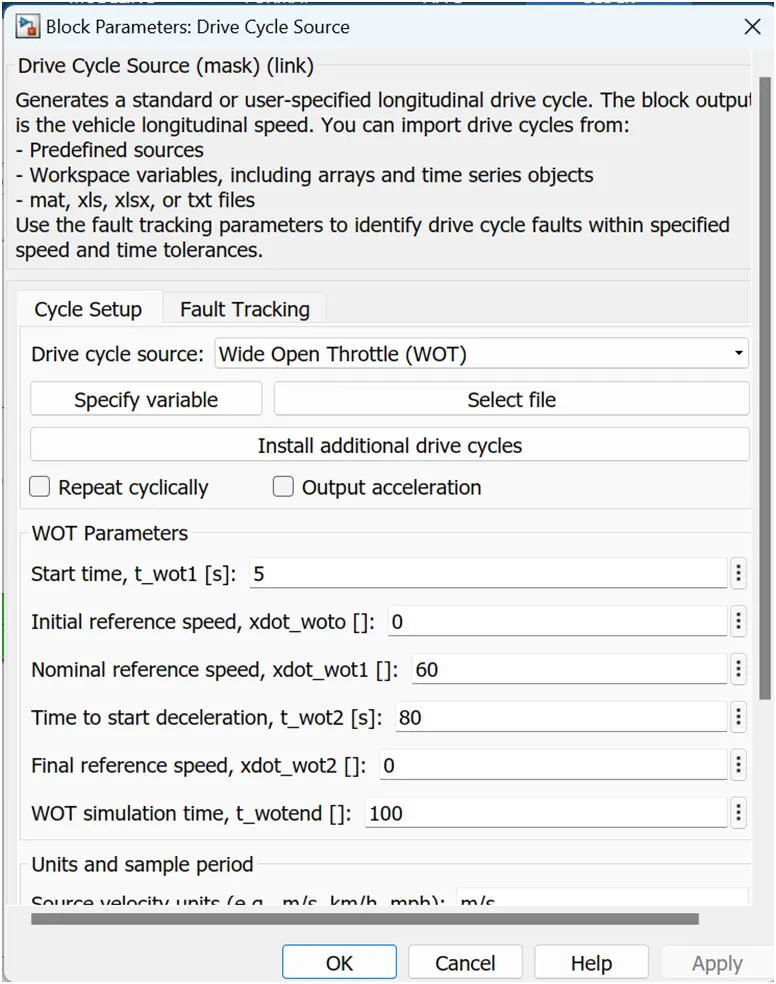
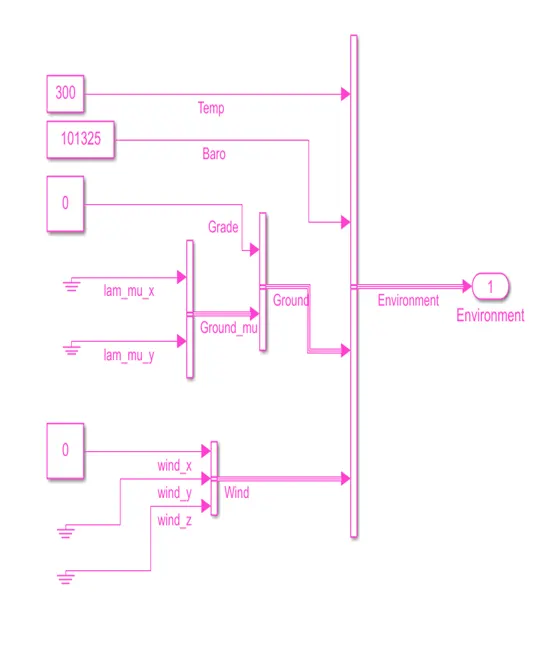
3. Run the HEV ReferenceApplication with WOT drive cycle. Change the grade and wind velocity in the environment block. Comment on the results.
Grade: 0 / Wind velocity: 0 m/s
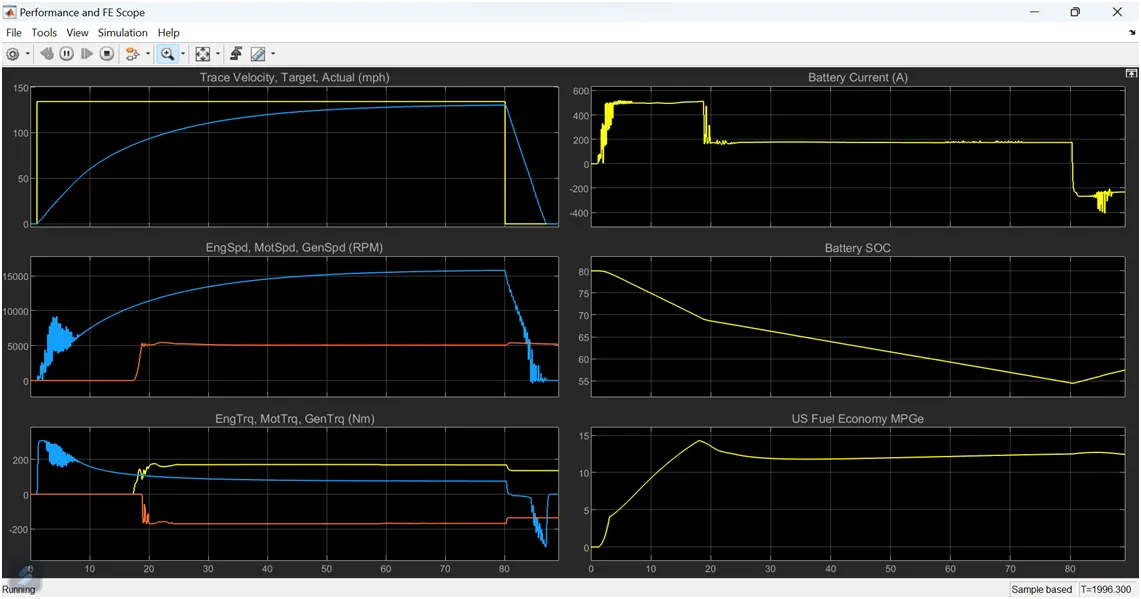
Grade: 5 / Wind velocity: 10 m/s
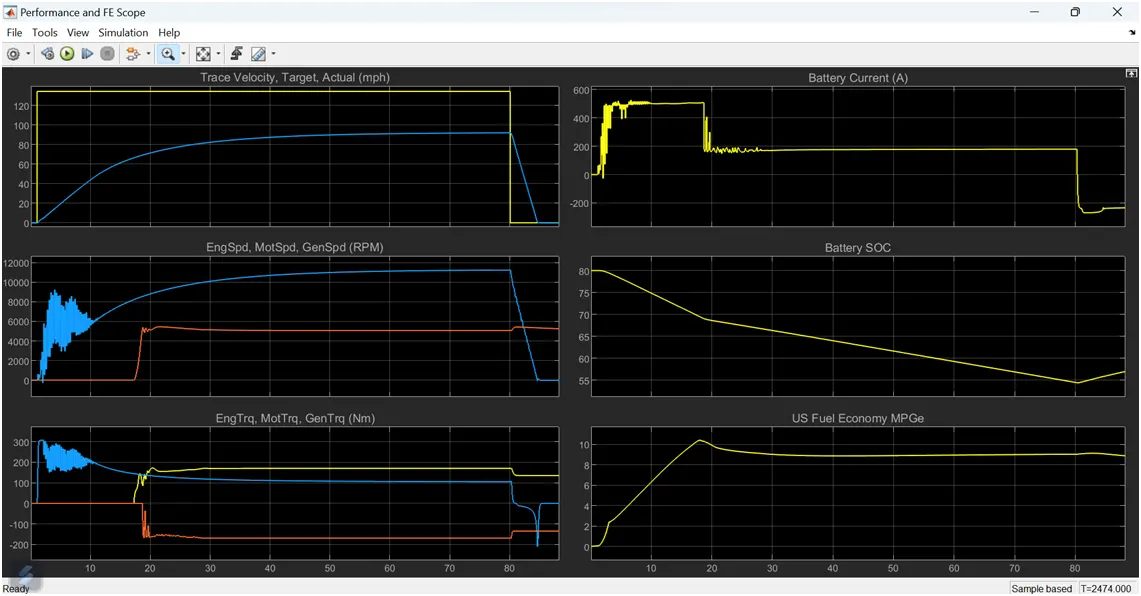
Grade: 10 / Wind velocity: 30 m/s
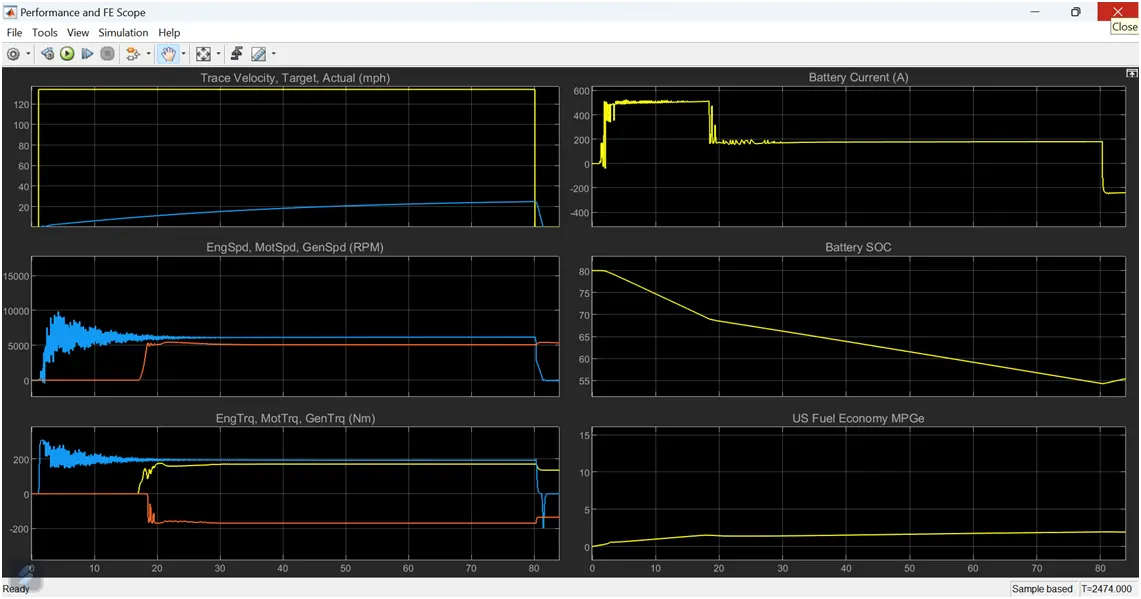
Conclusion:
By increase in grade and wind velocity,
- <!-- [if !supportLists]--> Peak velocity achieved is reduced as gradient angle and aerodynamic force becomes dominant.
- Fuel economy is also reduced because the distance travelled is reduced due to external forces.
- Deceleration time is reduced so batter recharging capacity is also reduced.
- Battery SOC at the end of WOT acceleration is similar but during deceleration battery is charged more is the grade and wind velocity is less.
4. Keeping all other parameters same, compare the simulated results of hybrid and pure electric powertrains.
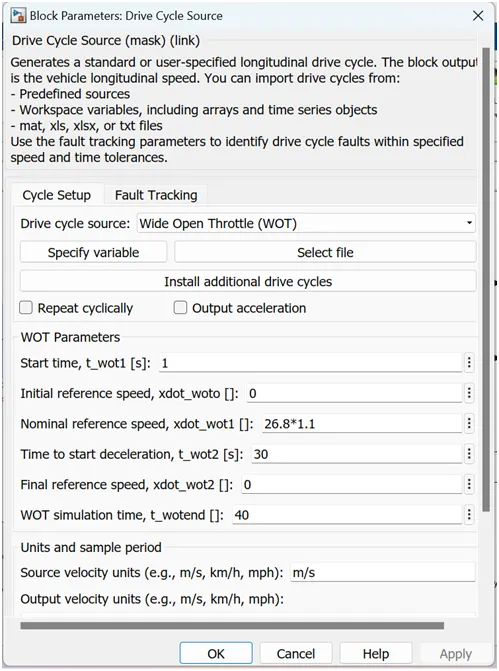
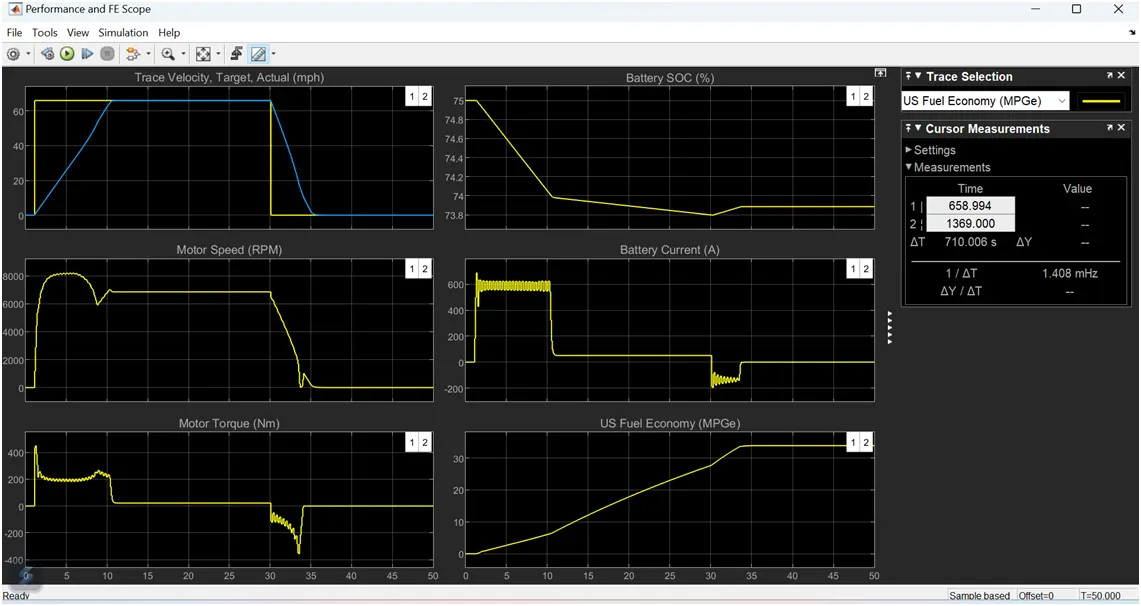
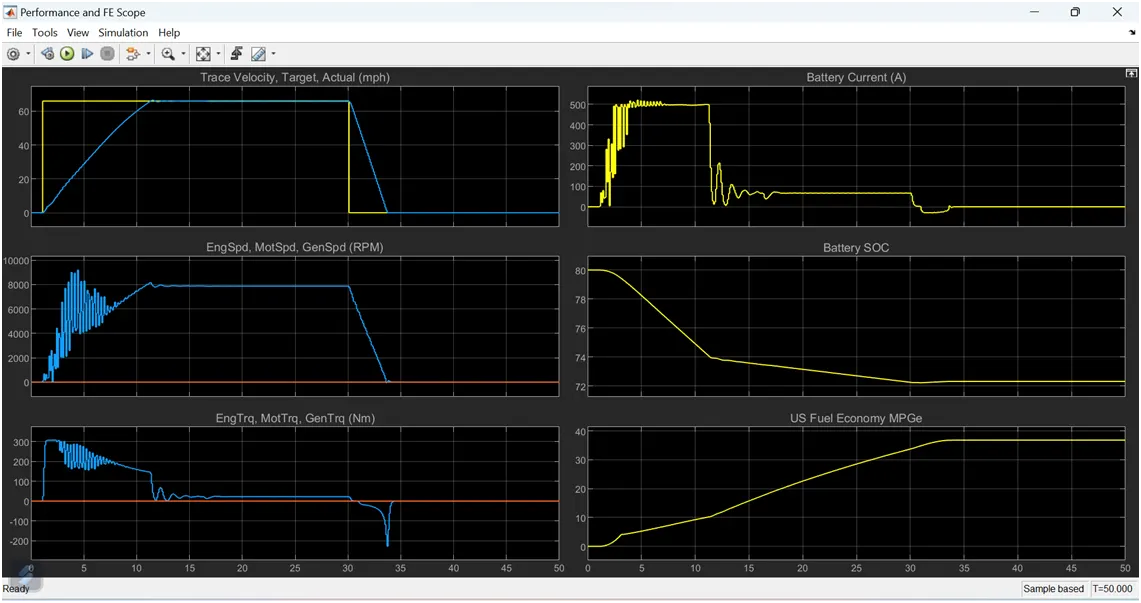
By Keeping all parameters are same on both EV and HEV Multimodel Reference Application:
<!-- [if !supportLists]-->· <!--[endif]-->Acceleration:
EV Vehicle is taking less time to reach Peak velocity comparing with HEV, (Here EV taken around 10sec, But HEV was taken more than 10sec)
<!-- [if !supportLists]-->· <!--[endif]-->Deceleration:
Due to more frictional parts in HEV Vehicle, It is taking less deceleration time comparing with EV.
<!-- [if !supportLists]-->· <!--[endif]-->Battery SOC:
In Battery SOC plot of EV vehicle, Recharging percentage of battery is more compared with HEV in deceleration period (Recharging of battery due to Regenerative Braking – means Coasting time is more).
Regenerative braking is better in case of EV.