Week-4 Challenge WOT Condition Part-2
1. What is the difference between mapped and dynamic model of engine, motor and generator? How can you change model type?
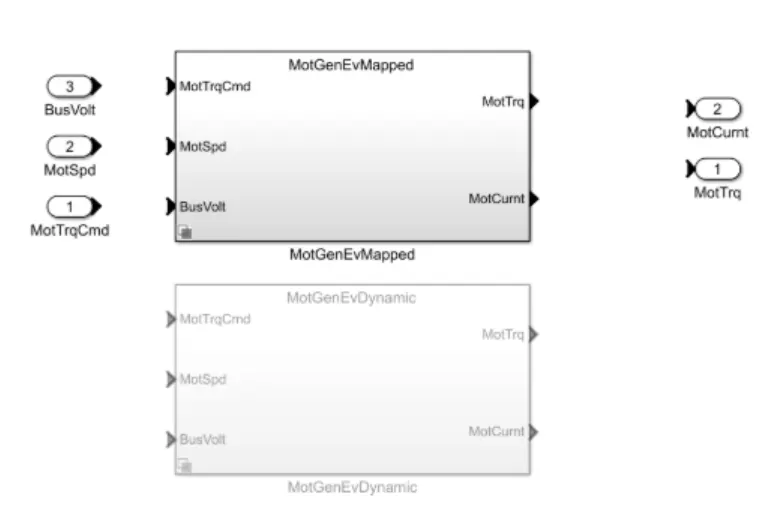
Figure 1
Figure 1 shows the mapped and dynamic model of motor and generator
Mapped model
1) In mapped model data points are pre-assigned in lookup table which would be configured with the operational parts and the analysis would be formed.
2) Model uses a set of steady-state lookup tables to characterize engine performance.
2) Output values are stored for the given corresponding input values of the motor, generator and engine
3) The accuracy is low for this system.
4) Run time simulation takes less time, because it dose not run with real time simulation.
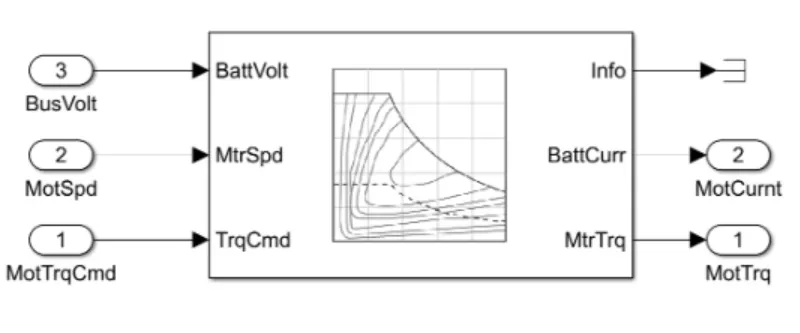
Figure 2
Figure 2 shows the mapped model
Dynamic model
1) Dynamic model runs by real time simulator.
2) Dynamic model uses the combination of output from various subsystems to generate output.
3) The accuracy of dynamic model is very high.
4) Run time simulation takes more time.
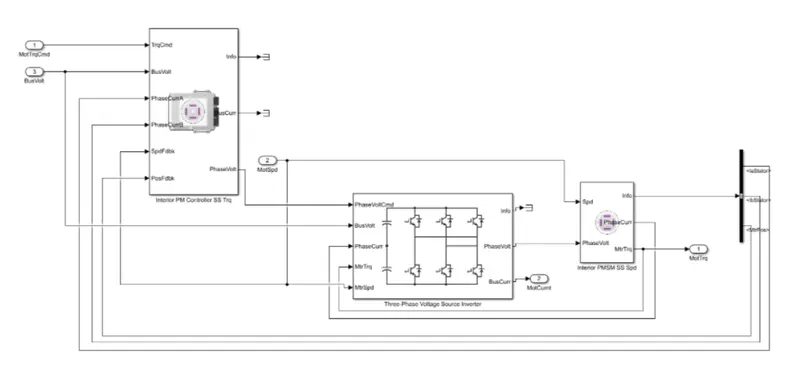
Figure 3
Figure 3 shows the dynamic model
Steps to change model
1) Select vehicle type in powertrain blockset model.
2) Go to the passenger block in the simulink model of Electrical Vehicle motor/Generator.
3) Right click on block and go to variance label mode active choice MotorGenEV Mapped or Dynamic.
2. How does the model calculate miles per gallon? Which factors are considered to model fuel flow?
In electrical vehicle miles per gallon tells thatenergy which is equivalent that of a engine powered carto propel the car through a distance
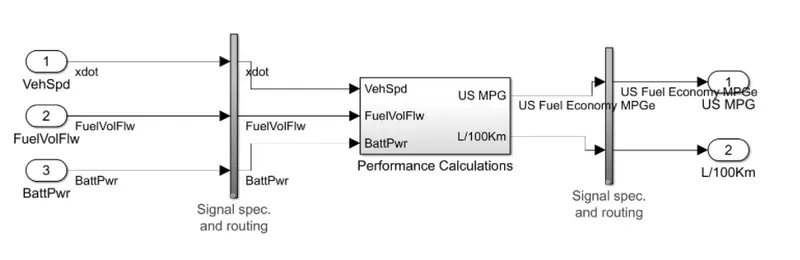
Figure 4
Figure 4 shows the performance calculations of fuel flow
Miled per gallon expressed as the amount of fuel energy required to move a engine powered car through a distance is determined and the it is compared to the equivalent amount of electric energy required to move the car through the same distance.
it has
1) Vehicle speed
2) Battery power
3) Fuel flow
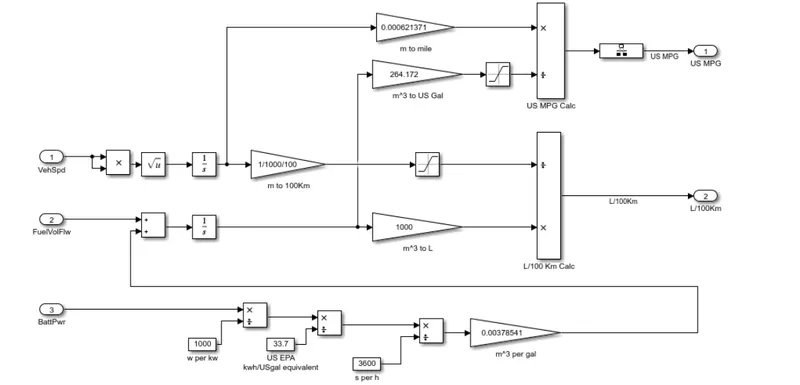
Figure 5
Figure 5 shows the powertrain blockset that takes input of the vehicle speed
Conversion from Cubic meter to gallon
1000 liters = 264.17 US gallons
The output is calculated depending on Fuel and battery output and also vehicle speed
3. Run the HEV ReferenceApplication with WOT drive cycle. Change the grade and wind velocity in the environment block. Comment on the results.
HEV is the vehicle which runs with the combination of engine and battery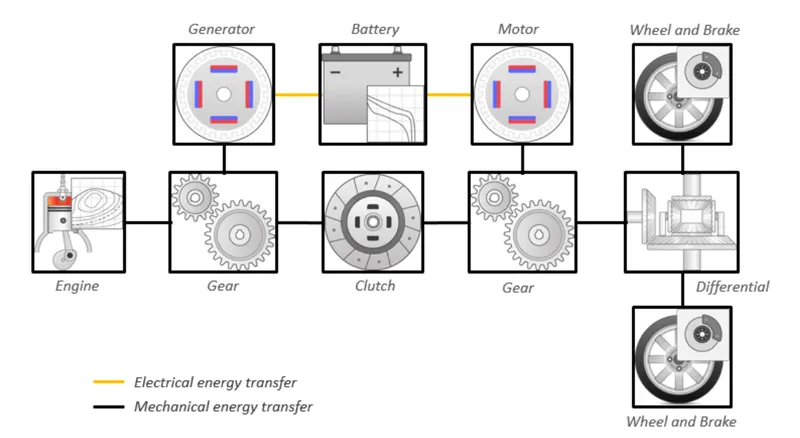
Figure 6
Figure 6 shows the series-prallel connection of HEV
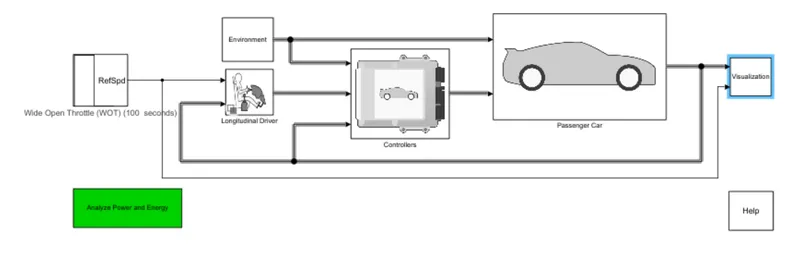
Figure 7
Figure 7 shows the simulink model of Hybrid Electrical Vehicle
Case 1
below are the input parameters of drive cycle source
100 seconds of total cycle time
speed = 80 mph
gread angle 0
wind velocity 0 m/s
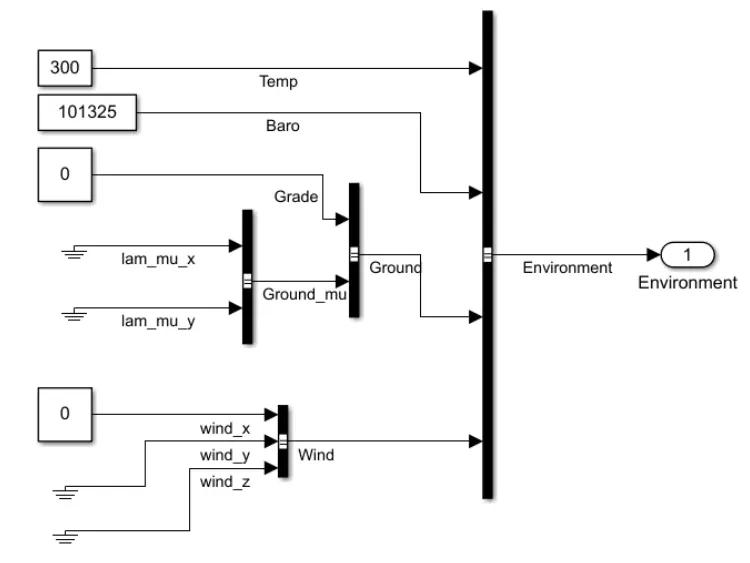
Figure 7
Figure 7 shows the input values
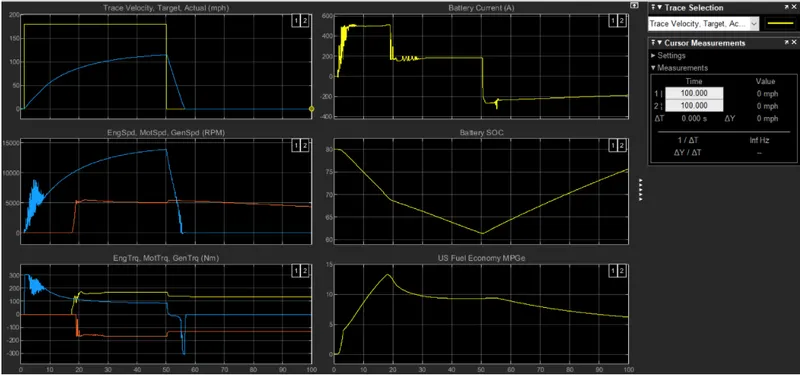
Figure 8
Figure 8 shows the output, based on the input parameters of drive cycle source
Observations
Plot 1:-
Around 16.5 seconds of time will take to reach maximum speed (80 mph)
Nearly 6.1 seconds of time will take to reach maximum speed (80 mph) to 0 mph
Plot 2:-
Plot 2 shows the speed
maximum speed of motor = 9497 rpm
Plot 3:-
plot 3 shows the torque
maximum motor torque = 206 Nm
Plot 4:-
plot 4 shows the current values of battery varies from 500 to 0 amps in normal mode and
varies from 0 to -200 amps in regenerative braking
Plot 5:-
plot 5 shows the battery SOC
SOC decreased form 80 to 62 % increased during normal condition and from 62 to 76 % during regenerative braking
Plot 6:-
plot 6 shows the fuel economy
maximum fuel economy is 20.45 MPG
minimum fuel economy is 7.18 MPG
Case 2
Cycle time 100 sec
speed 80 mph
gread angle 5
wind velocity 5 m/s
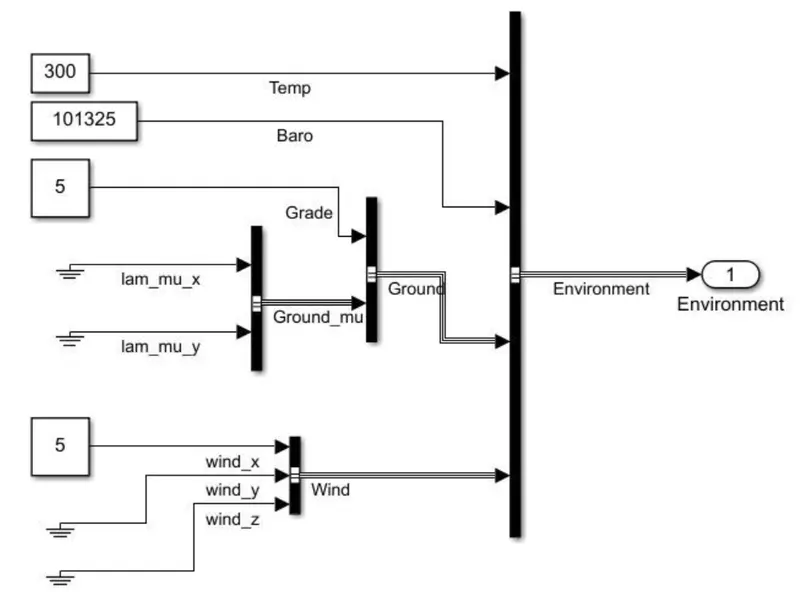
Figure 9
Figure 9 shows the input values
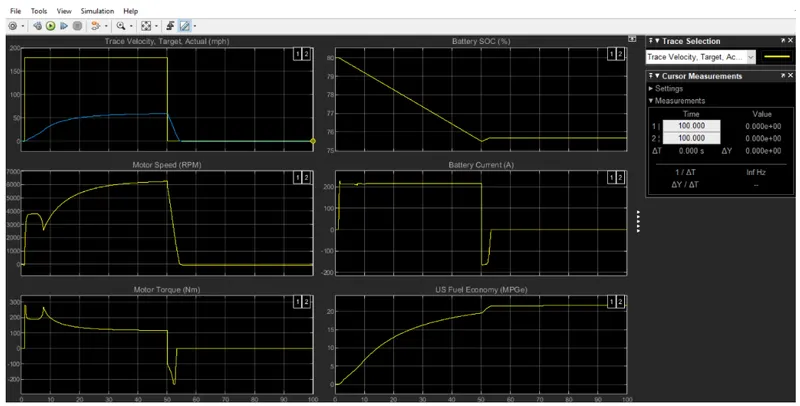
Figure 10
Figure 10 shows the results with above specifications
Plot 1:-
Maximum 59 mph reached in 49 seconds
maximum to minimum speed reached in 4.6 seconds
plot 2:-
maximum motor speed is 6254 rpm
plot 3:-
maximum motor torque is 280 Nm
plot 4:-
battery SOC for 80 to 75 % in 50 seconds
plot 5:-
battery current remains constant of 200 amps
plot 6:-
maximum fuel economy is 21 MPG
4. Keeping all other parameters same, compare the simulated results of hybrid and pure electric powertrains.
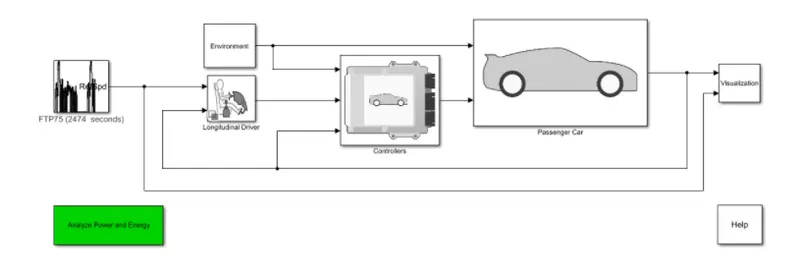
Figure 11
Figure 11 shows the block diagram of pure Electrical vehicle
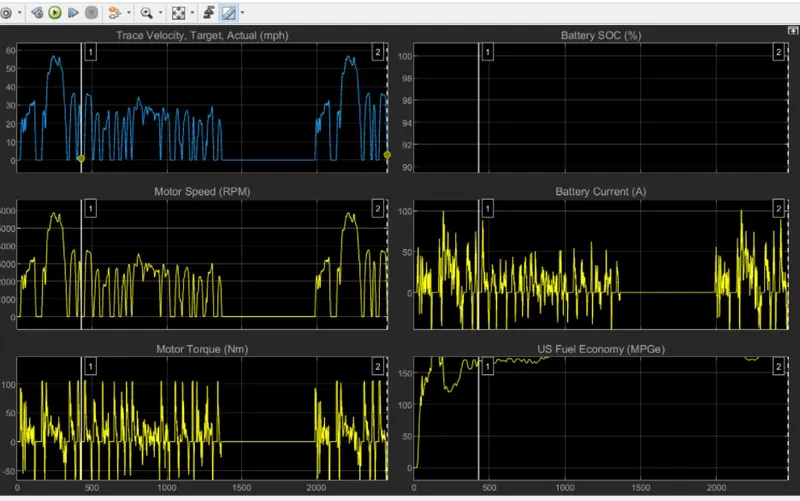
Figure 12
Figure 12 shows the results of pure Electrical Vehicle
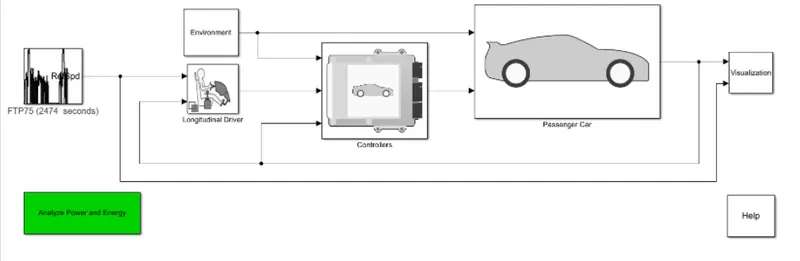
Figure 13
Figure 13 shows the block diagram of HEV
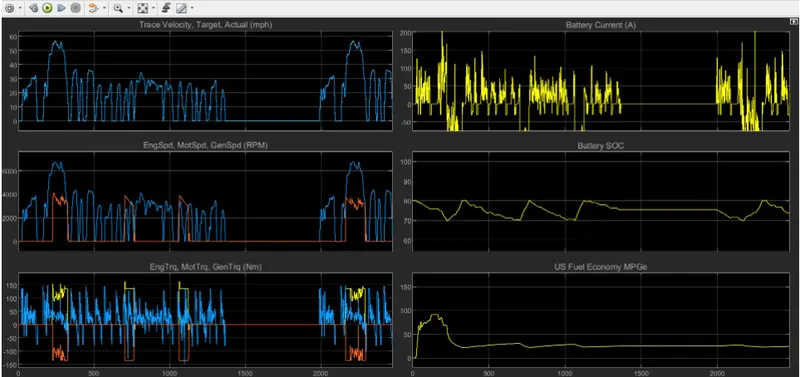
Figure 14
Figure 14 shows the results for HEV
The difference between EV and HEV is for EV the source is only one i.e. electric source,
where as for HEV thre are two sources one is fuel and next one is electrical. For the both EV and HEV the results will differ according to figure 12 and 14