Week-4 Challenge WOT Condition Part-2
1.
MAPPED ENGINE MODEL: Model uses a set of steady-state lookup tables to characterize engine performance.The tables provide overall engine characteristics, including actual torque, fuel flow rate, BSFC, and engine-out exhaust emissions.It is used,If you have engine data from a dynamometer or a design tool like GT-POWER and for quasi steady-state engine simulations.
DYNAMIC ENGINE MODEL:Model decomposes the engine behavior into engine characteristics that are separated into lower-level components. By combining components in this way, the models capture the dynamic effects.It is used If you need a more detailed dynamic model and have component-level data and to analyze the impact of individual engine components on the overall performance.
MAPPED MOTOR MODEL: The Mapped Motor block implements a mapped motor and drive electronics operating in torque-control mode. The output torque tracks the torque reference demand and includes a motor-response and drive-response time constant. Use the block for fast system-level simulations when you do not know detailed motor parameters, for example, for motor power and torque tradeoff studies. The block assumes that the speed fluctuations due to mechanical load do not affect the motor torque tracking.
DYNAMIC MOTOR MODEL: In this type, a three-phase interior permanent magnet synchronous motor (PMSM). It uses a three-phase input voltage to regulate the individual phase currents, allowing control of motor torque and speed.This is used when the user knows all the parameters and when they are used in the simulation. This motor is more accurate.
MAPPED GENERATOR MODEL: It is similar to other blocks and most of the reference is taken from the look up tables corresponding to the input parameters. simulation time is lesser in this model type.
DYNAMIC GENERATOR MODEL: In this model, the user has to give the input data manually for each step throughout the simulation. The results take time to appear but are very accurate.
To change the model type;
- Open the HEV reference application,go to model explorer.
- Select motor form the model hierarchy and then click on 'label mode active choice'.
- there you will be avle to change the model from mapped to dynamic or vice versa.
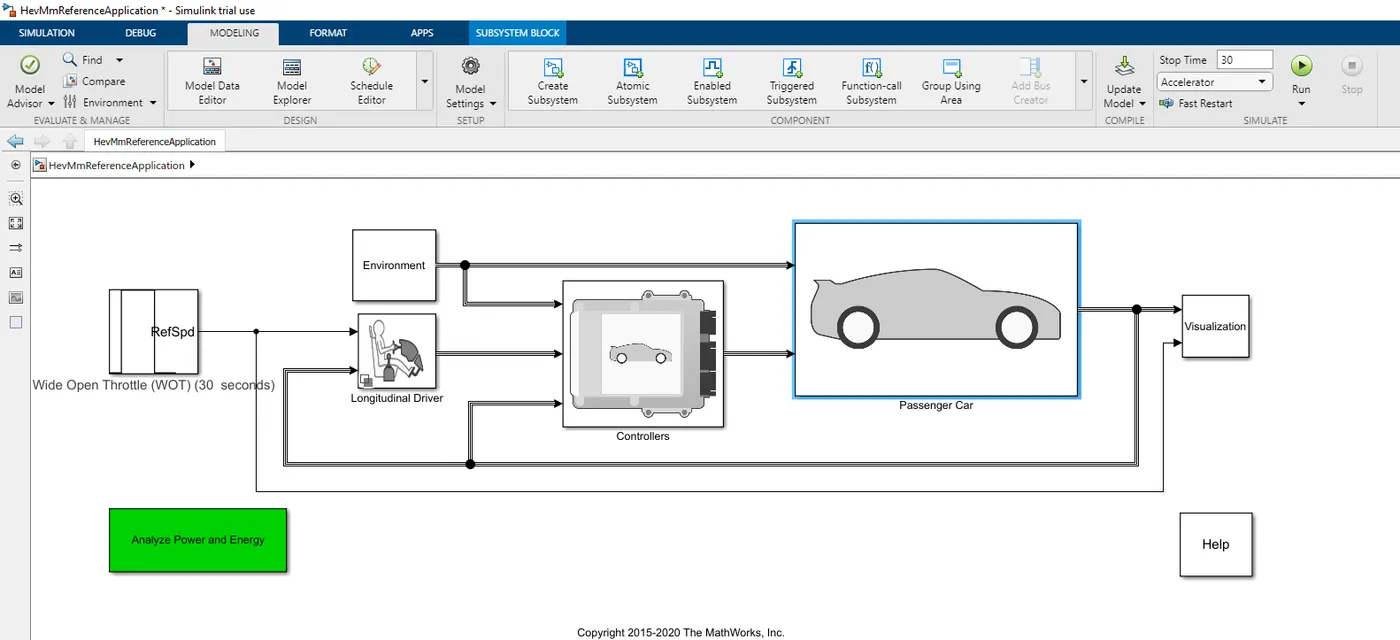
Inside the Model Explorer;
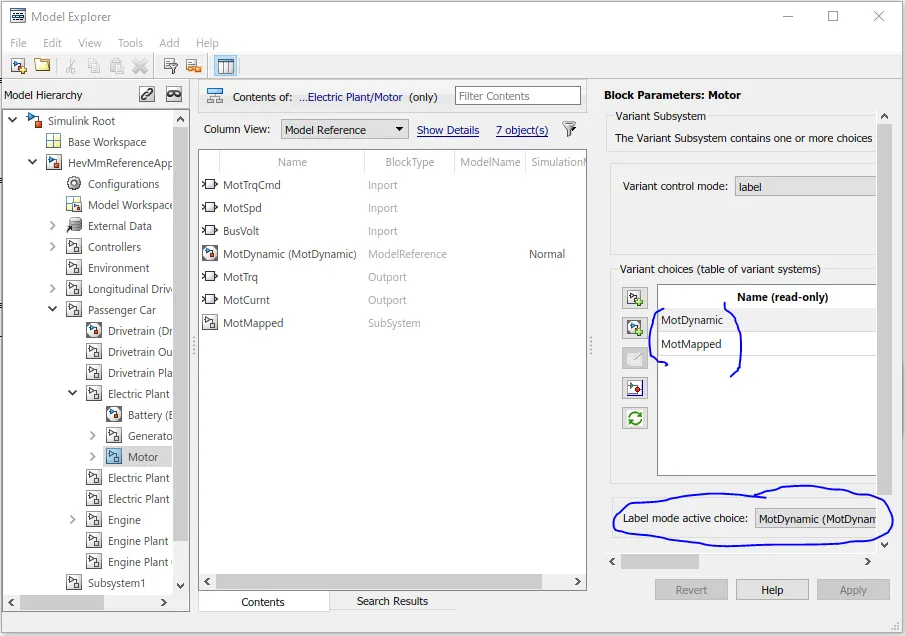
This method can be followed for both engine and generator as well.
2. Miles per gallon (MPG): It is a fuel economy rating determined by how far a car can travel on a gallon of gasoline or disel. Although the metric version would be kilometres per litre, MPG is adopted in many metric-system countries, like Canada.
While it is both cheaper and better for the environment to achieve a higher MPG rating, there is a curve, that the EPA calls the "MPG Illusion" that shows the cost-benefits of increasing MPG decrease with higher rating. For example, to travel 1,000 miles, a car that gets 10 MPG will require 100 gallons of fuel. Conversely, a car that gets 15 MPG will require 67 gallons of fuel. In this case, an increase of just 5 MPG cuts fuel consumption by 33%. When a car gets 30 MPG, however, increasing its mileage to 35 MPG will only save 5 gallons of fuel over 1,000 miles.
The unit of energy consumed is 33.7 Kilowatt hours without regard to the efficiency of conversion of heat energy into electrical energy, also measured in Kilowatt hours. The equivalence of this unit to energy in a gallon of gasoline is true if and only if the heat engine, generating equipment, and power delivery to the car battery are 100% efficient. Actual heat engines differ vastly from this assumption.
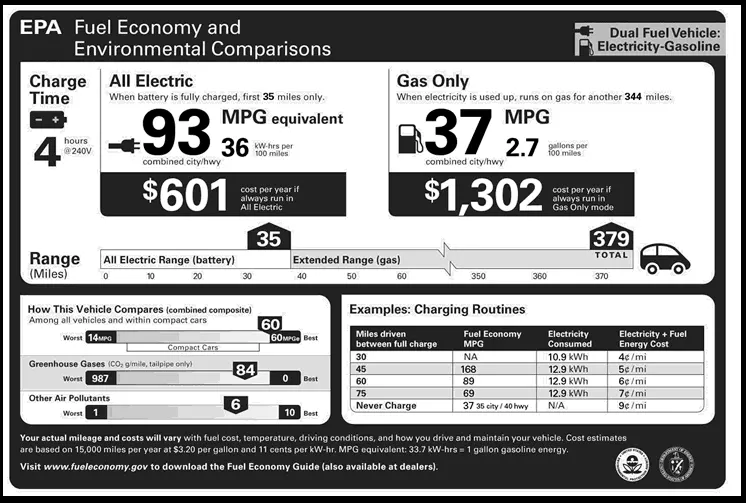
In the powertrain block set,there are blocks to calculate the miles per gallon for all types of vehicles;
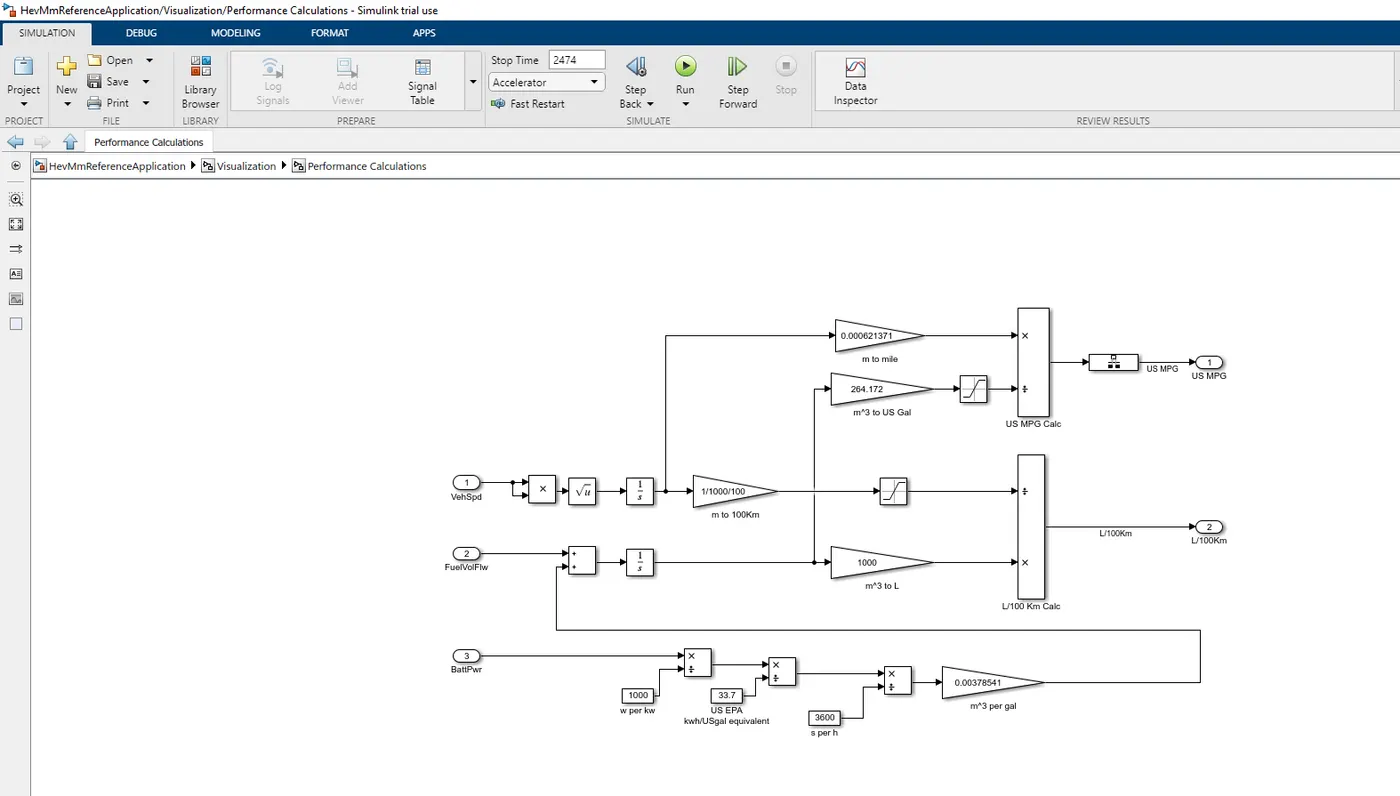
The inputs taken to calculate the miles per gallon and the equivalent battery energy required are the vehicle speed,fuel volume flow and the battery power.
Factors concidered to model the fuel flow;
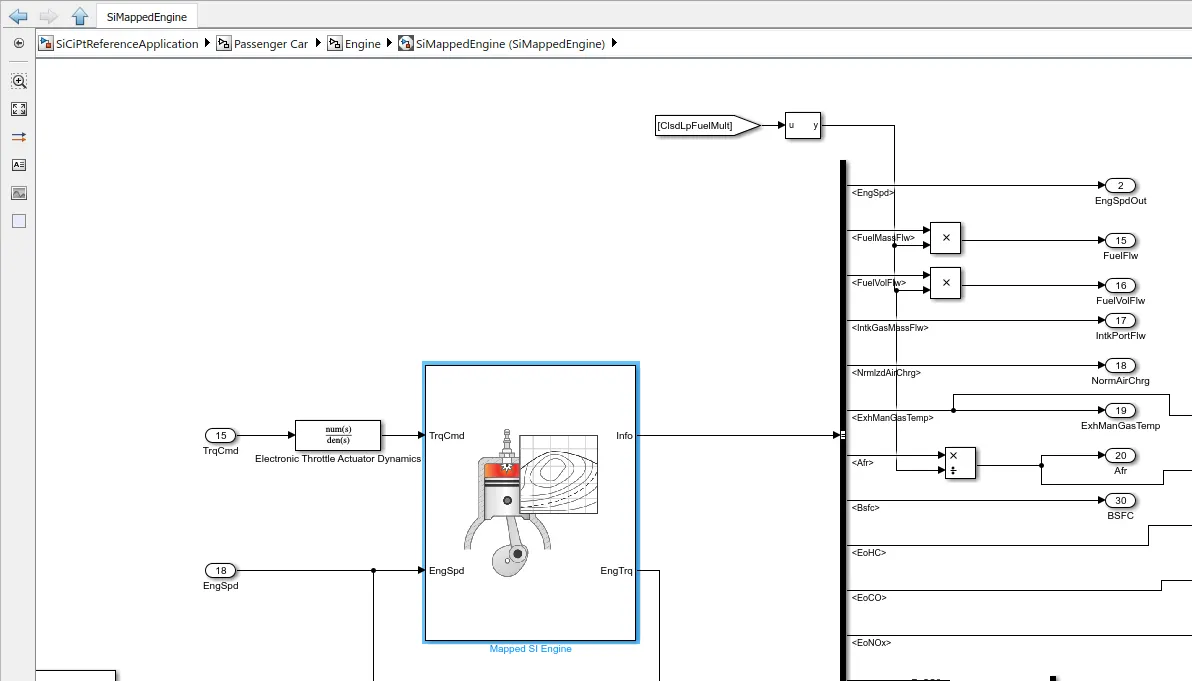
The fuel flow model is initiated from the engine block (Si mapped engine)
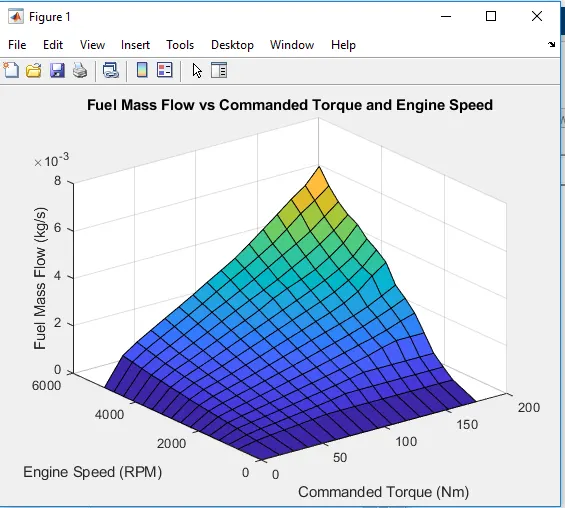
click on the engine block,then from the lookup table,go to fuel and then give plot fuel flow map.
FUEL FLOW MAP;
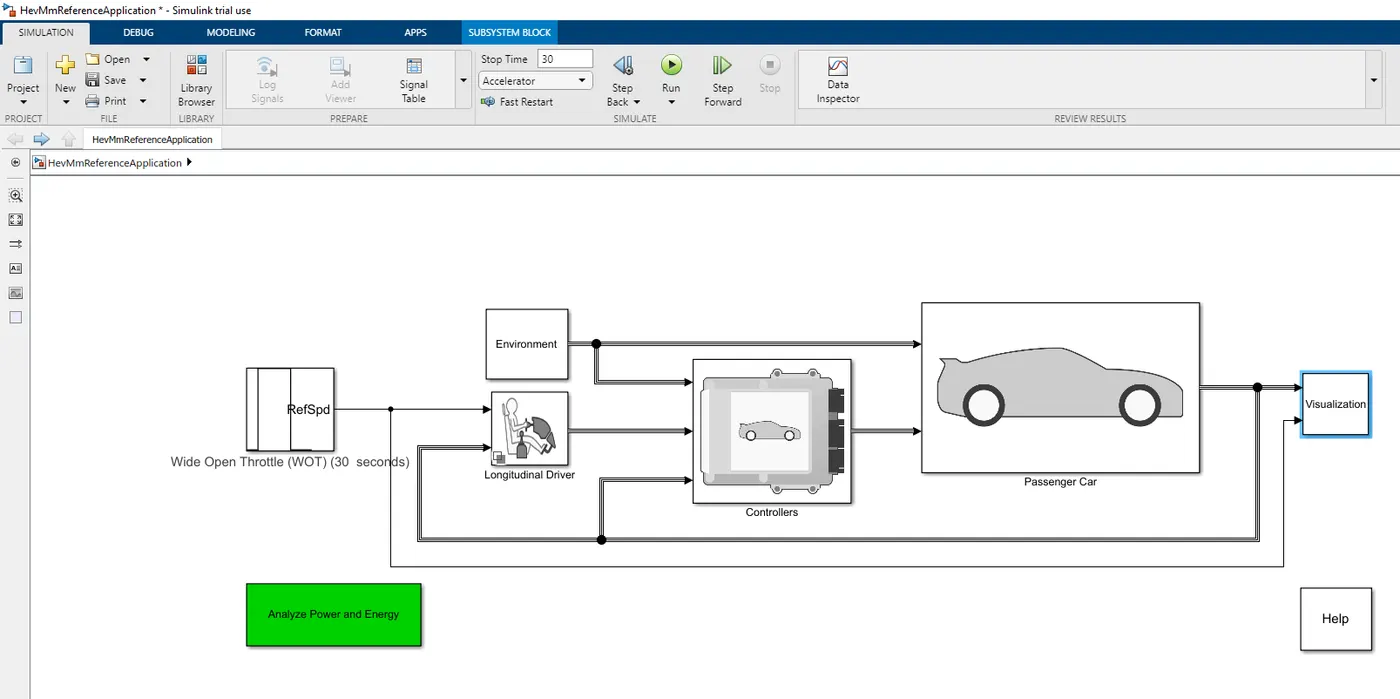
3. Run the HEV ReferenceApplication with WOT drive cycle. Change the grade and wind velocity in the environment block.
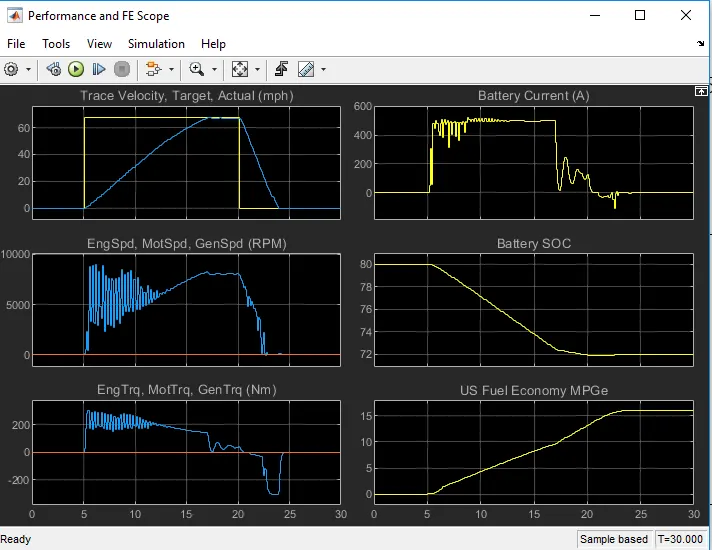
- without changing grade and wind velocity;
The Performance and FE scope;
2. After changing the grade and wind velocity in the Environment block;
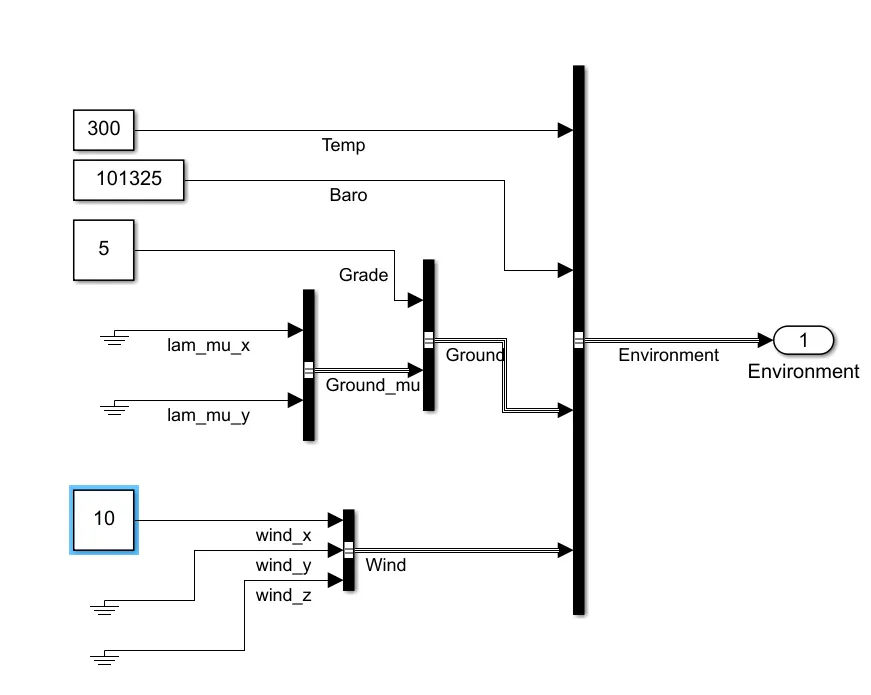
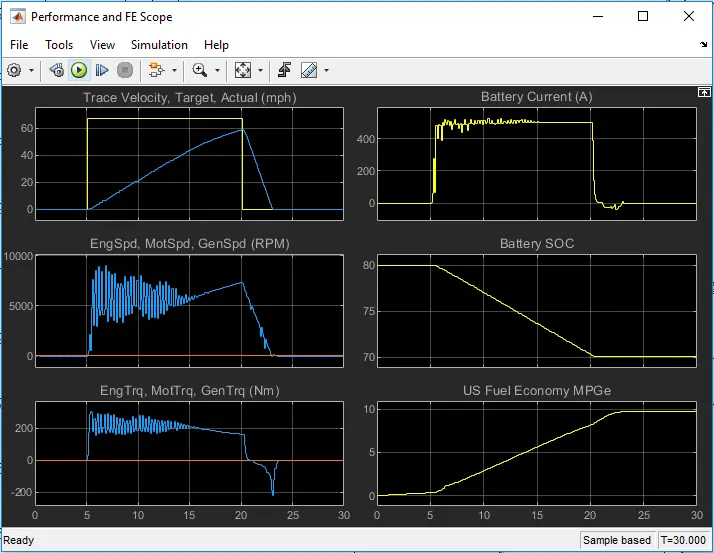
- In plot1 the torque obtained to calculate the velocity will be less compared to the default model velocity.
- In plot2 the motor speed and engine speed get High compared to the default model as we have given a grade value and the gradeability of the vehicle is determined.To achieve the speed, the motor requires more power to run the generator.
- Torque is greater in the plot3,as the wind velocity is specified and the frrictional force pressure is higher.
- In plot4 we can see that more battery power is required to produce more amount of torque,this is eventually passed on to the generator which can also act as a recharging source for the battery.
- State of charge (SOS) is not obtained in the initial drive condition,we see that it remains constant foer some time untill the slop drops(torque is reduced) and then when power is produced again,the SOS will start acting
- In plot6 we can see that the fuel economy is very high due to the wind velocity and gradeability and gives better results.
4. Keeping all other parameters same, compare the simulated results of hybrid and pure electric powertrains.
H E V :
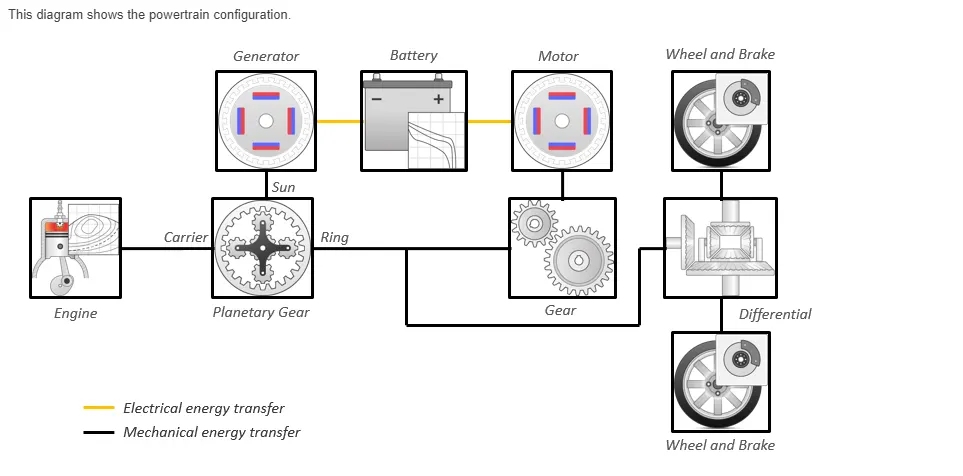
POWERTRAIN BLOCK:
RESULTS- INCLUDING WIND AND GRADE VALUES;
PURE E V :
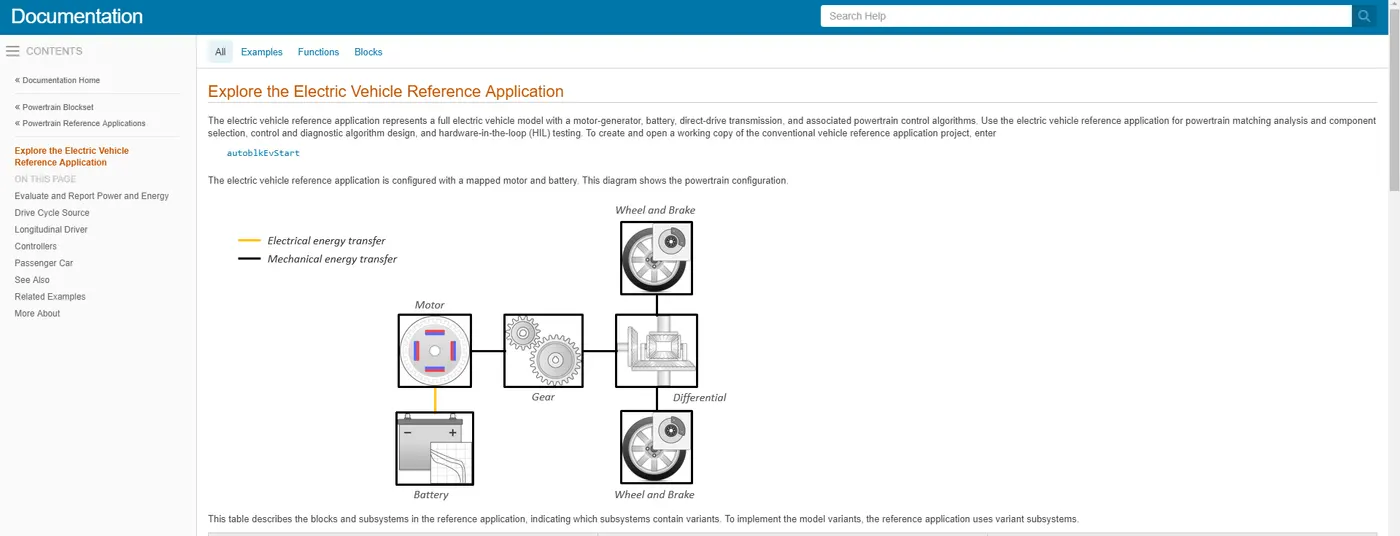
POWERTRAIN BLOCK:
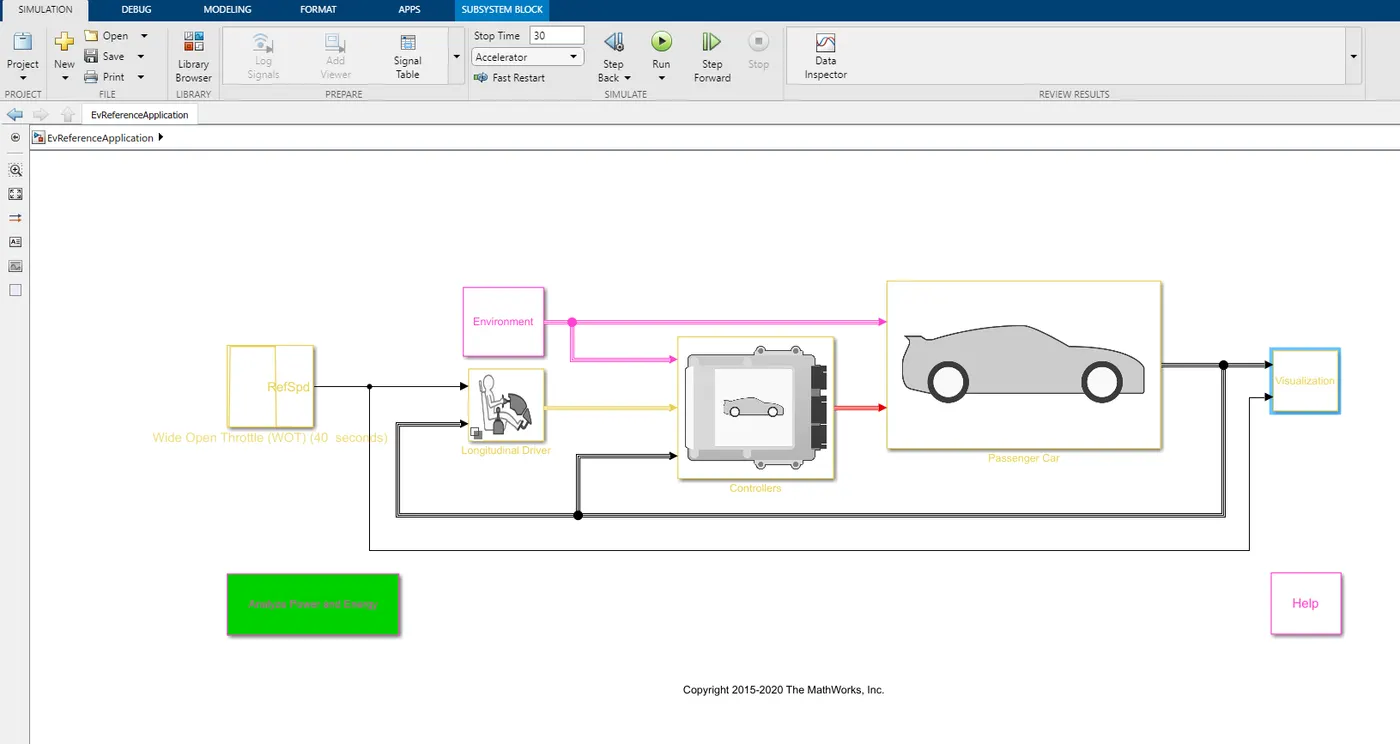
RESULTS- Without including grade and wind velocity;
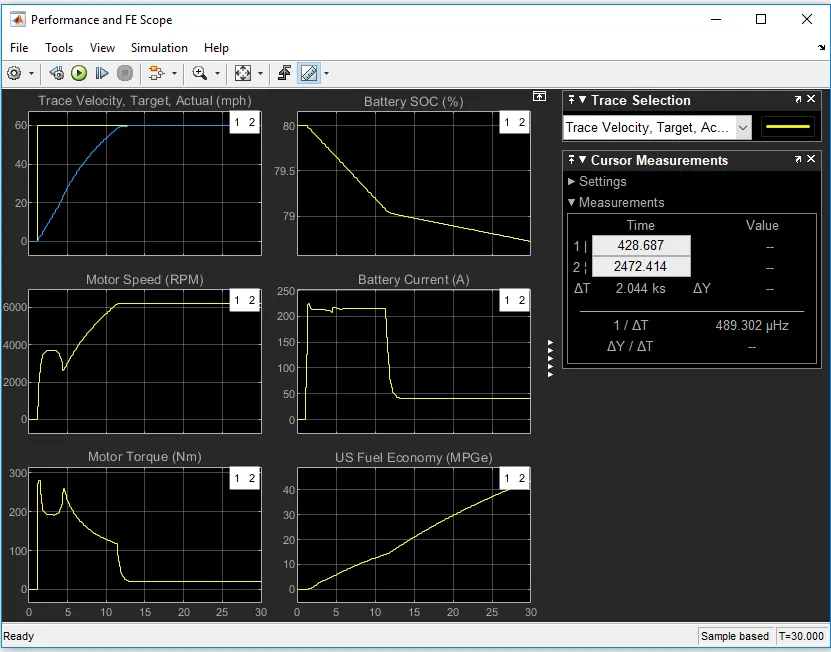
After including grade and wind velocity;
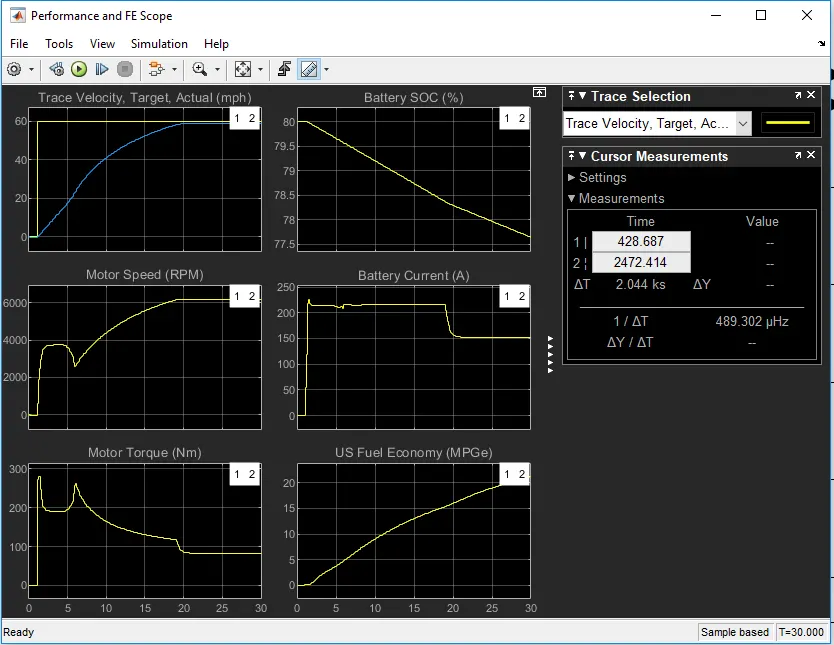
CONCLUSION: Thus we can conclude that,the pure electric vehicles (EV) give a better economic drive and 0% emission whereas, the hybrid Electric vehicles (HEV) produce little emissions and fuel economy is lesser compared to the EV's.