Week-4 Challenge WOT Condition Part-2
Mapped Model:
• The mapped model is one type where the data points are pre_assigned in lookup tables.
• The engine or motor torque required is sensed and the motor or engine block generates the requiered torque output just as required simply without considering the real time motor or engine, parameters
• The output values are stored for the corrresponding given input values of the engine motor and generator.
• The accuracy of this type is not that high but the simulation will be done in much less time as it does not run by real time parameters.
Dyanamic Model:
* The dyanamic model in other hand uses the combination of the outputs from various subsystems to generate the output.
* It runs by real time simulation where the required input from the drive cycle is taken and for that individival real time simulation gets performed and summing all the results of the subsystem gives the output for the simulation.
* As per the drive cycle requirements the initial Bus voltage ,current is given along with the vehicle feedback so that it runs the actual simulation at that particuclar moment throught the drive cycle.
* The accuracy of this model is very high as it considers the real outputs from all the subsystem to generate the output.
* The simulation will take very long time to complete as it has so many individual simulations running by all the subsystem of the engine,motor/generator.
Steps to select the Model Type:
i. In the powertrain blockset module we first need to select the vehicle type first wheather it is full electric , full engine or the type of hybrid vehicle.
ii. After that the Simulink model appears by showing the work flow blocks of the model.
iii. In that we need to go to Passenger Block Electric plant* EV Motor/Generator block.
iv. After this just right click and go to Variance Label mode Active choice MotorGenEV Mapped or Dyanamic.
2. How does the model calculate miles per gallon? Which factors are considered to model fuel flow?
Miles per gallon
• Miles per Gallon is a fuel economy rating determined by how far a car can travel on a gallon of petrol or Diesel for a Engine powered car.
• In case of an electric vehicle it tells us the energy which is equivalent that of a engine powered carto propel the car through a distance.
• The amount of Fuel Energy required to move a engine powered car through a distance is determined and then it is compared to the eqivalent amount of electric energy required to move the car throgh the same distance and is expressed as the miles per gallon.
• The powertrain blockset has a model that calculates the miles per gallon for all kinds of vehicle.
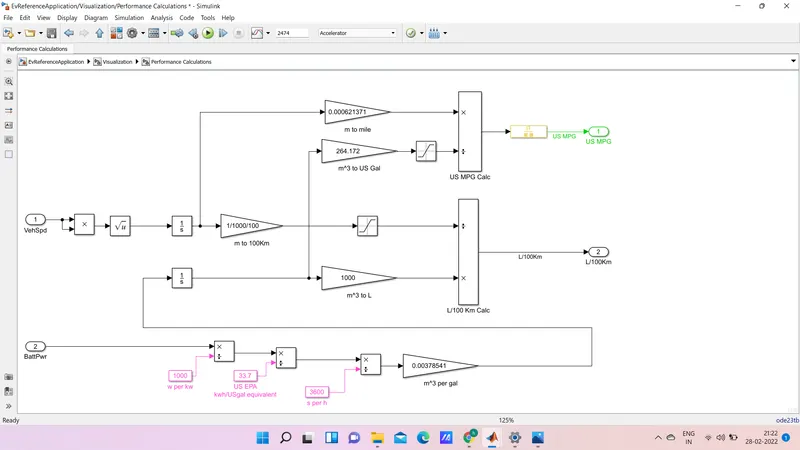
Vehicle Speed And Fuel Flow:

• The Vehicle speed is a important factor while considering the fuel consumption at that particular time,so to determine the fuel consumption throughout the drive cycle.
• To convert speed to Distance we can Integrate with time and we are doing the same of converting the velocity to get distance covered by integrating.
• Then the Fuel flow is expressed as the mass flow rate (i.e) the amount of fuel at each moment in Kg/Sec. Now integrating this will result in the mass of the fuel and by using this 1 we convert it to the volume and by multiply by 1000 to get it in Litres.
• By comparing the two results we can get the amount of litre consumed to Run for 100km.
Baterry Power

• The amount of Energy from battery power required to propel the vehicle Equivalent to that of the Engine is calculated here.
• The battery power is given in watts and it is converted to Kw by dividing with 1000.
• Then we convert the power into energy by multiplying with the time into KWh.
• Then we convert the Energy from kWh to equivalent energy in US gallon of automotive gasoline by dividing with 33.7. since we get the energy in US Gallons equal in KWh we are trying to get the energy of equivalent LIS Gallons per seconds and we do this by dividing with 3600 and we convert the hour to seconds.
• Then multiplying with 0.00378541 we convert the US Gallons per sec to the volume of the fuel flow in (mA3/ s) and then we multiply with 739 (California Phase II Gasoline density) (i.e) mA3/s * kg/mA3 which gives the result as mass flow rate kg's.
• Then finally the Battery energy equivalent in kg/s is given as a input for the fuel flow parameter in order to find the equivalent US Gallons enegy and estimate the Miles per Gallons.
3. Run the HEV ReferenceApplication with WOT drive cycle. Change the grade and wind velocity in the environment block. Comment on the results.
Hybrid Electric Vehicle:
• A hybrid electric vehicle (HEV) is a type of hybrid type that combines a conventional Internal combustion engine (ICE) system with an electric propulsion system
• The presence of the electric powertrain is intended to achieve either better fuel economy than a conventional vehicle or better performance.
• Example of HEV is Toyota Prius.
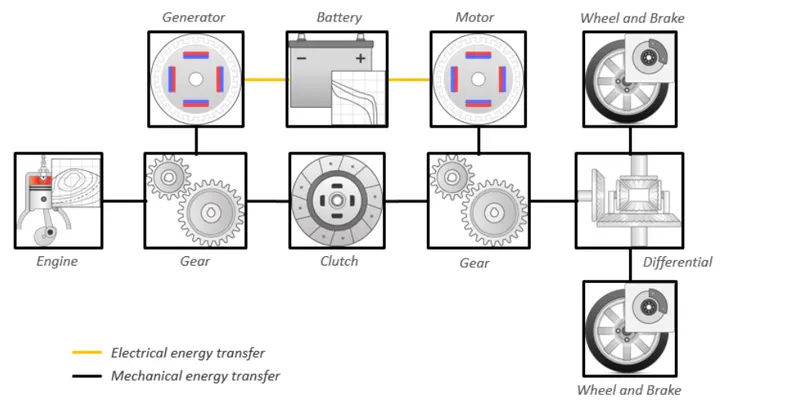
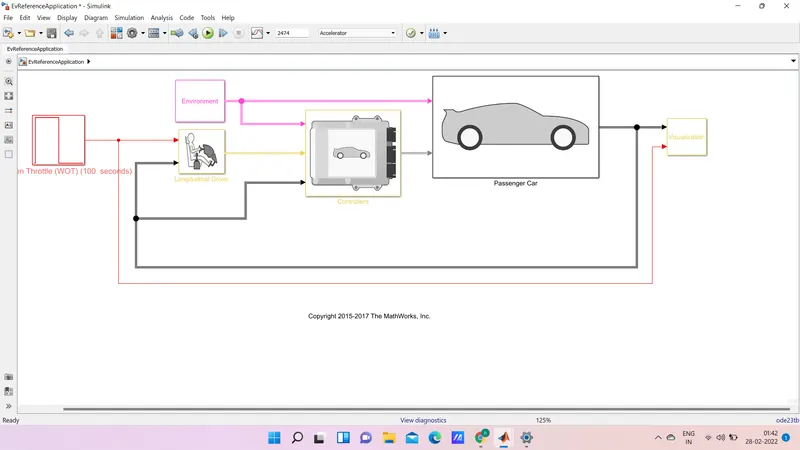
• In the powertrain blockset we have selected the hybrid electric vehicle and this is the simulink model . • Here we can select the input parameters as we wish and we can Run the simulation to check the results.
Case2 Simulation Condition:
The simulation is done for Hybrid electric vehicle with Wide open Throttle Drive cycle.
The Total cycle time = 100 seconds
The Top speed of this cycle = 80 mph
Time to start deceleration = 50seconds
The Grade angle - 8 Degrees
The wind velocity = 10 m/s.
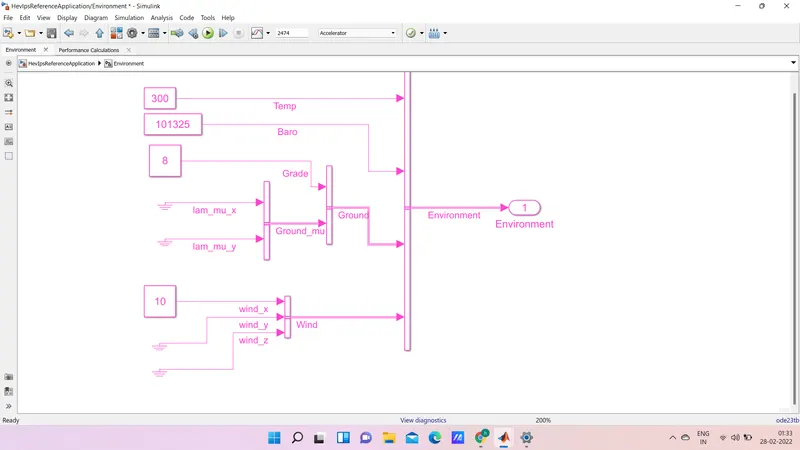
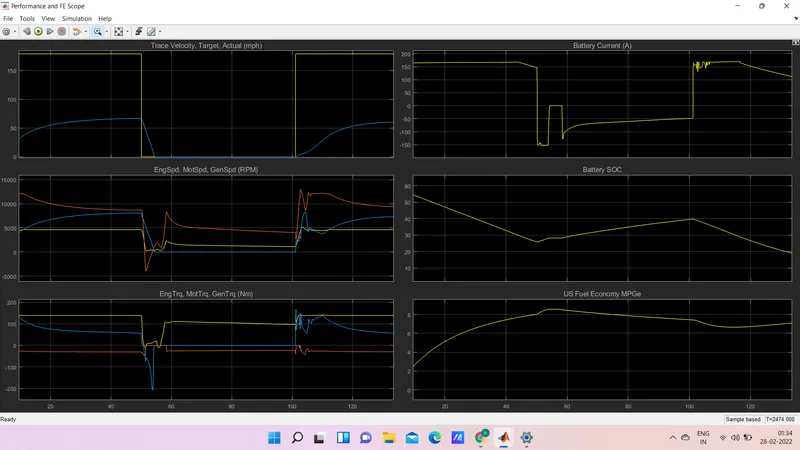
• In all the results we can observe some changes from the previous case
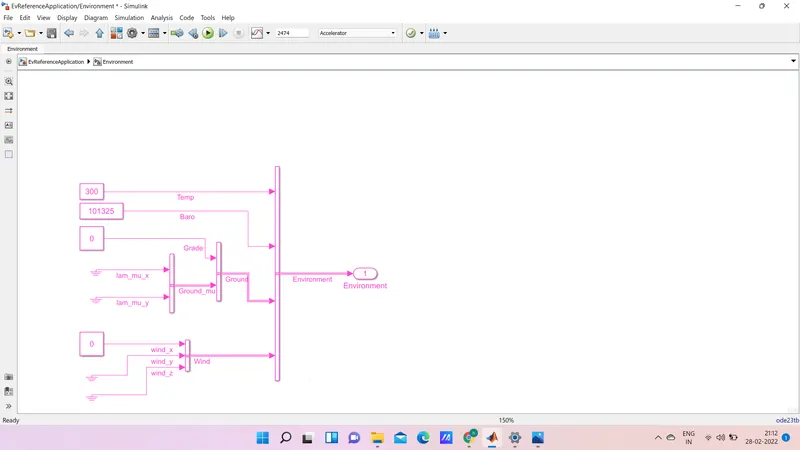
• Though the vehicle parameters and the drive cycle are the same ,here we have considered some changes in the environment blocks by adding some hill climb angles and wind velocity.
• The changes in the results are given below.
plot 1:
Shows the velocity of the vehicle with respect to the Drive cycle data with the Time scale on the x axis.
The top speed of 80 mph cannot be achieved as we have some additional forces acting and so the car can only run upto 67.2 mph
The acceleration time to reach top speed of 67.2 mph = 44.5 seconds
The deceleration time from 80 to minimum = 5.06 seconds\
plot 2:
Shows the changes in speed of the Engine,motor and Generator in Rpm throughout the drive cycle.
Peak Engine speed = 4676 Rpm Peak
Motor speed = 8103.5 Rpm
Peak Generator speed = 12858.5 Rpm
plot 3:
Shows the Torque characteristics and its changes of engine,motor and generator in (Nm) throughout the drive cycle.
Peak Engine torque = 139.6 Nm ;
Peak Motor torque = 206.4 Nm
Peak Generator torque = 48.2 Nm
plot 4:
Shows the Battery Current values (A) and its changes for various acceleration inputs as per the Drive cycle.
The peak current discharge from the battery = 167.6A
The peak current charging to the battery = -152.46 A
Plot 5:
Shows the Battery state of charge SOC (%) and its changes corresponding to the driving inputs.
The state of charge decreased from 60% to 25.98 % of charge in a time period of 49.3 seconds , for the specified driving conditions.
Plot 6:
Shows the Fuel Economy as Mile per Gallons for the corresponding input driving conditions.
The maximum miles that the car can run per gallon of fuel equivalent = 17.93 Miles,for the given vehicle at the specified driving conditions.
Observation:
• The simulation results for both the cases is found and we can see that the simulation 1 without the inclusion of hill climbing conditions and the wind drag velocity is much more efficient when compared to the simulation which includes the hill climbing conditions and the wind drag velocity.
• The vehicle was not able to achieve the required top speed though using the highest possible current discharge of that same battery used before.
• The state of charge also shows that the discharge is also high compared to the simulation 1
• The Fuel Economy is also down to half of the previous simulation.
• So one can say, it is evident that the efficiency of no load vehicle is high compared to the vehicle with additional loads acting on them and also we have visualized this using the Powertrain blockset.
• Now comparing both the Pure electric and Hybrid electric vehicle with the given conditions in a simulation to observe the behaviour of both the type.
EvReferenceAppkabon ►
Case 2
Simulation Condition:
The simulation is done for pure electric & Hybrid electric vehicle with Wide open Throttle (WOT) Drive cycle.
The Total cycle time = 100 seconds
The Top speed of this cycle = 80 mph
Time to start deceleration = 50 seconds
The Grade angle = 0 Degrees
The wind velocity = 0 m/s.
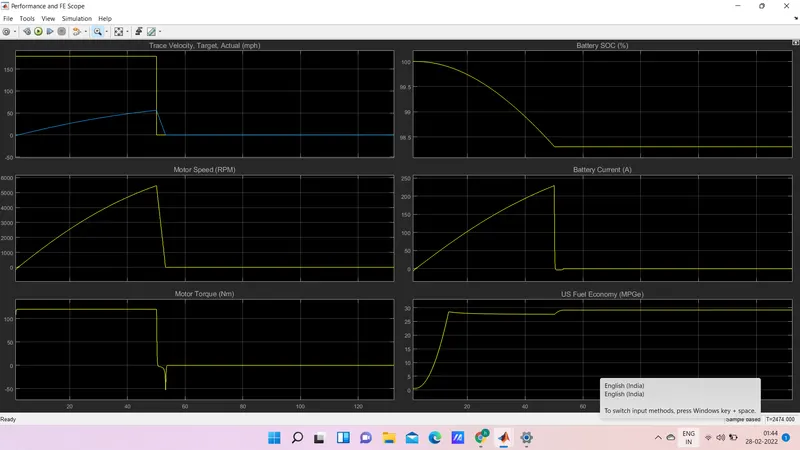
plot 1: Shows the velocity of the vehicle with respect to the Drive cycle data with the Time scale on the x axis. The top speed of 80 mph cannot be achieved as we have some additional forces acting and so the car can only run upto 108.9mph The acceleration time to reach top speed of 108.9 mph = 50.2 seconds The deceleration time from 80 to minimum = 9.8 seconds
plot 2: Shows the changes in speed of the Motor in Rpm throughout the drive cycle. Peak Motor speed = 1123 Rpm
plot 3: Shows the Torque characteristics and its changes of Motor in (Nm) throughout the drive cycle. Peak Motor torque = 260 Nm
plot 4: Shows the Battery Current values (A) and its changes for various acceleration inputs as per the Drive cycle. The peak current discharge from the battery = 216.8 A The peak current charging to the battery = -173.7 A
Plot 5: Shows the Battery state of charge SOC (%) and its changes corresponding to the driving inputs. The state of charge decreased from 80% to 75.5% of charge in a time period of 50.3 seconds , for the specified driving conditions.
Plot 6: Shows the Equivalent Fuel Economy as Mile per Gallons for the corresponding input driving conditions.Here there is no fuel in pure electric vehicle however this gives equivalent battery energy required that of the fuel energy,and calculates the Fuel efficiency.The maximum miles that the car can run per gallon of fuel equivalent = 21.45 Miles,for the given vehicle at the specified driving conditions.
Observation(Pure Electric VS Hybrid Vehicle With Same Load Conditions):
1. The electric vehicle when compared with hybrid electric vehicle with the same environmental and Drive cycle conditions results in less top speed achievement .The electric vehicle produces more values of Motor speed and motor torque compared to the hybrid vehicle's motor alone,but hybrid vehicle when it combines the torque of both motor and its engine it is higher than the electric vehicle's torque.This is responsible to pull the Hybrid car at higher top speed compared to the pure electric.
2. As the pure electric car here uses Lithium-ion battery compared to the Nickel metal hydride battery the discharging capacity and the rate o charging is higher in the pure electric car. As it is able to discharge in a fast rate the motor can produce high amount of torque instantly compared to the hybrid vehicle. Also the state of charge shows the battery efficiency of the pure electric to be higher than the hybrid vehicle and this is also due to the battery type used in these cars.
3. The efficiency of the Electric car is higher than the hybrid car which is evident from the miles per gallon numbers of both of these cars. 4. Electric vehicle produces zero emissions whereas the hybrid one's produce waste gas emission.These are some of the observations from the comparision of the above simulations using Powertrain Blockset.