Week-4 Challenge WOT Condition Part-2
Aim: To study the power train block set and answer the following questions:
- What is the difference between mapped and dynamic model of engine, motor and generator? How can you change model type?
- How does the model calculate miles per gallon? Which factors are considered to model fuel flow?
- Run the HEV ReferenceApplication with WOT drive cycle. Change the grade and wind velocity in the environment block. Comment on the results.
- Keeping all other parameters same, compare the simulated results of hybrid and pure electric powertrains.
METHODOLOGY:
Introduction:
Powertrain Blockset is used to create models of automotive powertrains, including gasoline, diesel, hybrid, and electric systems. It encompasis library for simulating engine subsystems, transmission assemblies, traction motors, battery packs, and controller models. It also has a dynamometer model for virtual testing and standard model architecture to perform design tradeoff analysis and component sizing, control parameter optimization, and hardware-in-the-loop testing. Customize models can be developed by parameterizing components in reference application with user data or superseding a subsystem with our model. Support file is MDF to calibration tools for data import.
- What is the difference between mapped and dynamic model of engine, motor and generator? How can you change model type?
| Mapped Model | Dynamic Model |
| In Mapped model the simulation consists of data that is prebuilt in the lookup table is dealing with mapped data or mapped model. | In dynamic model the simulation consists of data that is not prebuilt but it takes the real-time data by calculating every small individual like the movement of vehicle, drag, speed, velocity etc. which are dynamic data or dynamic model for engine system. |
| Shorter computation time and less complex | Longer Computation time and complexity is high |
| Mapped Model Engine - Represents Macro behaviour of engine as a function of load and engine speed | Mapped Model Engine - Engine is decomposed into induvidual component models and performance is calculated by leveraging vehicle specifications |
| Mapped Model Motor - Represents Macro motor behaviour as a set of lookup tables of efficiency, torque curve, rpm, power and temperature | Mapped Model Motor - Motor is decomposed into induvidual component modes and performance is calculated by leveragings user specifications |
| Mapped Model Generator - Represents Macro generator behaviour as set of lookup tabes of generator efficiency and motor torque | Mapped Model Generator - Dynamic model of generator is decomposed into induvidual component models and performance is calculated by leveragings user specifications |
To switch between mapped and dynamic models
open power train module-->click passenger vehicle-->select engine-->Right click on motor-->select subsystem-->convert to-->variant subsystem
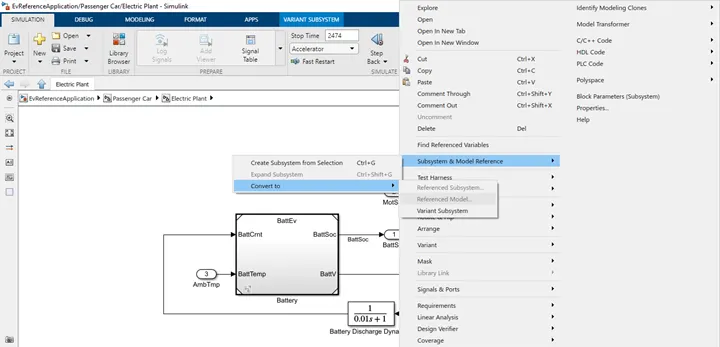
Open model explorer--> change to dynamic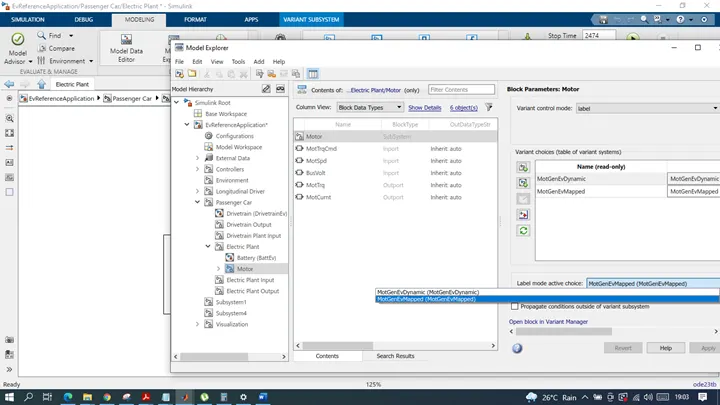
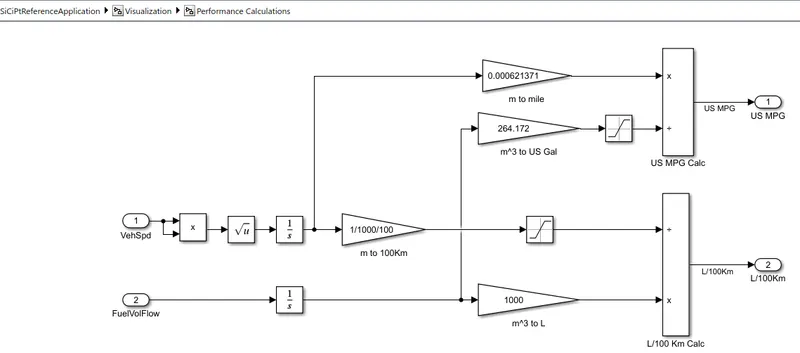
2. How does the model calculate miles per gallon? Which factors are considered to model fuel flow?
In this case model calculate miles /gallon such that, it uses the battery power in Watts and FuelFlow in Kg and Vehicle Speed in seconds and Vehicle Speed is integrated to get the displacement or Distance in meters. Miles/ gallon says how far car can travel using one gallon of gasoline or diesel whereas in electec vehicle, it is a measure of how much electrical energy is consumed by the battery pack to travel a definite distance.
Conventional Vehicle
Hybrid Electric Vehicle
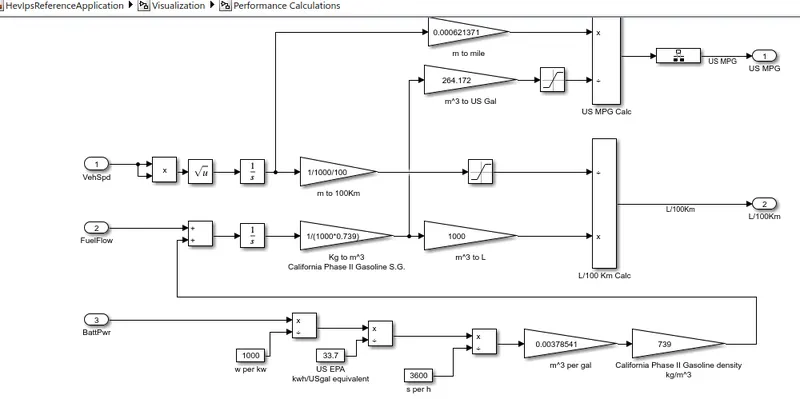
Inference: Calculate Miles Per Gallon:
| Inputs for Mile per Gallon | Description | Unit |
| Battery Power | Amount of energy from battery to propel the vehicle Equivalent to that of the Engine in watts | watts |
| Battery Power in kw | Battery power in watts/1000 | kw |
| Battery Power in kwh/US gallon | Battery Power in kw divide by 33.7 | kwh/US gallon |
| Battery Power in kws/US gallon | Battery Power in kwh/US gallon divide by 3600 | kilo watt sec |
| Battery Power in kg/m^3 | Battery power in kilo watt sec is multiplied by 0.00378*739 | kg/m^3 |
| Fuel flow kg/s | It is is expressed in terms of mass flow rate = fuel flow + battery power ie, the volumetric flow rate and multiply this figure by the density of that fluid to get mass flow rate | kg/s |
| Fuel consumed kg | Integrate the mass flow rate to get the fuel consumed | kg |
| Fuel consumed in m*3 | Multiply fuel consumed in kg with 1/(1000*0.739) | m^3 |
| Fuel consumed in US Gal | Multiply Fuel consumed in m*3 with 264.172 | US Gallons |
| Vehicle Speed | Based on fuel consumption at a specific time we can determine the fuel consumption throughout the driving cycle | m/s |
| Distance in m | Integrate the velocity to get distance | m |
| Distance in mile | multiply with 0.000621371 | mile |
| Milles per Gallon | vehicle speed in miles/(Batter power + fuel power in gallons) | Mile per Gallon |
2.2 Which factors are considered to model fuel flow?
- Fuel Mass flow rate
- Vehicle speed
- engine speed
- Fuel map (Engine torque)
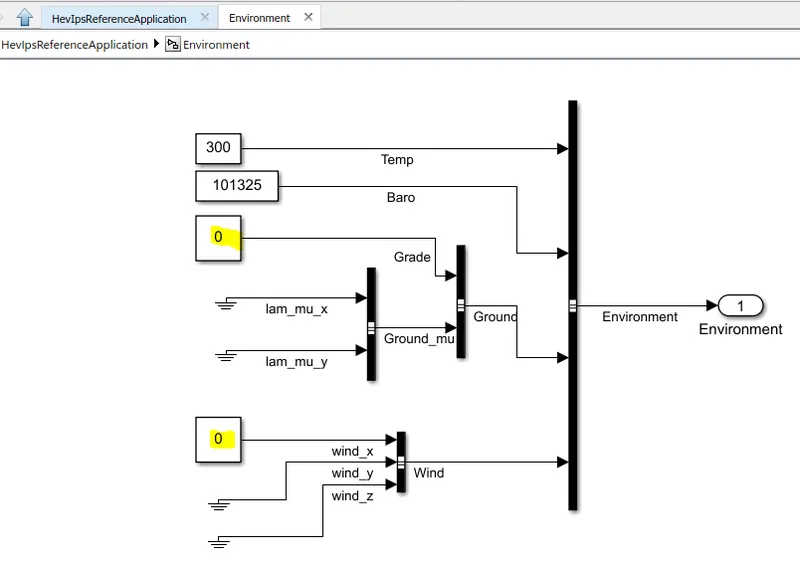
3. Run the HEV Reference Application with WOT drive cycle. Change the grade and wind velocity in the environment block. Comment on the results.
Introduction:
HEV is a combination of conventional IC engine system + electric propulsion system hybrid vehicle drivetrain. Electric powertrain is used in conjunction with IC engine system to achieve fuel economy or better performance.
Architecture
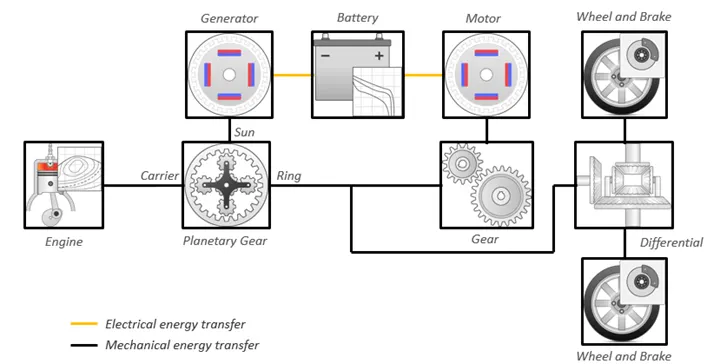
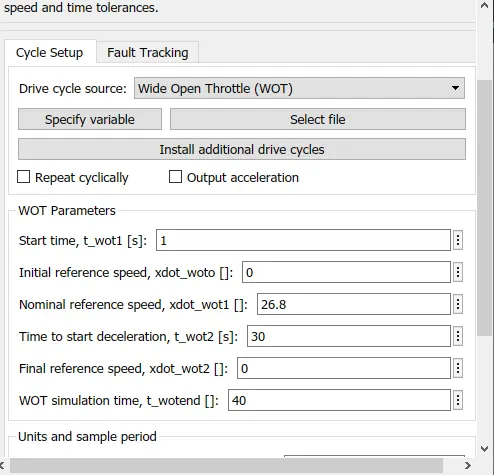
Steps to Run the HEV Reference Application with WOT drive cycle
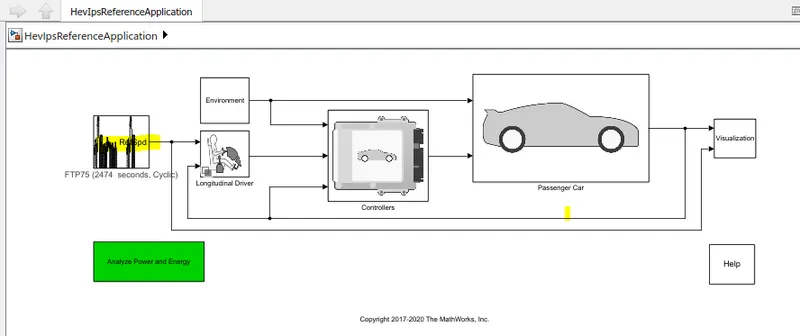
Case 1 W/O Change the grade and wind velocity in the environment block
| Input | |
| drive cycle | WOT |
| Application | HEV Input Power-Split Reference Application |
| other Parameters | Default |
| S.No. | Grade | Wind Velocity | Total Cyce time (sec) | Time to start deceleration (sec) |
| CASE 1 | 0 | 0 | 60 | 30 |
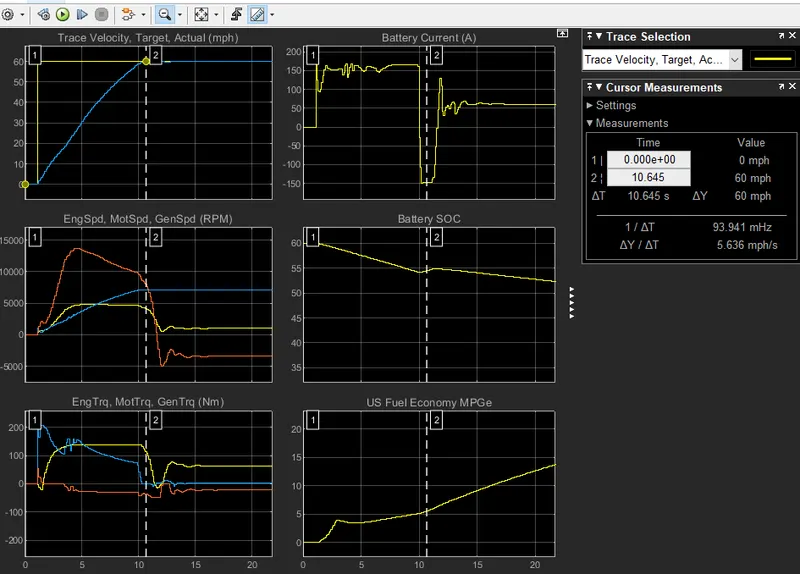
Inference:
| Output | Plot Description | Inference |
| Plot 1 | Trace Velocity, Target, Actual (mph) | Top Speed= 60mph Acceleration time to reach top speed= 10.645sec Deceleration time from top to minimum= 4.889sec |
| Plot 2 | Engine speed, motor speed, Generator speed (RPM) | Peak engine speed= 4778 rpm Peak Motor speed= 7100 rpm Peak Generator speed= 13722 |
| Plot 3 | Engine Torque, motor Torque, Generator Torque (Nm) | Peak engine Torque= 138.75 Nm Peak Motor Torque= 203.09 Nm Peak Generator Torque= 55.121 Nm |
| Plot 4 | Battery Current in Ampere | Peak Current Discharge = 165.78A Peak current Charge =147.49A |
| Plot 5 | SOC | SOC from 60% to 52.7 in 60 sec |
| Plot 6 | Fuel Economy MPGe | Fuel consumption increases till the engine obtains max speed (till 11 sec) after that the speed is constant (duration of 30 sec) and then speed decreases consequently fuel consumption also decreases and speed remains constant again at lower region (12 sec). Then same cycle repeats. |
| S.No. | Grade | Wind Velocity | Total Cyce time (sec) | Time to start deceleration (sec) |
| CASE 2 | 8 | 10 | 60 | 30 |
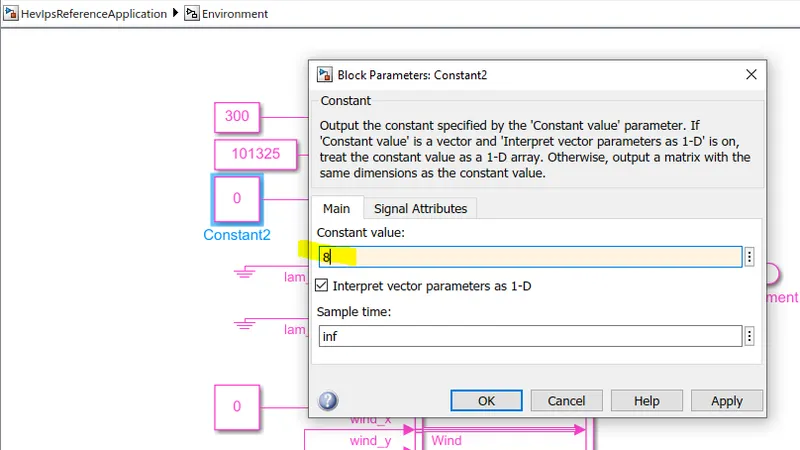
Results:
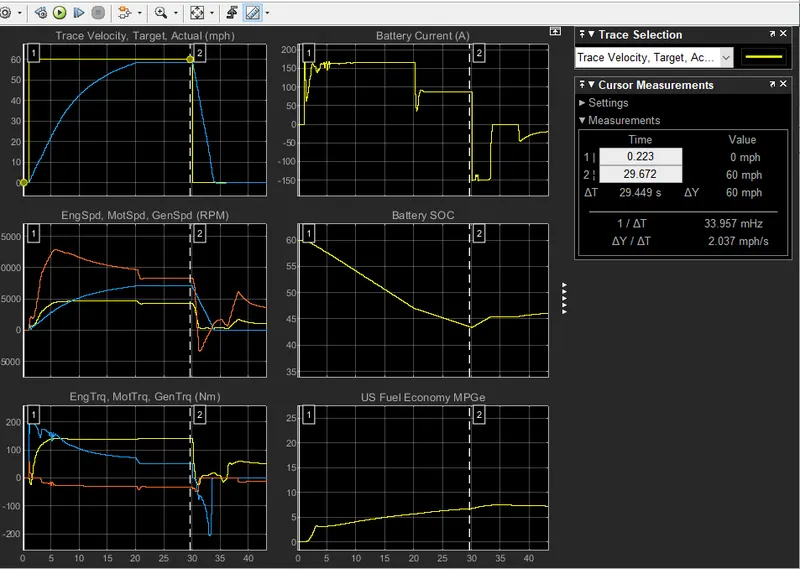
Inference:
| Output | Plot Description | Inference |
| Plot 1 | Trace Velocity, Target, Actual (mph) | Top Speed= 60mph Acceleration time to reach top speed= 20.153 sec Deceleration time from top to minimum= 4.759 sec |
| Plot 2 | Engine speed, motor speed, Generator speed (RPM) | Peak engine speed= 4659 rpm Peak Motor speed= 7059 rpm Peak Generator speed= 12852 rpm |
| Plot 3 | Engine Torque, motor Torque, Generator Torque (Nm) | Peak engine Torque= 139.41 Nm Peak Motor Torque= 204.89 Nm Peak Generator Torque= 57.69 Nm |
| Plot 4 | Battery Current in Ampere | Peak Current Discharge = 165.27 A Peak current Charge =-150.09 A |
| Plot 5 | SOC | SOC from 60% to 47.27% in 60 sec |
| Plot 6 | Fuel Economy MPGe | Fuel consumption increases till the engine obtains max speed (till 22.17 sec) after that the speed is constant (duration of 8 sec) and then speed decreases consequently fuel consumption also decreases and vehicle is at low speed (for next 26 sec )Then same cycle repeats. |
Comparison Inference:
It is envisaged from case 2 that
- Due to wind velocity and Gradeability the vehicle was unable to meet targeted speed. Case 2 takes longer acceleration time
- Maximum speed achieved by the motor is less due to the resistance offered by grade angle & wind velocity, while in case of engine & generator it is little bit lesser than case 1 but still it is negligible.
- Has almost the same Battery current and we have the same max capacity in both the cases.
- Has higher SOC compared to Case 1 due to the resistance offered by grade angle & wind velocity.
Thus gradeability & wind resistance causes the vehicle to attain top speed @ larger accelaration time at same battery capacity & MPGe achieved is also less/vehicle becomes less economic.
4. Keeping all other parameters same, compare the simulated results of hybrid and pure electric powertrains.
| Input | |
| drive cycle | WOT |
| Application | Electric Vehicle Application |
| other Parameters | Default |
| S.No. | Grade | Wind Velocity | Total Cyce time (sec) | Time to start deceleration (sec) |
| CASE 3 | 8 | 10 | 60 | 30 |
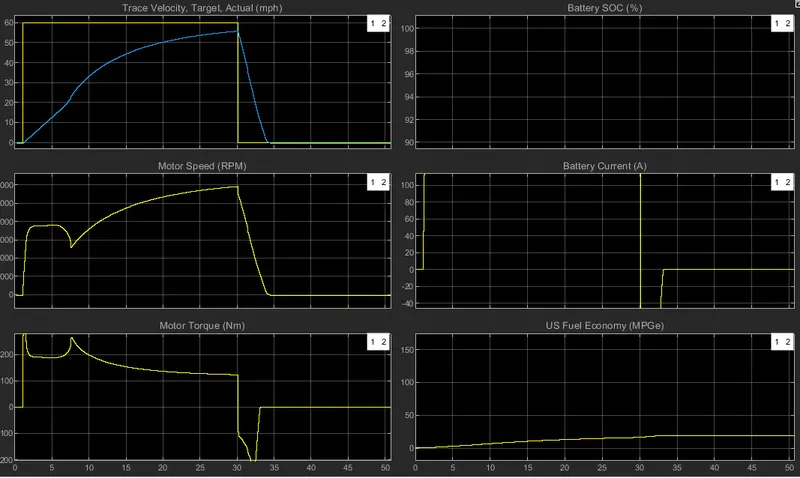
| Output | Plot Description | Inference |
| Plot 1 | Trace Velocity, Target, Actual (mph) | Top Speed= 55.6 mph Acceleration time to reach top speed= 29.96 sec Deceleration time from top to minimum= 4.802 sec |
| Plot 2 | Engine speed, motor speed, Generator speed (RPM) | Peak Motor speed= 5914 rpm |
| Plot 3 | Engine Torque, motor Torque, Generator Torque (Nm) | Peak Motor Torque= 280 Nm |
| Plot 4 | Battery Current in Ampere | Peak Current Discharge = 215.6 A Peak current Charge =-153.15 A Negative value is due to regeneration |
| Plot 5 | SOC | SOC from 80% to 77.5% in 60 sec |
| Plot 6 | Fuel Economy MPGe | Fuel consumption increases till the engine obtains max speed (till 30) and then speed decreases suddenly and remains constant at that level. |
Inference:
- The top speed actual of HEV is higher than Pure EV.
- Torque of HEV is higher than EV since it combines both motor and Engine Torque whereas EV has only motor Torque.
- Rate of charging and discharging (higher torque can be produced) is higher in Pure electric vehicle due to lithium ion batteries
- Battery Efficiency of pure electric is higher than HEV which is evident in Battery SOC Plot.