Week-4 Challenge WOT Condition Part-2
Study 1-
Aim- What is the difference between mapped and dynamic model of engine, motor and generator? How can you change model type?
Answer-
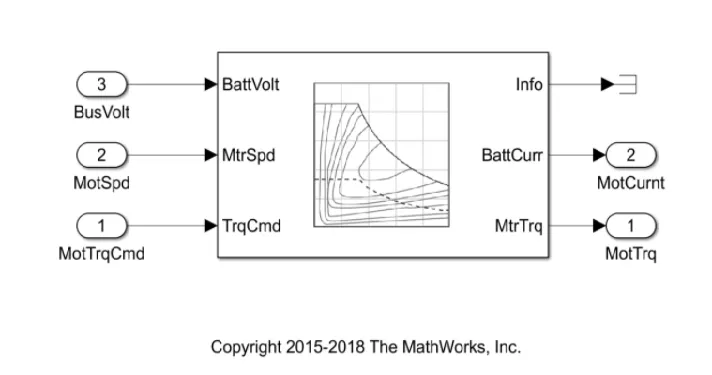
Mapped engine,motor and generator-
- Mapped model is one type where data points are pre assigned in look up tables,the table provides overall engine, generator,motor characteristics.
- The engine or motor torque that is required is sensed and the motor or engine generates this required torque output without considering the real time parameters.
- Mostly used for quasi-steady state simulations.
- Less time is required and also the accuracy is low.
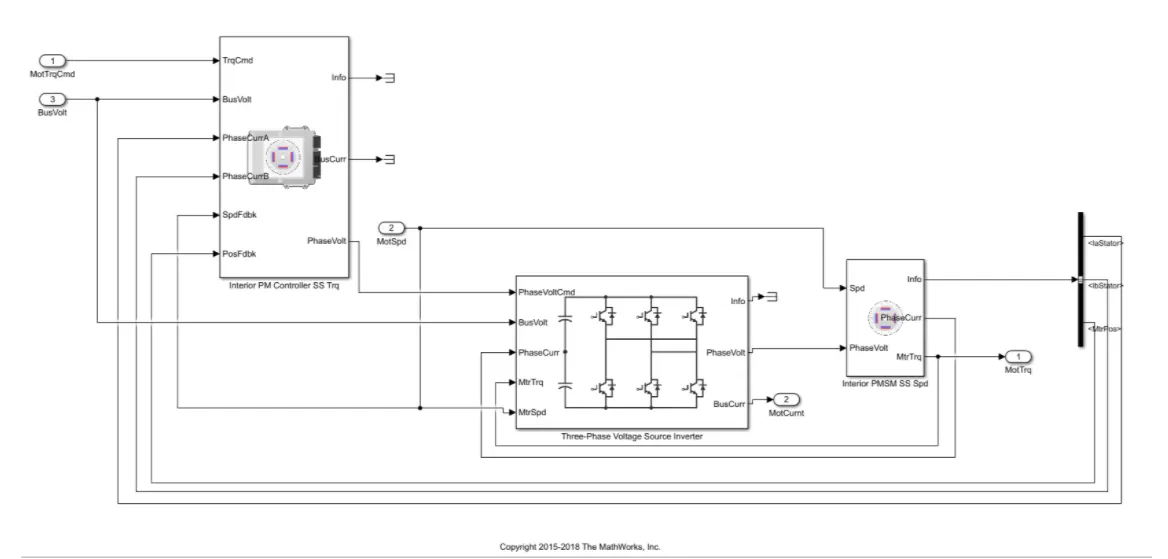
Dynamic model of engine,motor and generator-
- Dynamic model combines the output of various sub-systems to generate the output.
- Used when we need more detailed dynamic model and have component level data and to analyse of impact of individual components on overall performance.
- Accuracy is high as it considers the real outputs and it takes more simulation time.
Steps to select model type-
In the power train blockset module ,select vehicle type wether electric ,HEV etc
1.After opening the model -> got to passenger block -> electric plant for motor/generator.
2.Go to engine plant for engine variant selection ,now right click -> select variant -> label mode active choice ->
select required mode (mapped / dynamic).
Study2-
AIM-How does the model calculate miles per gallon? Which factors are considered to model fuel flow?
Answer-
- Miles per gallon is a fuel economy rating determined by how far a car can travel on a gallon of petrol or disel for engine powered.
- In case of of electric car it says us the the enegery which is equivalent to that of a engine powered car to drive to a certain distance.
The power train blockset has a model that caluclates the miles per gallon for all kinds of vehicles.
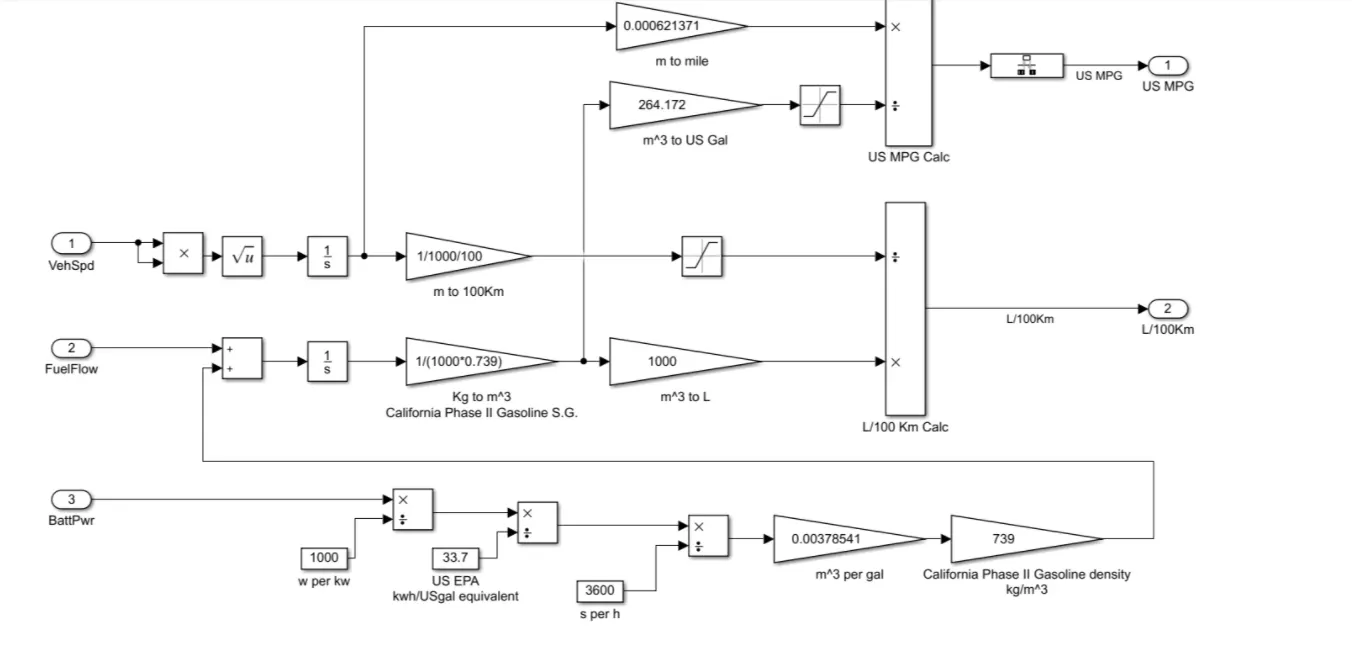
The model takes input of vehicle speed,fuel flow and battery power to caluclate fuel consumption and the equivalent battery consumption to caluclate the miles per gallon.
Vehicle speed and fuel flow-
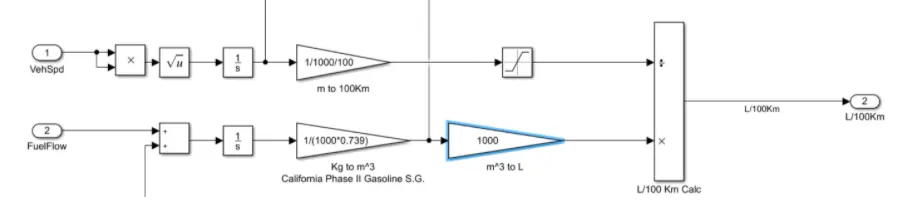
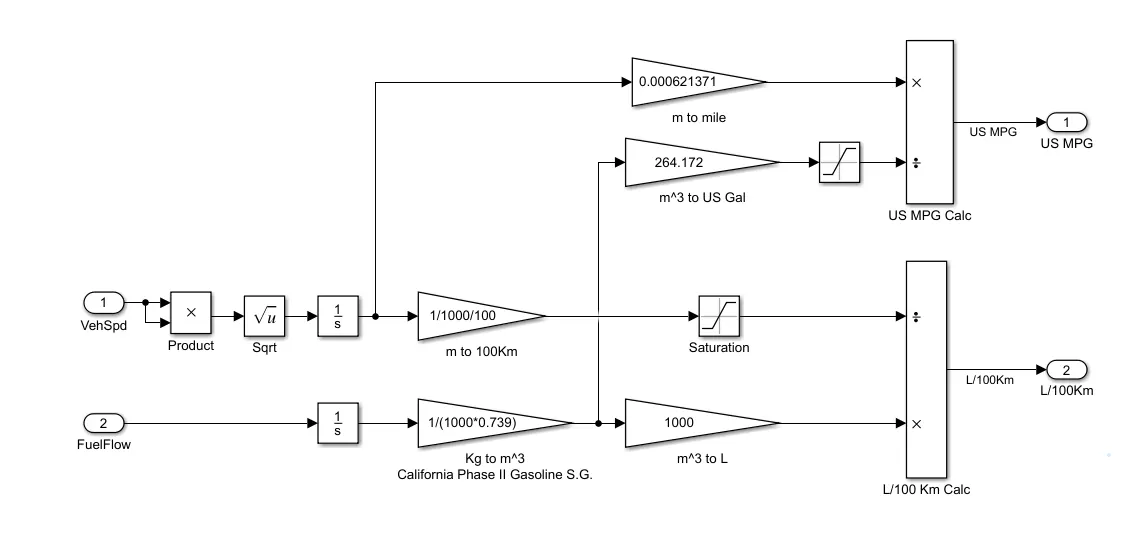
- As we know when we integrate speed we get distance ,here the vehicle speed is integrated to obtain distance in metres, which is then divided by 1000 to get it in kilometeres, we further divide it by 100 to convert it to a run of 100 kms.
- As we know the fuel flow is given as mass flow rate ,which is integrated to get the mass ,which is then divided by 1000 to get into kilograms . To convert this into volume we need to divide the mass with density, as Density = mass / volume
- This density is obtained in m^3 which is multiplied with 1000 to get the value in litres.
Now if we divide both the outputs we get the fuel consumed per 100 km run.
Battery power-
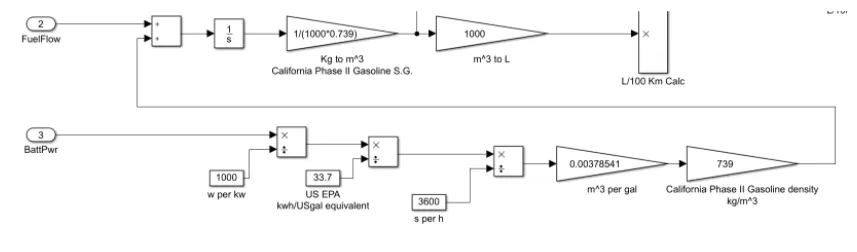
- As we see the battery power is given in watts which is divided by 1000 to get it in Kilo watts .
- To get energy this power is multiplied with time i.e 3600 to obtain the output in kwh .
- We divide it by 33.7 to convert the Kwh to US gal equivalent and finally multiply with 0.00378 to get the value from us gallon /sec to m^3/sec
- Lastly we multiply with 739 (density of gasoline) which is m^3/sec * kg/ m^3 ,the ouput value we get is mass flow rate which is in kg/sec.
- This output is in case of hybrid electric vehicle is added to the fule flow mass flow rate to estimate the miles per gallons.
To caluclate the miles per gallon the m is converted into miles and litres into gallons and then they are divide them to get the miles per gallons.
For electric vehicles-
For hybrid electric vehicles-
Study 3-
Aim- Run the HEV Reference Application with WOT drive cycle. Change the grade and wind velocity in the environment block. Comment on the results
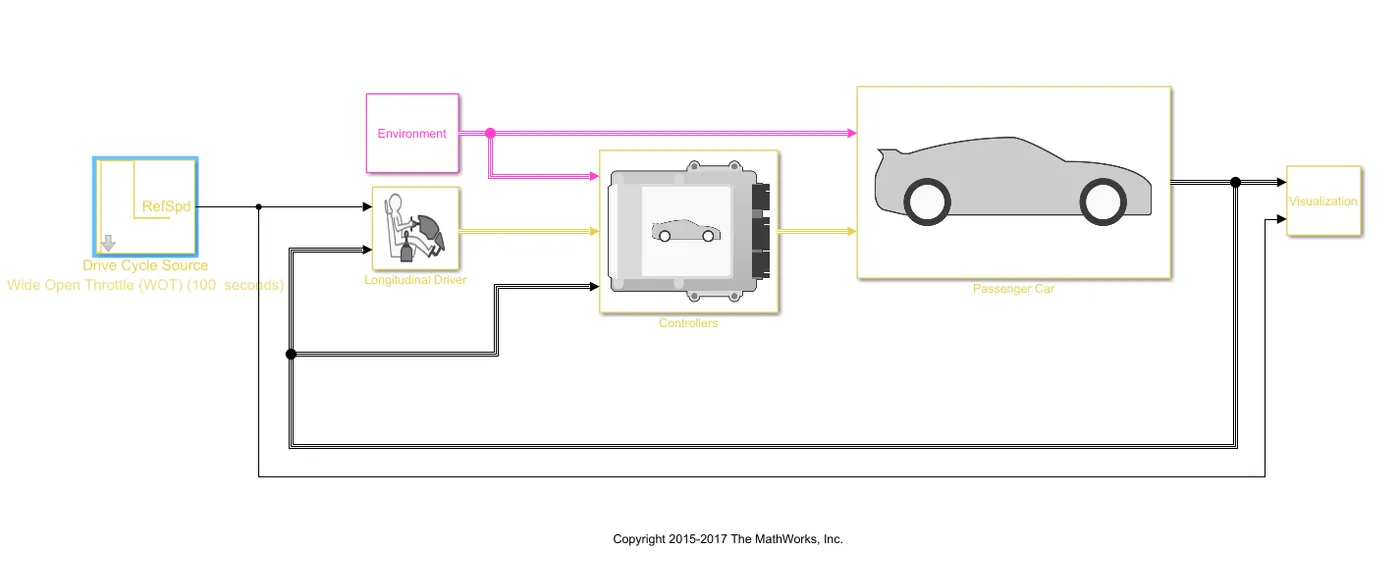
We change the drive cycle to WOT and set the parameters as -
The paramters are set as below-
Nominal speed = 80 mph
Time to start decelration = 50 sec
Simulation time = 100 seconds
Wind velocity = 0 m/s
Grade = 0
If the model is made to run the output appears as-
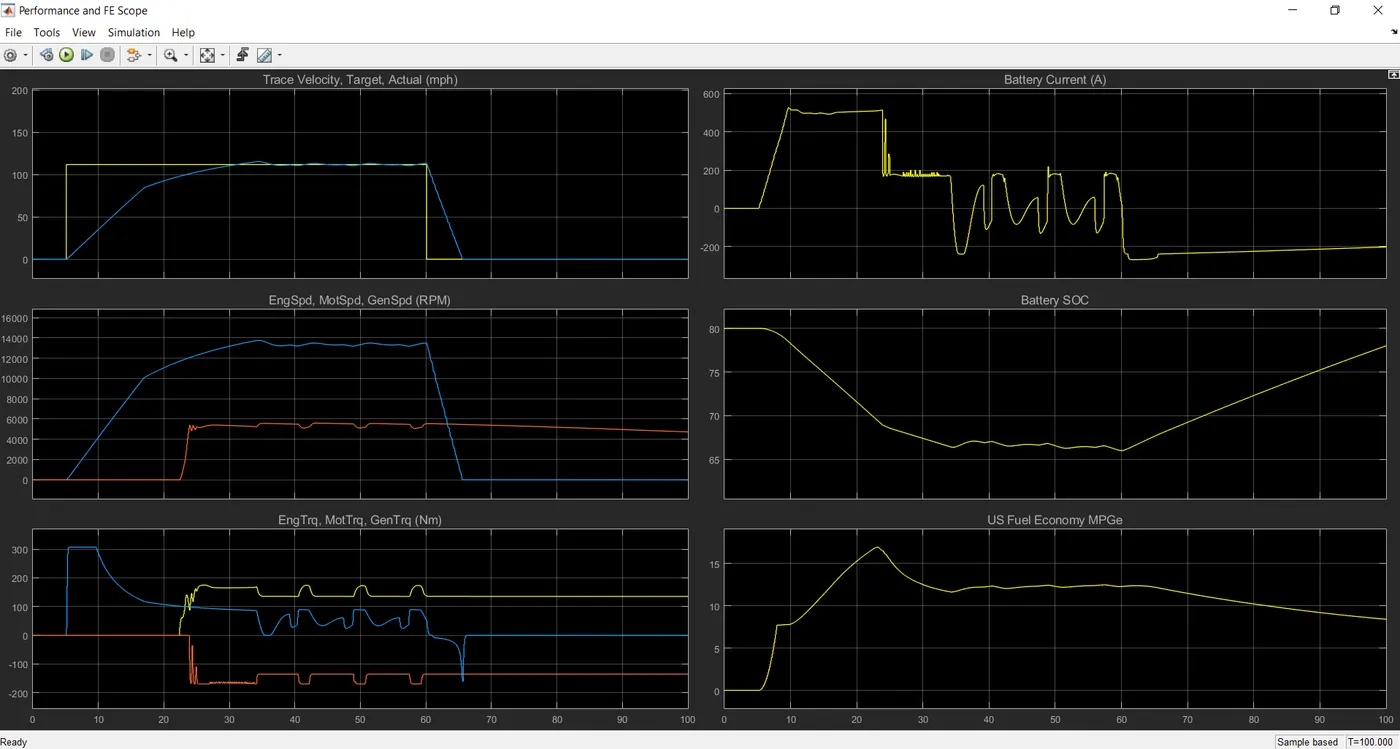
Plot 1 - Trace and actual velocity -
We see here the trace velocity is given as input and actual velocity is the output
The graphs were not matching correctly because we are not able to get such amount of instantaneous power
Top velocity acheived = 112 mph
Time taken to attain maximum acceleration = 32 s
Time taken to decelerate = 5.916 s
Plot 2 - Engine ,motor,generator speed-
This shows the changes in speed of engine ,motor and generator
Maximum engine speed = 5000 rpm
Maximum motor speed = 13480 rpm
We see whenever the SOC falls below 70% the engine gets activated by providing torque as well as charging the battery.
Plot 3- Engine,motor,generator torque-
This plot shows the torque changes generated by Engine,motor,generator
Maximum engine torque =173 Nm
Maximum motor torque = 310 Nm
Maximum generator torque = 168 Nm
The differnce in torques of engine and generator i.e for regenrative braking is due to difference in mechanical effieciencies between engine and generator.
Plot 4- Battery current-
The maximum current that can be provided by the battery is around 500 amperes after reaching which the value is constant and is the max amp limit of our battery.
As soon as the engine and generator gets started the battery current drops as load is shared by the engine and the current goes negative stating the occurence of regenerative braking.
Plot 5-Battery SOC-
The SOC of battery decreased from 80% to 70% while the motor does work, after 70 % the slope of the line is decreased because a partial load is shared by the engine.
During this time again SOC is increased beacuse of the regernative braking.
SOC 80% to 65 % in 34.767 seconds
Plot 6 - Us fuel economy MPGe vs time-
Shows the fuel economy as miles per gallons according to input drive cycle.
Highest MPGe acheived is 16.01
Adding wind velocity and grade to perform WOT analysis-
The paramters are set as below-
Nominal speed = 80 mph
Time to start decelration = 50 sec
Simulation time = 100 seconds
Wind velocity = 10 m/s
Grade =2
The ouput is -
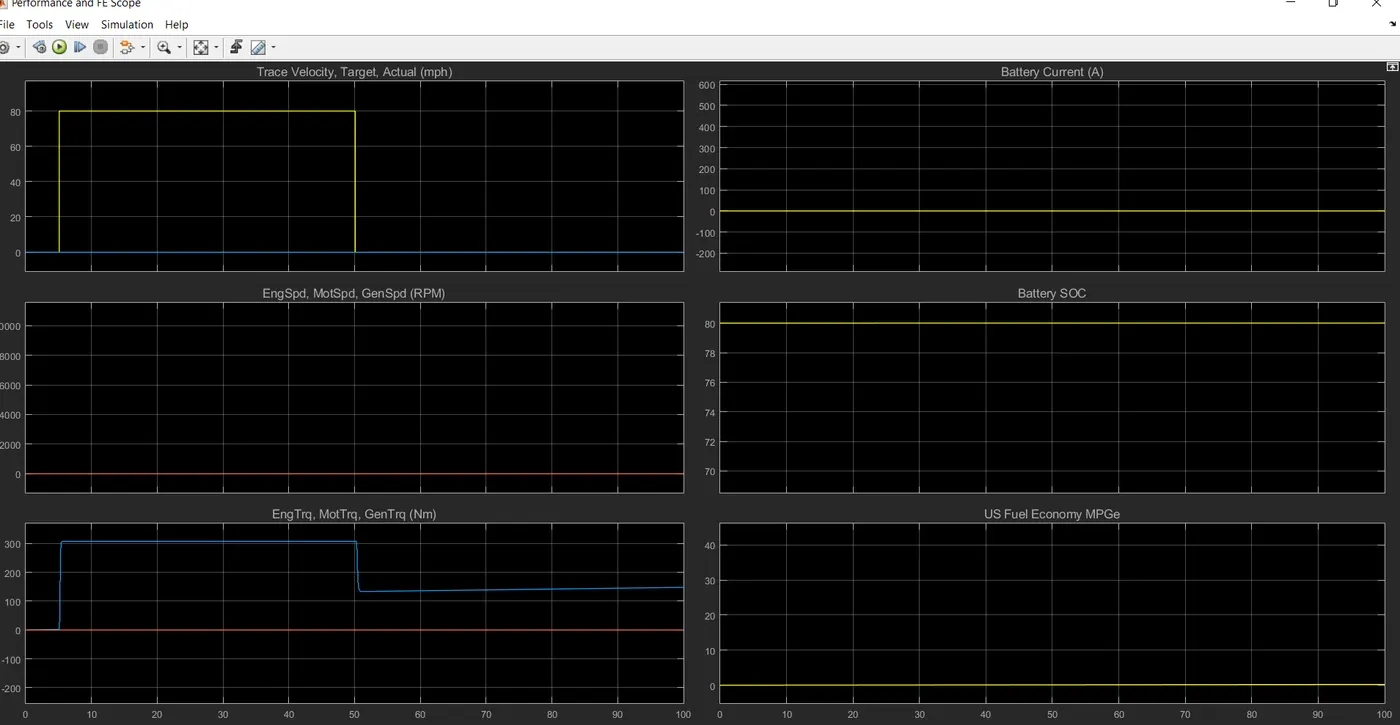
Here due to this parameters we can see that the vechicle is not able to move due to insufficient torque input that is obtained.
Study 4-
Aim- Keeping all other parameters same, compare the simulated results of hybrid and pure electric powertrains.
Procedure-
Pure electric vehicle-
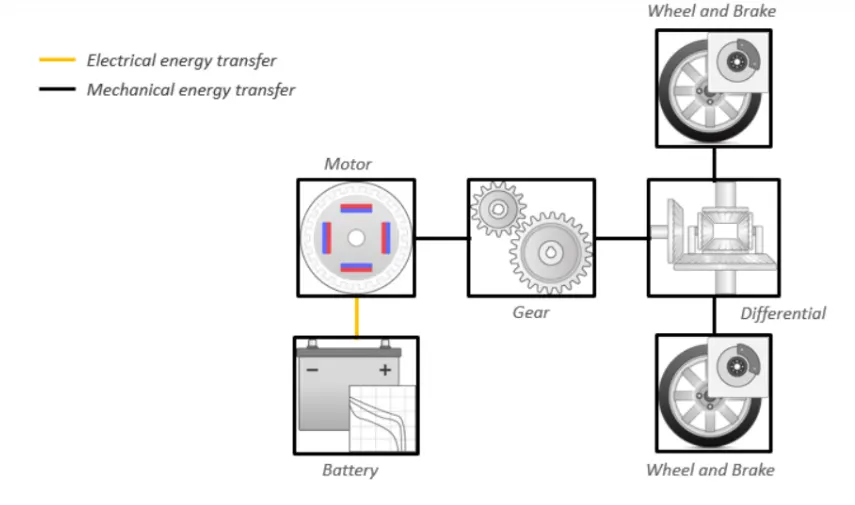
The paramters are set as below-
Nominal speed = 80 mph
Time to start decelration = 50 sec
Simulation time = 120 seconds
Output-
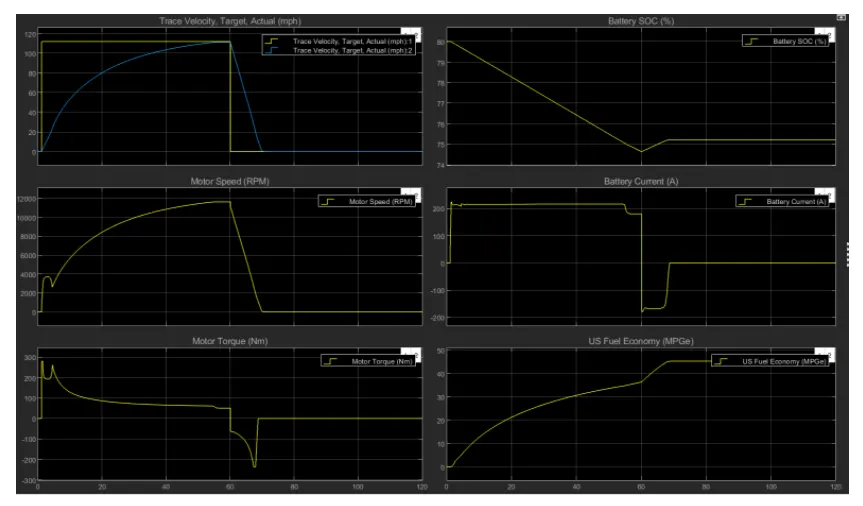
Plot 1 - Trace and actual velocity -
We see here the trace velocity is given as input and actual velocity is the output
The graphs were not matching correctly because we are not able to get such amount of instantaneous power
Top velocity acheived = 111.2 mph
Time taken to attain maximum acceleration = 59 s
Time taken to decelerate = 10 s
Plot 2 - Engine ,motor,generator speed-
Maximum motor speed = 11620 rpm in 60sec
Plot 3- Engine,motor,generator torque-
Maximum motor torque = 280 Nm
Plot 4- Battery current-
The maximum current drawn from battery is 225 amps.
Plot 5-Battery SOC-
The SOC of battery decreased from 80% to 74.7% in 60sec
Plot 6 - Us fuel economy MPGe vs time-
Shows the fuel economy as miles per gallons according to input drive cycle.
Highest MPGe acheived is 36.4 MPGe in 60 sec
Comparision of electric and HEV-
- Top speed acheived is same but acceleration in HEV is more.
- Vehicle took more time to decelerate in electric vehicle.
- Motor Rmp is more in HEV than in electrical.
- The efficiency of electricsl is higher than that of the hybrid vehicle.
- Electric vehicle has no emmisions wheras HEV has produce waste emmisions.
Electric vehicle is much suited where initial acceleration and max power is not of much importance and MPGe is required at higher side.
Hybrid Electric vehicle is much suited where initial acceleration and max power is of most importance and a little comprimise on MPGe .
So we can say pure electrical is more economical.