Week-4 Challenge WOT Condition Part-2
Week-4 Challenge WOT Condition Part-2
1. What is the difference between mapped and dynamic model of engine, motor and generator? How can you change model type?
A.
Mapped models:
1. Mapped models utilise lookup tables to simulate the characteristics of the vehicle architecture.
2. It works on a macro level, using the general performance characteristics of the components to achieve an approximate result of the vehicle performance.
3. Mapped models are utilised when there is no need for detailed component level monitoring.
4. Mapped models are faster to simulate.
Dynamic models:
1. Dynamic models utilise runtime data of components to calculate the desired outputs
2. Dynamic models work on a micro level to simulate the performance of each component and compute the architecture performance as a whole, based on that.
3. Dynamic models are used when components are to be simulated and monitored individually.
4. Dynamic models take much longer to simulate.
Changing model type:
In the engine/motor/generator block, there are two blockset models, one for mapped and one for dynamic engine/motor/generator as shown:

To change to the SiEngine blockset, we need to open the model explorer.
Right click-Explore
This opens a command window where we change the Engine variant to SiEngine as shown:
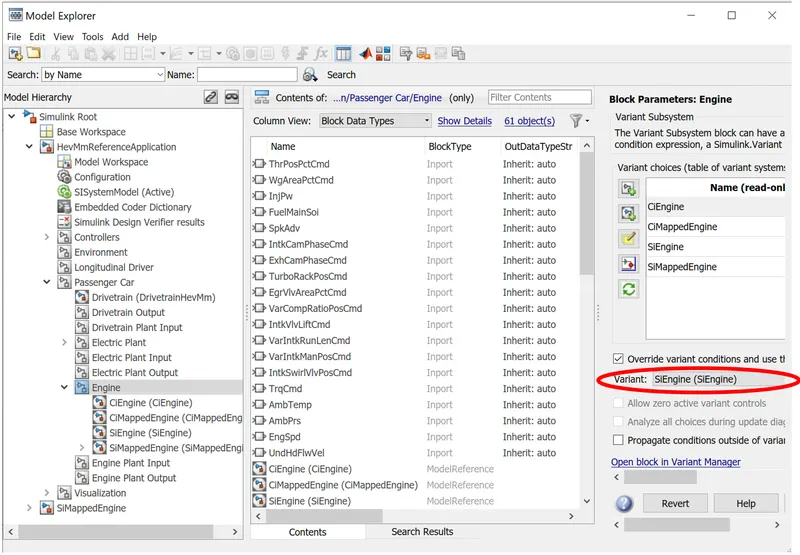
Now click on apply and exit the Model Explorer.
2. How does the model calculate miles per gallon? Which factors are considered to model fuel flow?
A. The MPG calculation occurs in the "Visualization" block in the vehicle model.
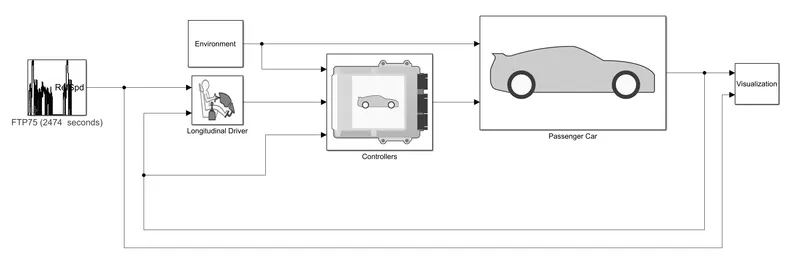
As seen above, the Visualization block is taking input from the Drive cycle(target speed), Passenger car(fuel flow, achieved speed)
The complete calculation of mpg is detailed in the mblock model as shown:
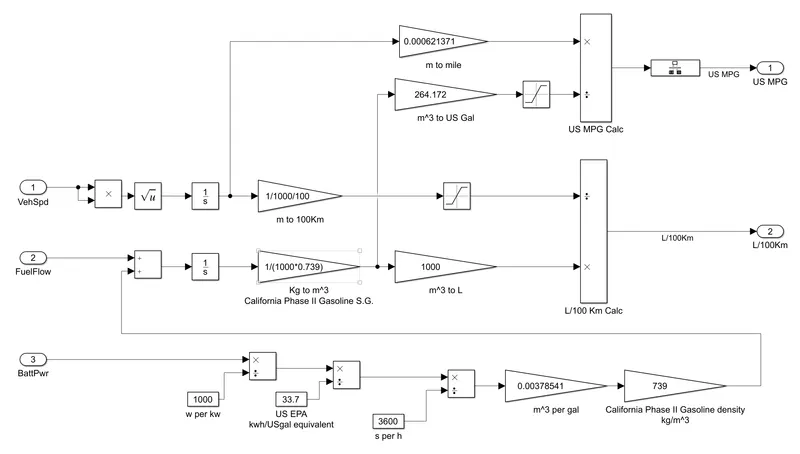
The way the conversion is taking place is shown in following image:
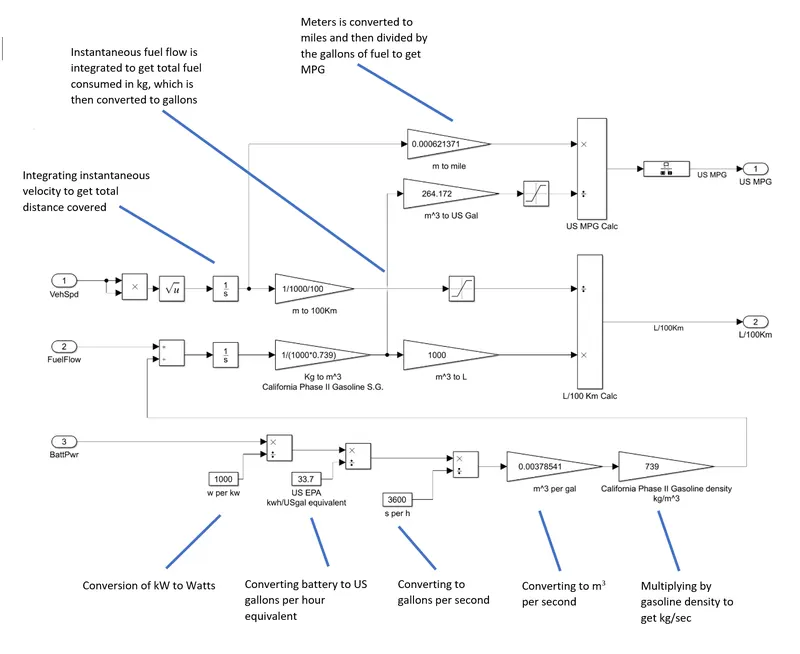
1. The battery power is converted to kg/sec of fuel flow using standard US gallons conversion ratios.
2. The equivalent fuel flow from battery is added to the engine fuel flow and the sum is integrated to get the total equivalent fuel consumption.
3. This is then converted to m3/s using the gasoline density and then to gallons/s using m3 to gallons conversion.
4. The instantaneous velocity is integrated to get the total distance covered, which is then converted to miles.
5. Thus by getting miles and gallons consumed, the MPG is calculated.
3. Run the HEV ReferenceApplication with WOT drive cycle. Change the grade and wind velocity in the environment block. Comment on the results.
A.
1. First we change the Drive cycle in the Hybrid Electric Reference application from FTP75 to WOT.
We use following parameters:
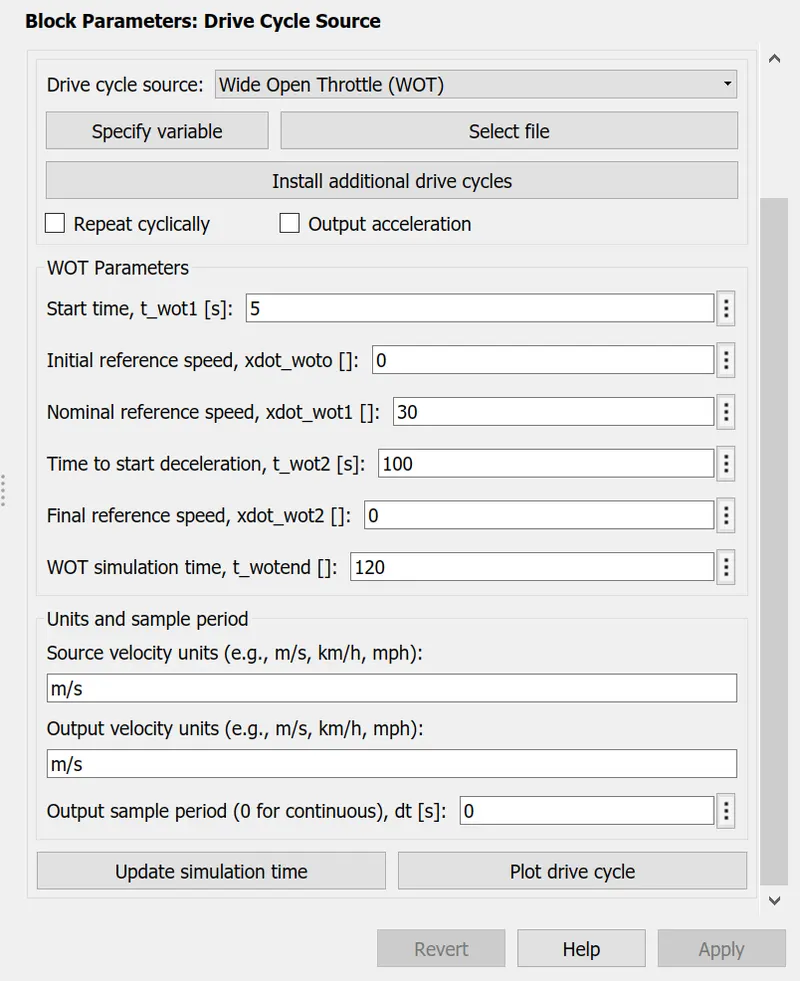
2. We get the results as shown:
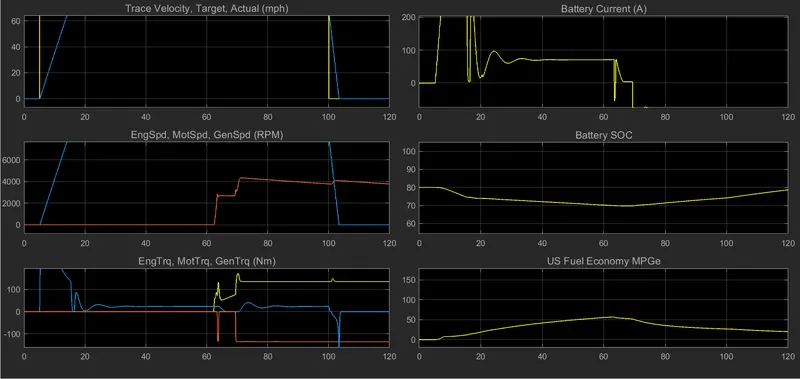
3. Now we run the same simulation again by changing the environment variables as shown:
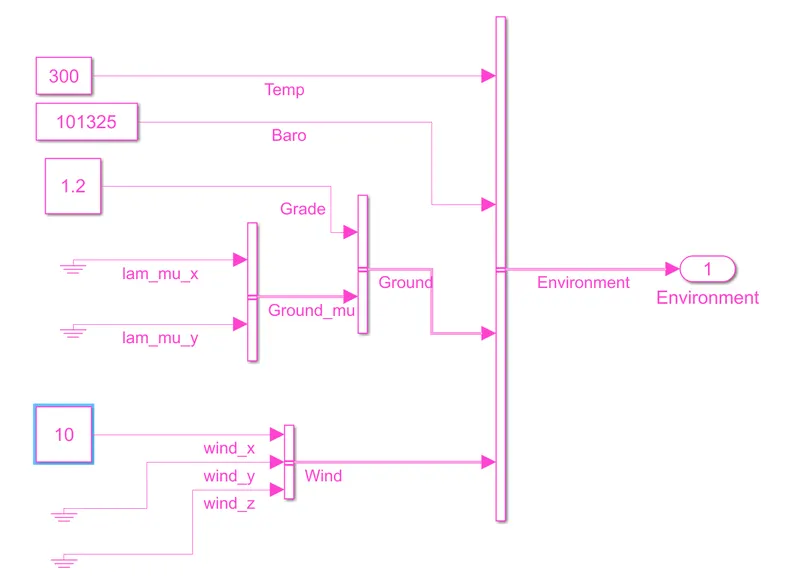
We have given gradeability of 1.2 and wind velocity of 10 m/s.
The results are as follows:
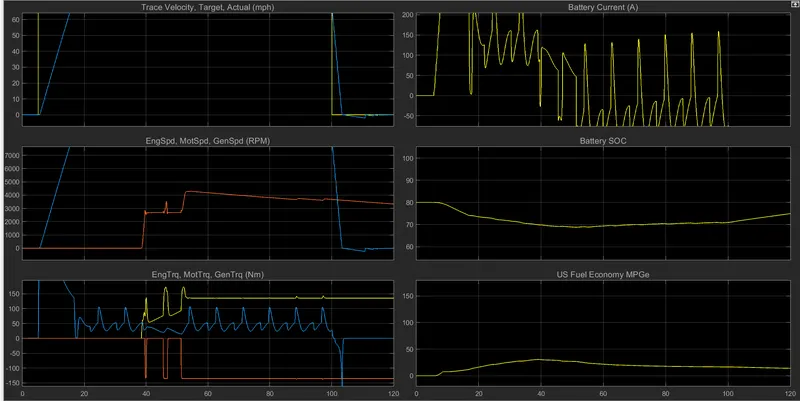
Comparing the two cases, we note following points:
1. In case 1, the peak velocity is achieved at s while in case 2, the peak velocity is acieved at 15.4s. This is due to the resistance offered by the grade and the wind velocity.
2. In case 1, the battery current goes negative only after about 60s, as compared to 40s for case 2. This is because the increased gradient and wind resistance depletes the batteries much faster, and the battery goes into charging mode.
This is evident from the generator torque spiking, co-inciding with the negative values of battery current.
3. Due to higher load, the battery SOC depletion graph is steeper in case 2 compared to case 1.
4. Case 2 ends with a lower SOC compared to case 1.
4. Keeping all other parameters same, compare the simulated results of hybrid and pure electric powertrains.
A.
A hybrid Electric powertrain consists of the Battery pack, engine, Power converter, generator, transmission.
It can run in parallel hybrid, series hybrid or series parallel configurations, depending on the architecture.
Due to the existence of two power sources, HEVs can generate energy more robustly and reliably.
An Electric powertrain consists of the battery pack, motor and transmission.
The only source of power is the battery pack, which can lead to under performance in high load usage scenarios, as well as reduced range of usage.
We will be running both the configurations in a WOT 120s drive cycle simulation to compare the performance.
HEV powertrain:
The results obtained from the WOT 120s cycle:
Observations:
1. Peak velocity is achieved in 14s.
2. Deceleration to 0m/s occurs in 3.2s.
3. Peak motor speed is 7500 rpm
4. Peak motor torque is 307Nm.
5. Peak battery current is 525A.
6. Battery is depleted by 1.3%
EV Powertrain:
The results obtained from running the WOT 120s cycle:
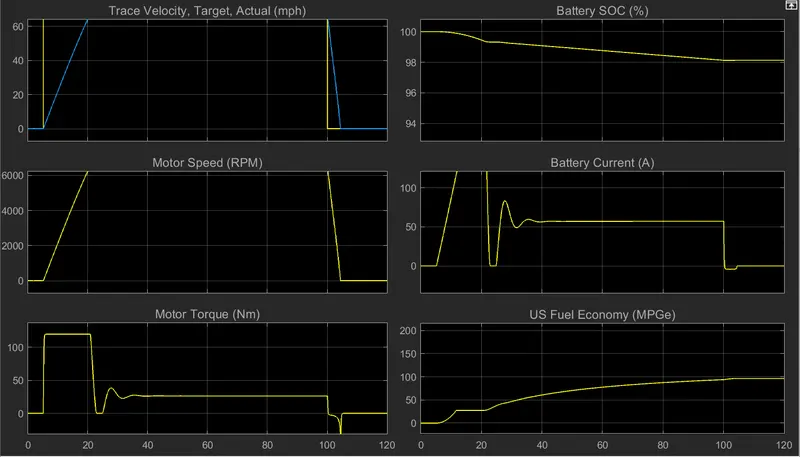
Observations:
1. Peak velocity is achieved at 20s.
2. Deceleration to 0 occurs in 5s.
3. Peak motor speed is about 6500 RPM.
4. Peak motor torque is 120Nm
5. Battery depletes by 1.87%
6. Peak Battery current is 120A.
Conclusions:
From the above observations we conclude following points:
1. The HEV powertrain generates more power compared to the pure EV powertrain.
This is evident from the faster acceleration time, higher current and higher peak motor speeds for the HEV powertrain.
2. The HEV powertrain consumes more power through the battery, as evident from its steep SOC depletion graph. But as the SOC crosses the threshold of 70%, the engine kicks in and charges the batteries back up, giving a better SOC at the end of the simulation.
3. The economy of the pure EV is much better compared to the HEV, as the economy drops as soon as the engine is turned on to take over the power generation and charge the battery.