Week - 4
AIM:
To Implement control logic of a “washing machine” using Stateflow and to Make a Simulink chart for the “Gear shift” logic.
THEORY:
WASHING MACHINE:
A washing machine (laundry machine, clothes washer, or washer) is a home appliance used to wash laundry. The term is mostly applied to machines that use water as opposed to dry cleaning or ultrasonic cleaners. The user adds laundry detergent, which is sold in liquid or powder form, to the wash water.
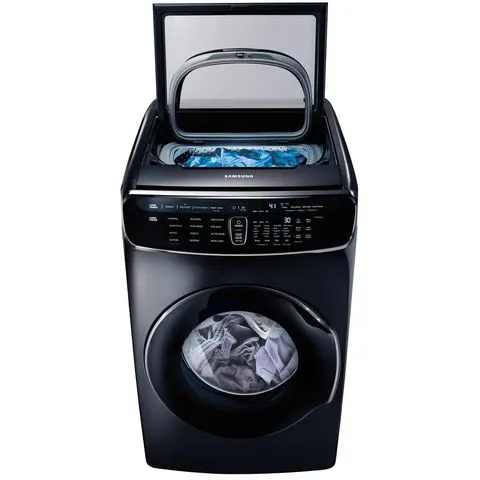
FIGURE.1
CAR GEAR SHIFTS:
A manual transmission (also known as a manual gearbox; abbreviated as MT) is a multi-speed transmission where gear changes require the driver to select the gears by manually operating a gear stick and clutch (which is usually a foot pedal for cars, or a hand lever for motorcycles).
Early automobiles used sliding mesh manual transmissions with up to three forward gear ratios. Since the 1950s, constant mesh manual transmissions have become increasingly commonplace and the number of forward ratios has increased to 5-speed and 6-speed manual transmissions for current vehicles.
The alternative to a manual transmission is the automatic transmissions; common types of automatic transmissions are the hydraulic automatic transmission (AT), automated manual transmission (AMT), dual-clutch transmission (DCT), and the continuously variable transmission (CVT).
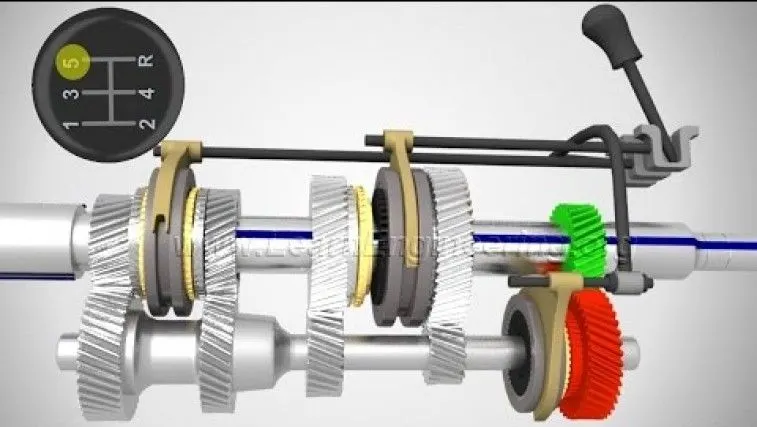
FIGURE.2
OBJECTIVE:
- Implement control logic of a “washing machine” using Stateflow as per given sequence:
- If the power supply is available, the system gets activated
- If the Water supply is not available, stop the process & indicate through LED
- Soaking time should be 200s followed by Washing time of 100s.
- Then rinsing happens for next 20s & dryer runs for 50s
- After all the processes have completed turn on the finished LED
Make a Simulink chart for the “Gear shift” logic as per below conditions:
Speed Range(kmph) Gear
0 to 15 1
16 to 25 2
26 to 40 3
41 to 60 4
Above 61 5
Give speed input while the simulation is running & display the gear number.
SIMULINK MODEL:
MODEL 1:
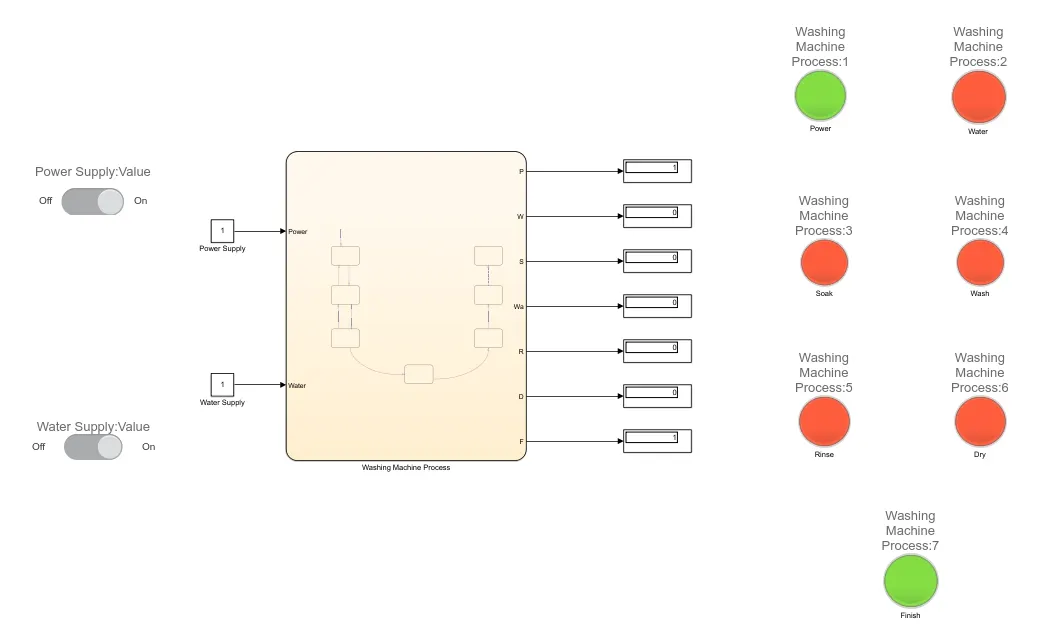
FIGURE.3
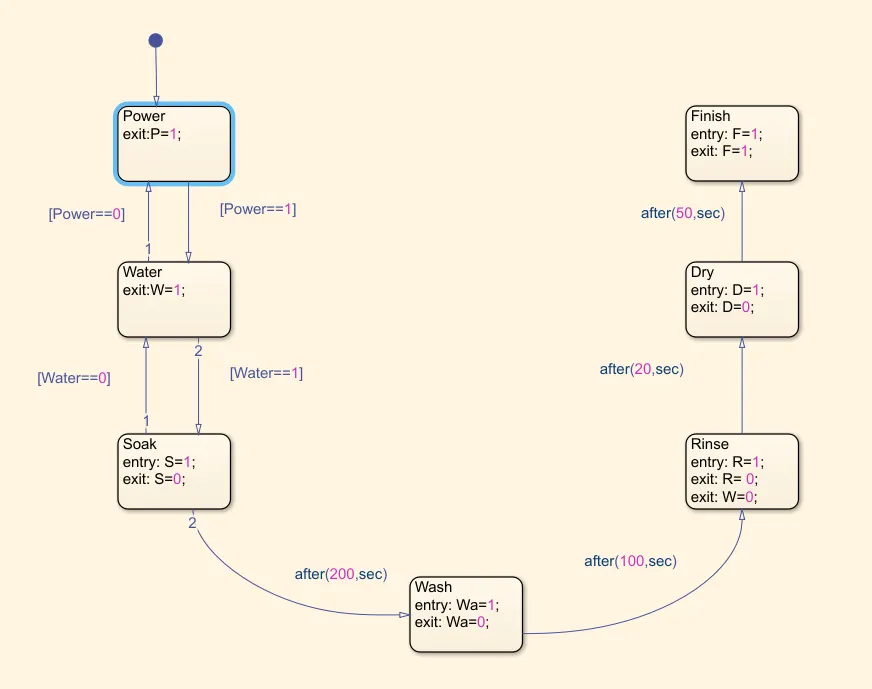
FIGURE.4: STATEFLOW
EXPLANATION:
- First, we have created a chart using ‘CHART BLOCK’ to define the logic of the washing machine.
- The first state is the ‘Power’ state, this is where the program checks whether the power is ON/OFF. If the power is ON the process will go to next state or else it will not go further. Here we have defined a variable ‘P’ as it will help us to indicate whether this particular state is going On or not.
- Next, we have ‘Water’ state where water will be filled, and similar to that of power state we have defined variable ‘W’ which will help us to see whether is being filled or not. The process between ‘Power State’ and ‘Water State’ is defined as if power is equal to one which means if power is on then only it water state will start, and power equal to zero refers as power is OFF then it will remain in power state only.
- Now the next state is ‘Soak State’, this is where the cloths are soaked once the water is filled. Here we have defined inside this state that when it enters the state the value of variable ‘S’ will 1 which means that this state in going on. Once this state is over the process exits by a value ‘S=0’ which means now this state is not going on.
- Now next is the ‘Wash State’, this is where the cloths are washed, here as per the conditions mentioned above after 200s of soaking the wash state takes place. This condition is mentioned from between ‘Soak State’ and ‘Wash State’.
- Then, ‘Rinse State’ takes place where the all the water is drained out, here when the state is in this state it will indicate ‘R=1’ once this state is over it will indicate ‘R=0’ and it will move next state. Process between ‘Wash State’ and ‘Rinse State’ id defined as per the condition mentioned above.
- Next state is the ‘Dry State’ where the clothes are dried inside the machine. Similar conditions are defined in this state as like previous states, and the process is defined as it is mentioned above.
- The final state is the ‘Finish state’, this where the process ends and the power need to be switched off manually. Here also similar conditions are mentioned.
- Now once the machine logic is created we have defined the variables entered as output variables and power and water as inputs as these has to be provided to the machine in real time.
- To give power and water as input we have used a ‘Slider Switch Block’ and ‘Constant Block’ is used. Each slider switch is connected to each constant block. When the slider switch is ON the value in constant block will be ‘1’ and this constant block is connected to the chart block where the washing machine program is defined.
- If the slider switch is OFF the value in constant block is ‘0’ which indicated there will no water or power supply. By this way we have defined the inputs. And for the outputs we have connected each one with each ‘Display Block’.
- These display blocks are then connected to ‘Lamp Block’ which will turn green when particular state is going and it will be red if that particular state is not going on.
- To set conditions for the lamp block, double click on it set the conditions as shown.
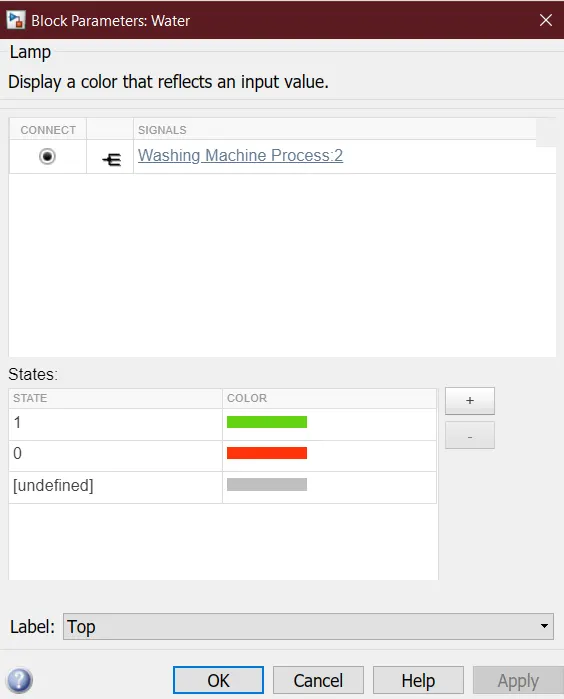
FIGURE.5
- Now if u run the model we will lamps turning into green and red when the that particular state is going on, thus showing the process of a washing machine.
MODEL 2:
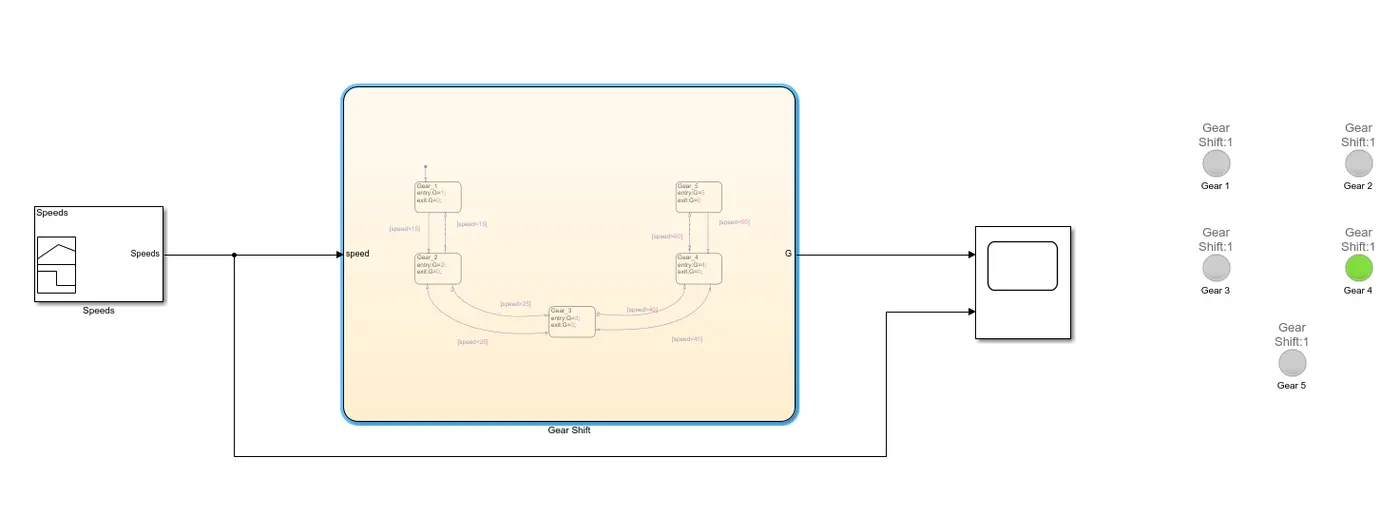
FIGURE.6
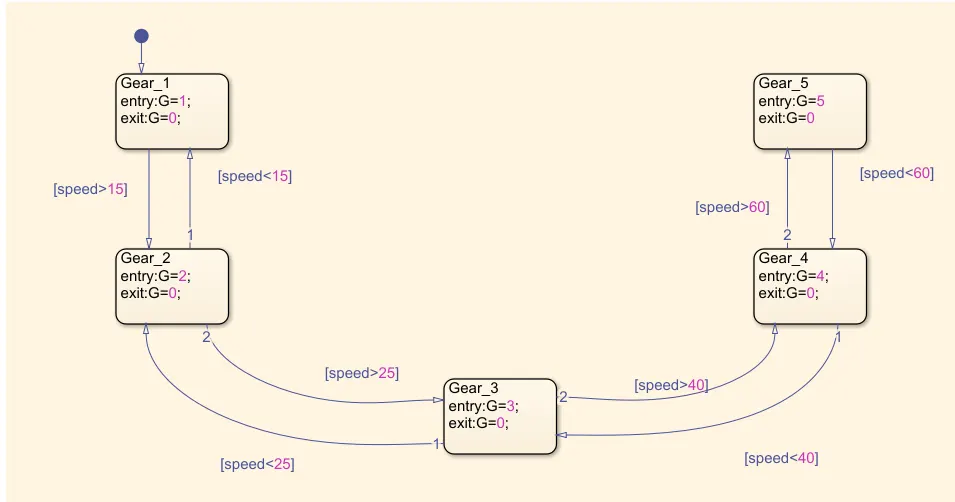
FIGURE.7: STATEFLOW
EXPLANATION:
- Here we have used ‘CHART BLOCK’ to define the gear shift logic for the conditions given above.
- First, we have defined fives states namely ‘Gear 1’, ‘Gear 2’, ‘Gear 3’, ‘Gear 4’, ‘Gear 5’.
- Now to shift from one state to another we have defined the conditions of the speeds as mentioned above.
- We have also defined values inside the states which represent that when that particular state is going on it will display the value that is defined in it. This will help to see that which is gear is the vehicle when in a particular speed.
- Now we have defined speed as input for the chart as the gears change only on basis of speed and variable ‘G’ is defined output of the chart as it tells us, which gear is the vehicle in.
- Now to give speed as input we have used a ‘Signal Builder Block’, where we have defined the defined the different speeds.
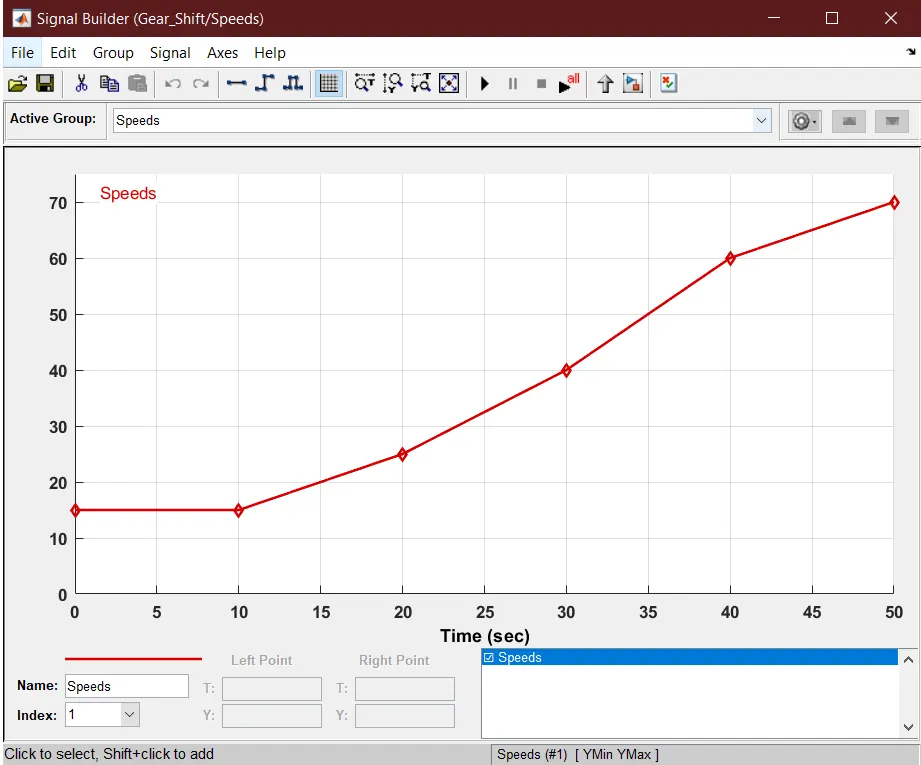
FIGURE.8
- Now according to these speeds, the gears in the chart block will change. To indicate this change in gears we have used ‘Lamp Block’. We have set the values of lamp blocks such that when a gear is executed that particular gear lamp will turn into Green.
- Now the output of the chart is connected to ‘Scope Block’ which will give us the graph representing each gear at different speed, and the signal builder block is also connected to the scope block so that we can compare speed and gears at same time.
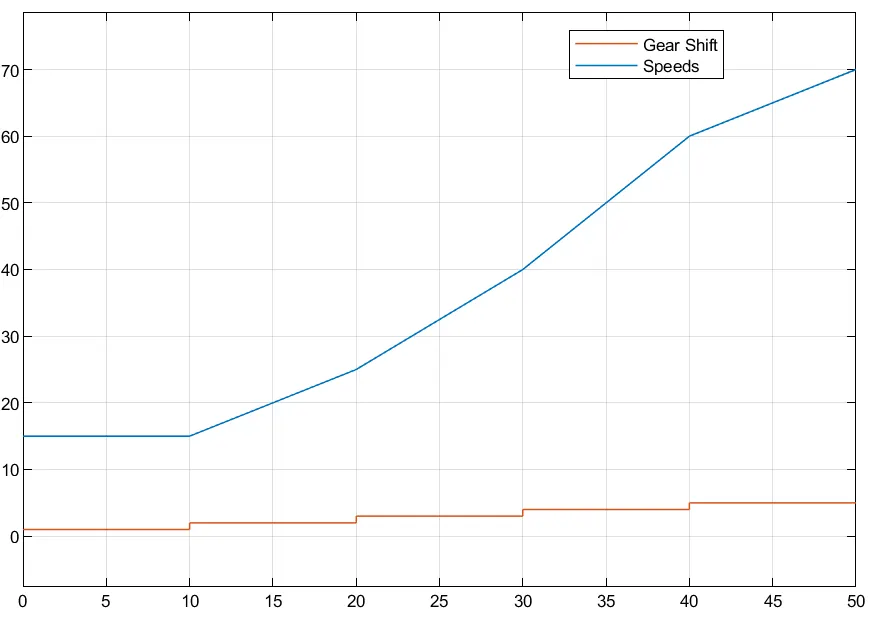
FIGURE.9
- Now when we run the model, we get the above results, thus represents the shifts in gears at different speeds.
CONCLUSIONS:
- Thus, all the objectives were achieved successfully.
- Similar concepts and approach can be used to create stateflow for other systems.
- Links for simulink models:- https://drive.google.com/drive/folders/1fnxIw0AuglXq4uURChwKkjGCwPNV64Fp?usp=sharing