Week - 4
1.
Aim:
Implement the Control logic of Washing Machine by using State flow chart.
Conditions:
- If the power supply is available, the system gets activated
- If the Water supply is not available, stop the process & indicate through LED
- Soaking time should be 200s followed by Washing time of 100s.
- Then rinsing happens for next 20s & dryer runs for 50s
Modelling Chart:
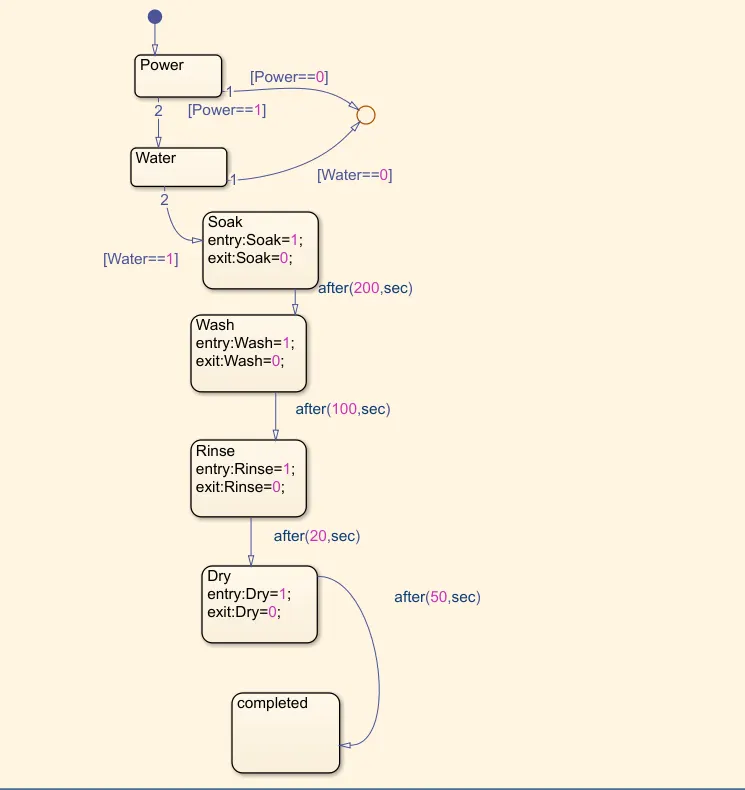
Explanation:
The frist Arrow down is entry point that is called Default Transition. When we selecting the state box from the left side The default transition will comes automatically.
After in the state we can define the Name of state that can represents identification or Name of state.
Intially selected 2 states for Power and Water for inputs. The condition defined as for availabilty is 1 and not availability is 0. and both connected using junction.
The next state is Soaking when the water is available only possible so that the condition defines as 1. The Soaking entry and exit Variables are defined.
The condition After 200 sec of soaking it is going to wash state entry and exit variables are defined as 1 and 0 respectively.
After 100 sec of Washing state it's about to Rinse state for 20 sec as per defined the entry and exit variables.
The last step is drying for 50 sec it is runs after the rinsing state .
Inputs and Outputs are defined in Symbol Pane.
Model:
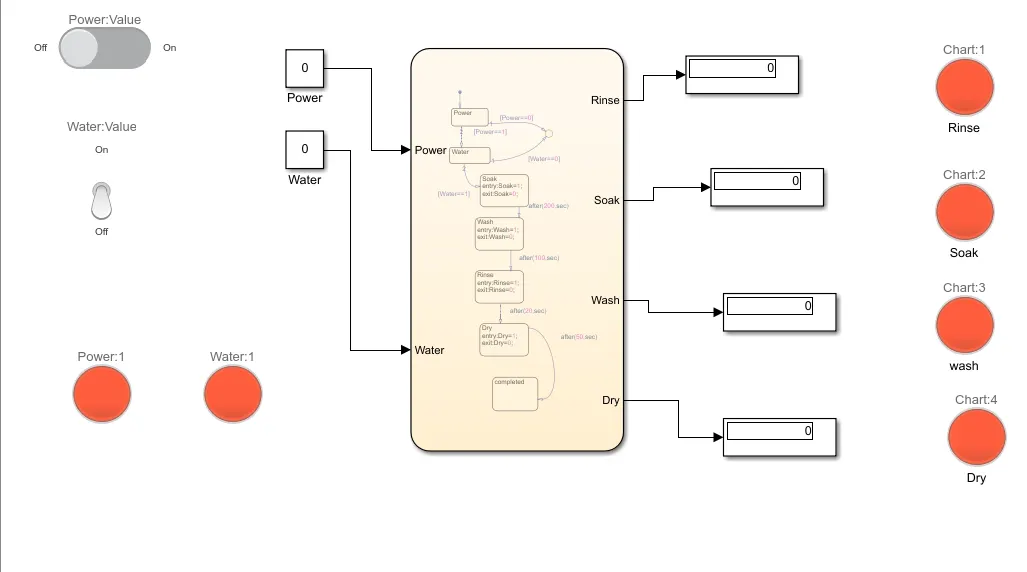
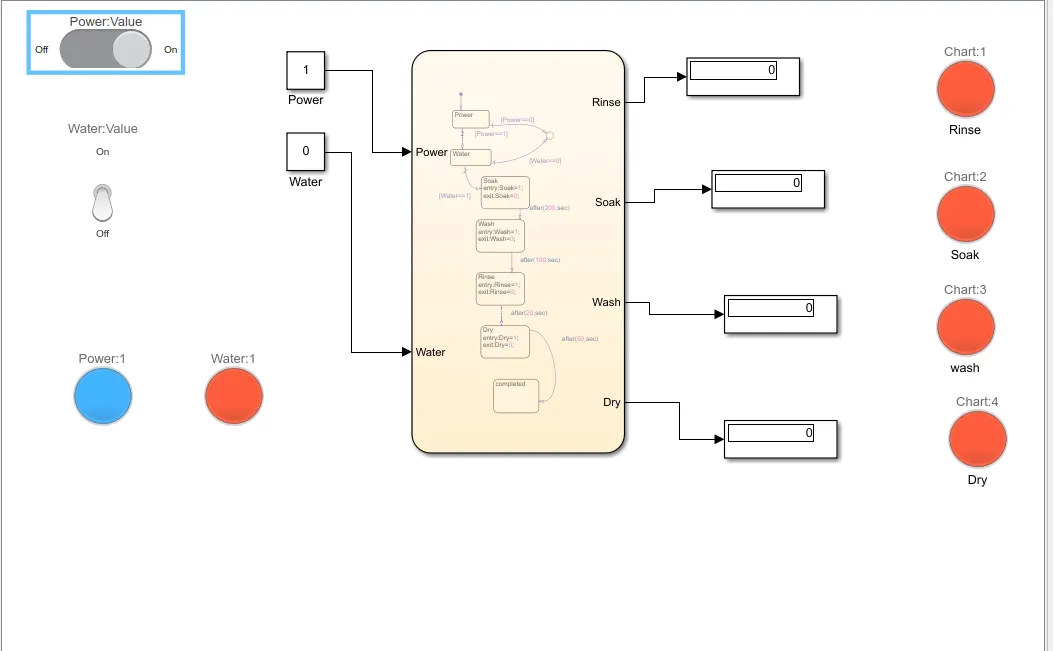
If the power supply is available, the system gets activated . The indicated in blue light. If the Water supply is not available, stop the process & indicate through LED.
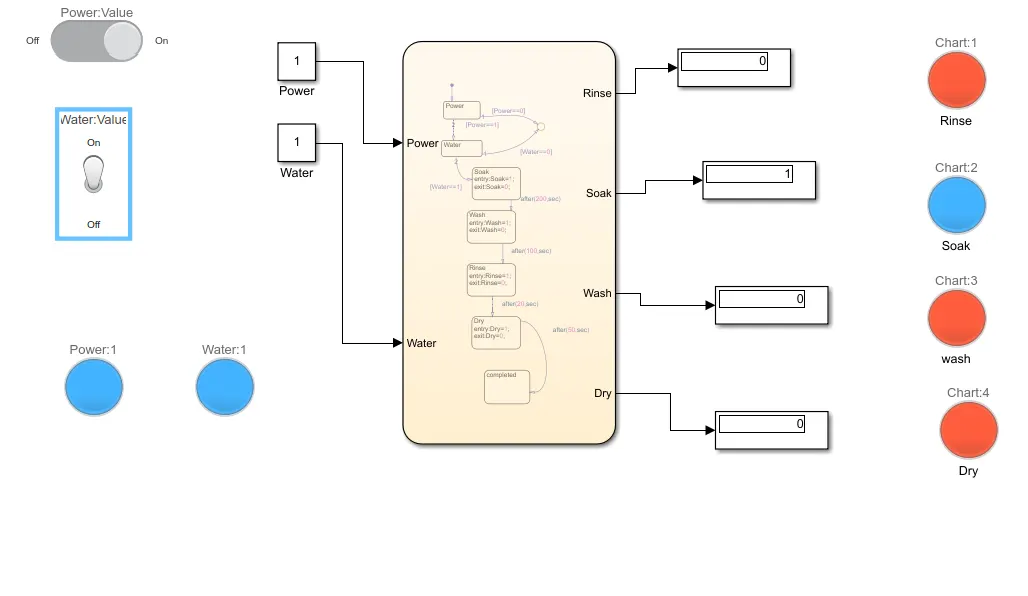
Soaking time is 200s indicated in blue light.
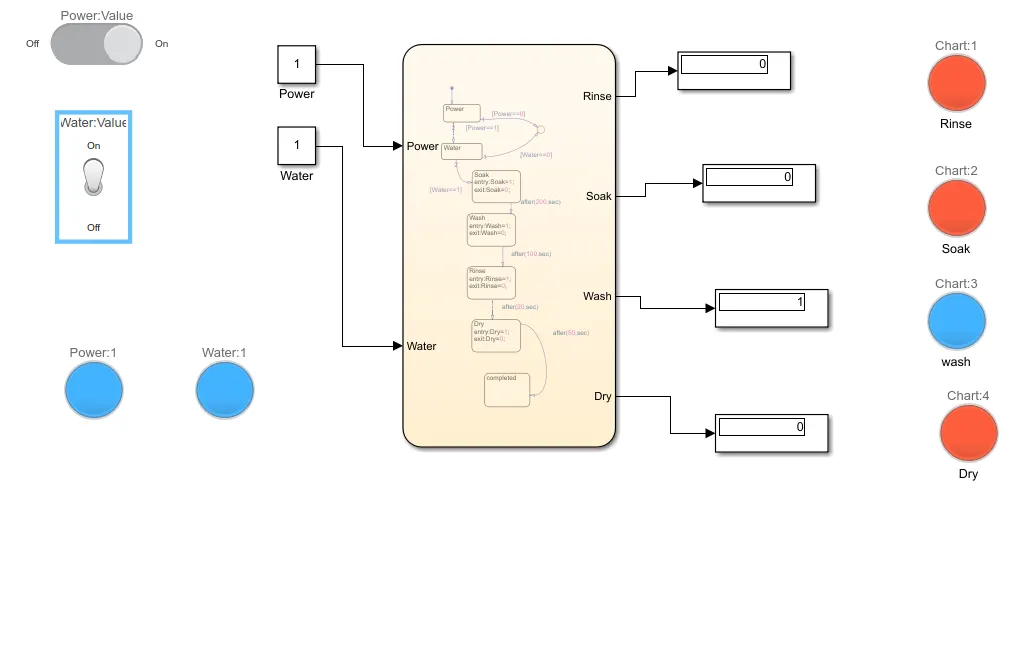
Washing time of 100s indicated in blue light.
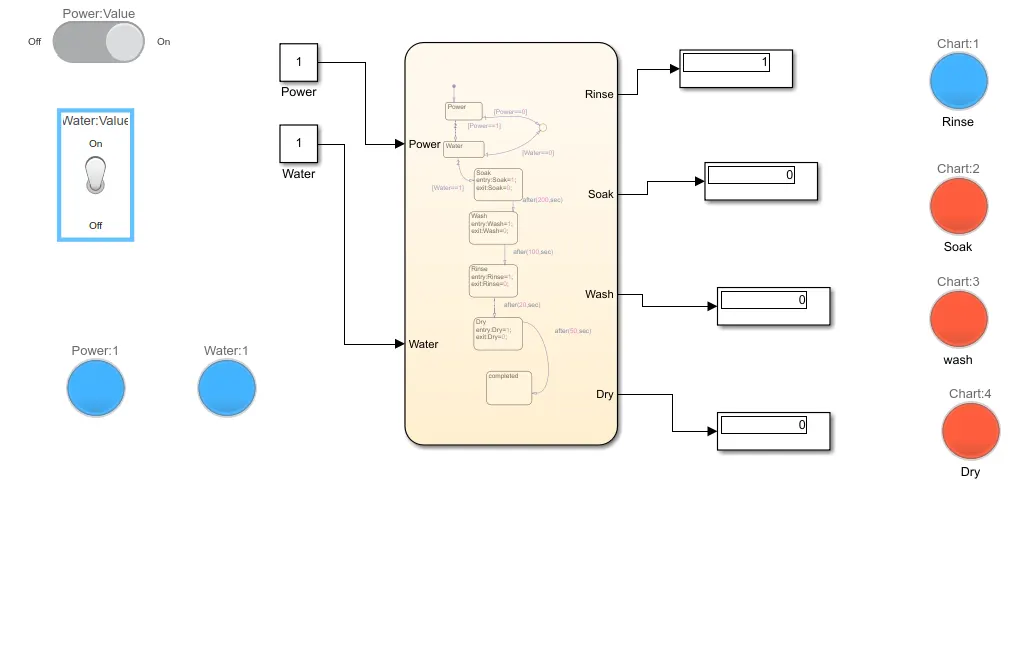
Rinsing for 20 sec
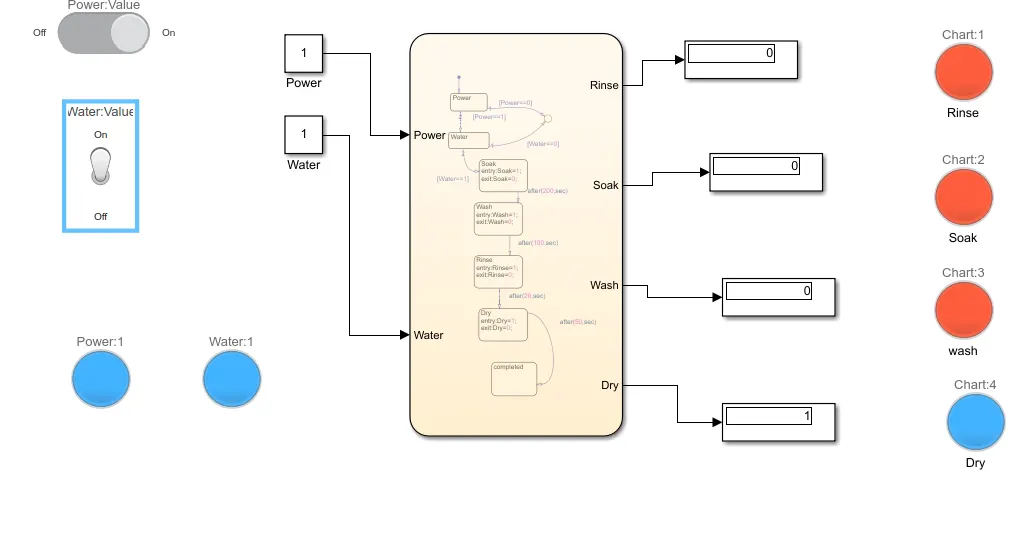
Dryer runs for 50s
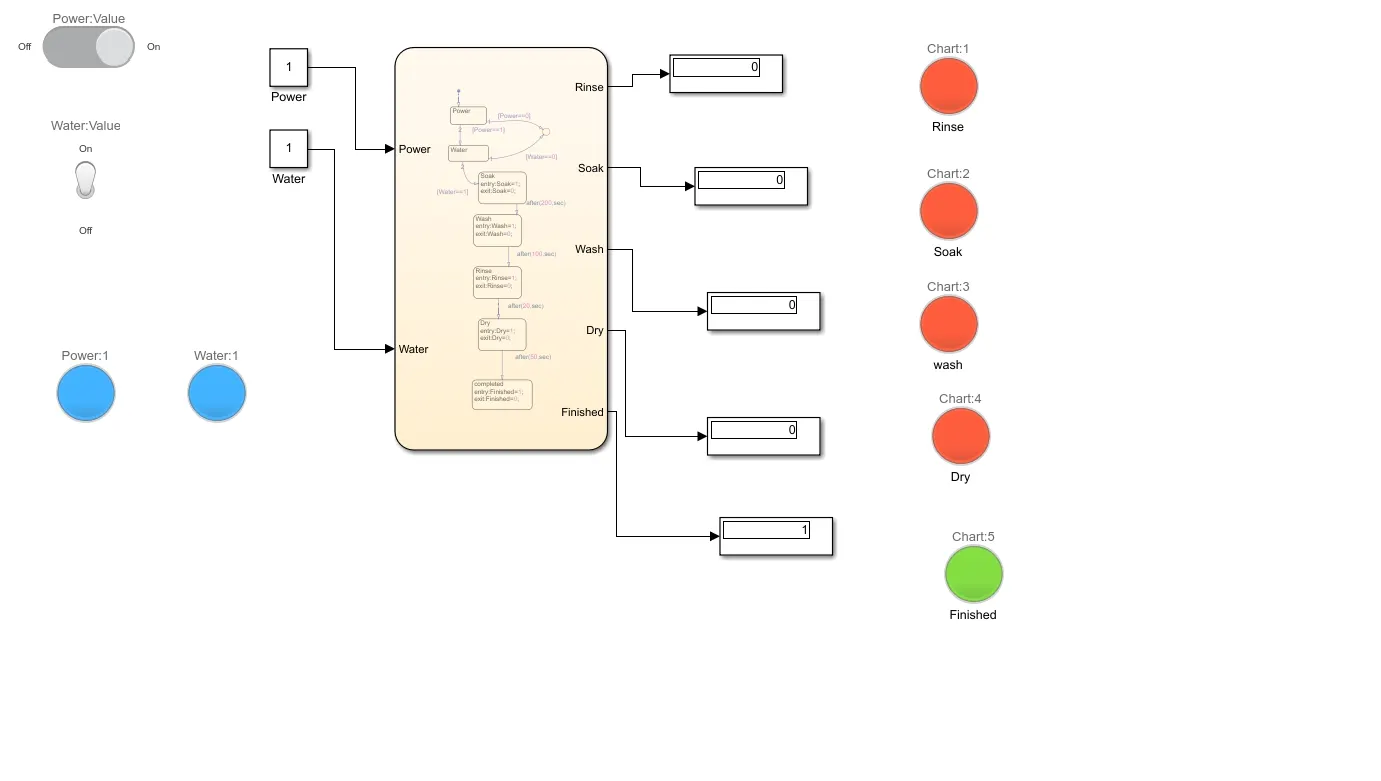
Finally, The finishing Process indicated through the Green light.
Dashboard entities are used to indicate the Process of Washing Maschine and those are Lamp , Sliderswitch, Toggle switch.Simulink signals are connected to Power & Water input are Constant and output values are shows in Display.
Toggle Switch is for water when it activates value is 1 and deactivate value is 0 .
Slider switch is for Power when it activates value is 1 and deactivate value is 0.
Lamps are for the State Indicators when it activates value is 1 and deactivate value is 0 .The Colours are Red is OFF, Blue is ON and Finished is Green.
Finally, All states were Run according to given Conditions.
2.
Aim:
To build Gear shift control flow logic according to the speed as given.
Condition:
Speed Range(kmph) Gear
0 to 15 1
16 to 25 2
26 to 40 3
41 to 60 4
Above 61 5
Give speed input while the simulation is running & display the gear number.
Flow Chart :
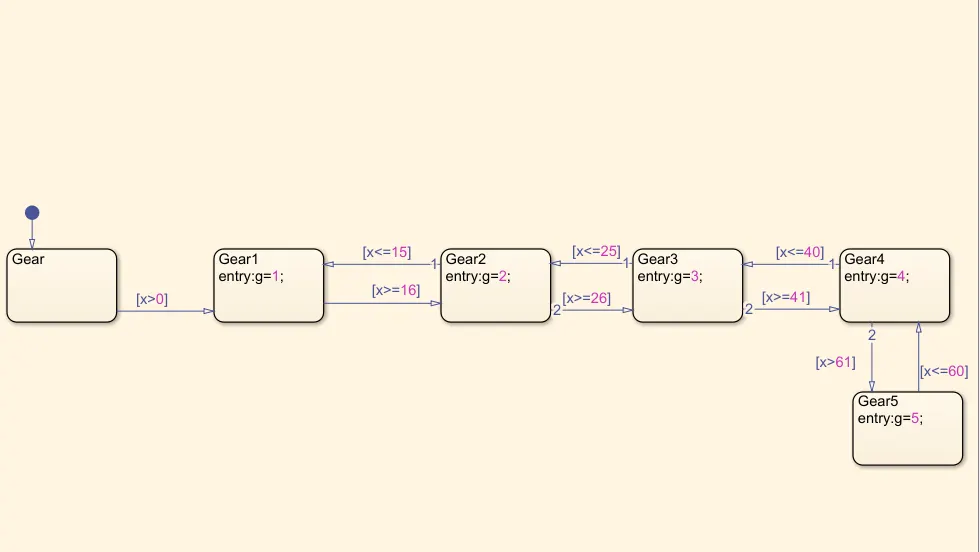
Explanation:
According to given condtions , Fristly The states comes with Default Transition given state as Gear which 0
if the speed is greater than zero less than the gear should be 1 . The condtion is defined the x>0 then the state becomes Gear 1 entry value is 1 and it is below the 15
The speed is rasie to above or eqaul to 16 and then the gear shifts to 2 and the speed is lessthan 25. The gear state is defined as 2 and entry value is 2.
The speed is increases to below the 40 from 26 the gear shifts to 3.The state is Gear 3 entry value is Gear3.
When the Speed is raising to above the 41 and below 60 the state becomes Gear 4 and entry value is Gear 4.
Finally if the speed increase to above the 61 and it Gear 5 state entry value is Gear 5.
The All Greater values are Right Arrow when the speed is increases and Less values are Left Arrow when the speed is Down in the flow chart.
In the Symbols Pane the X is Conditon for Speed output and g is values of Gear output defined.
Model:
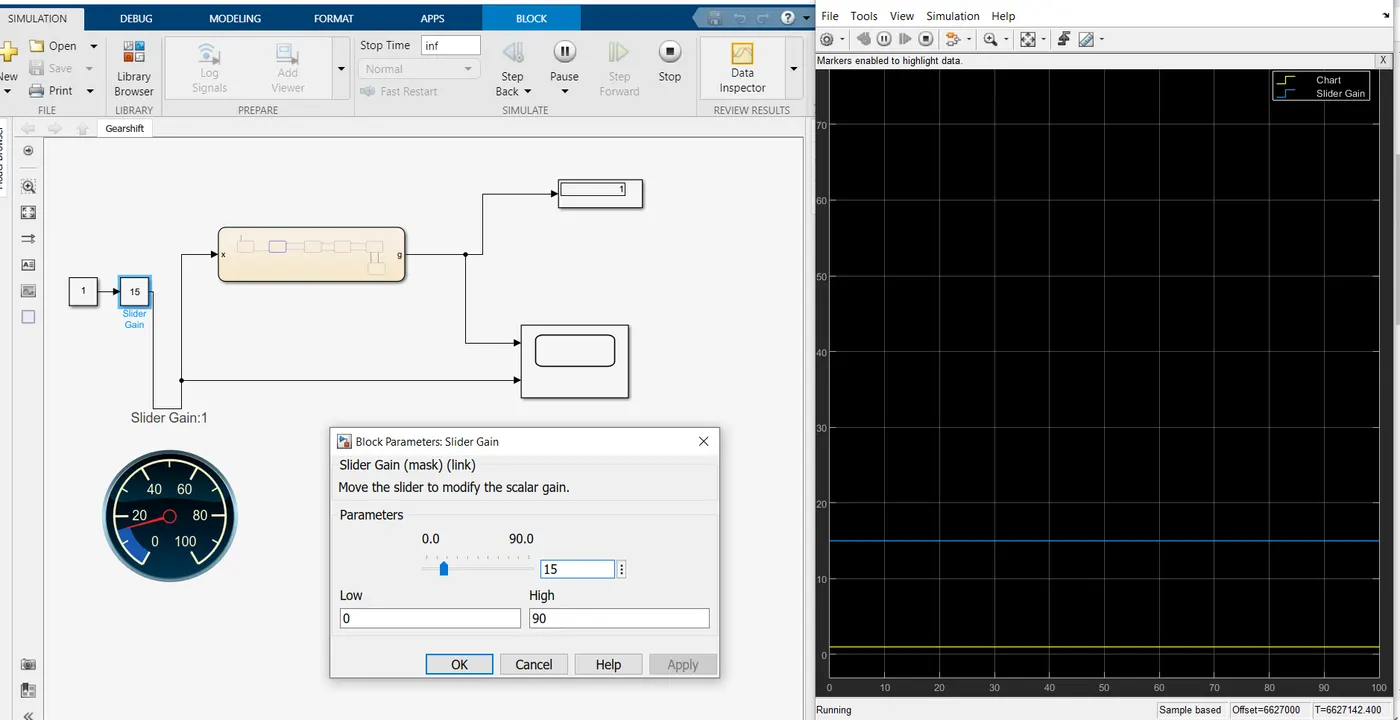
When the Speed is above 0 and lessthan 15 it is Gear 1. Speed and Gear number indicated by Speed gauge and Display respectively.
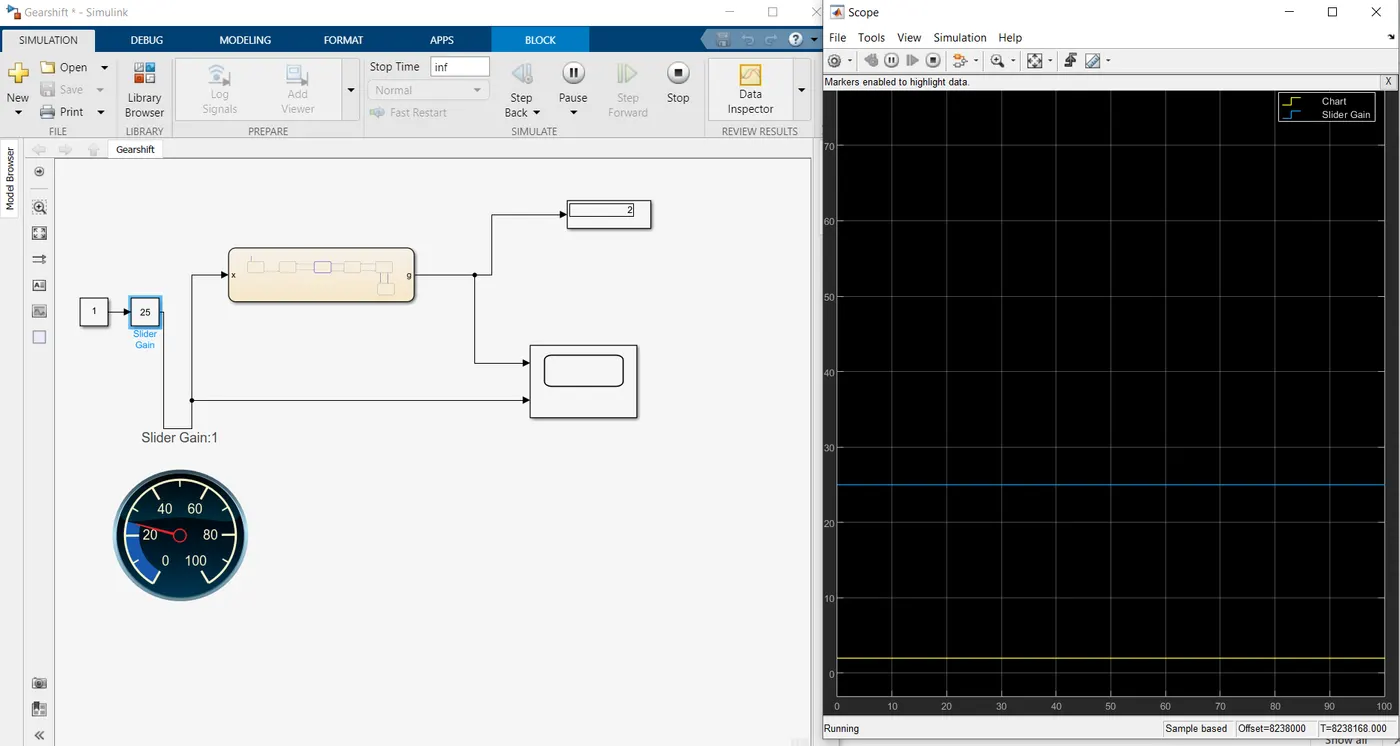
When the Speed is above 16 and below the 25 Gear is 2
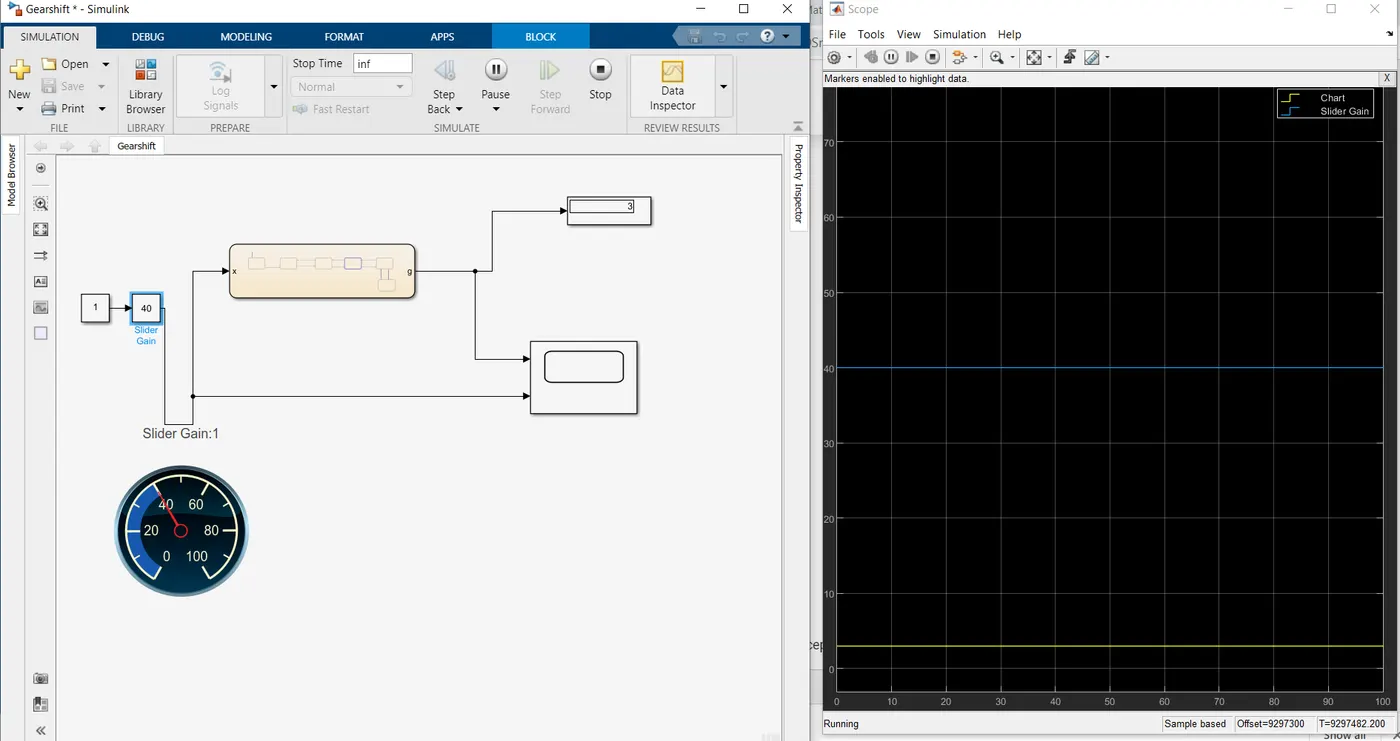
When the Speed is above 26 and below the 40 Gear is 3
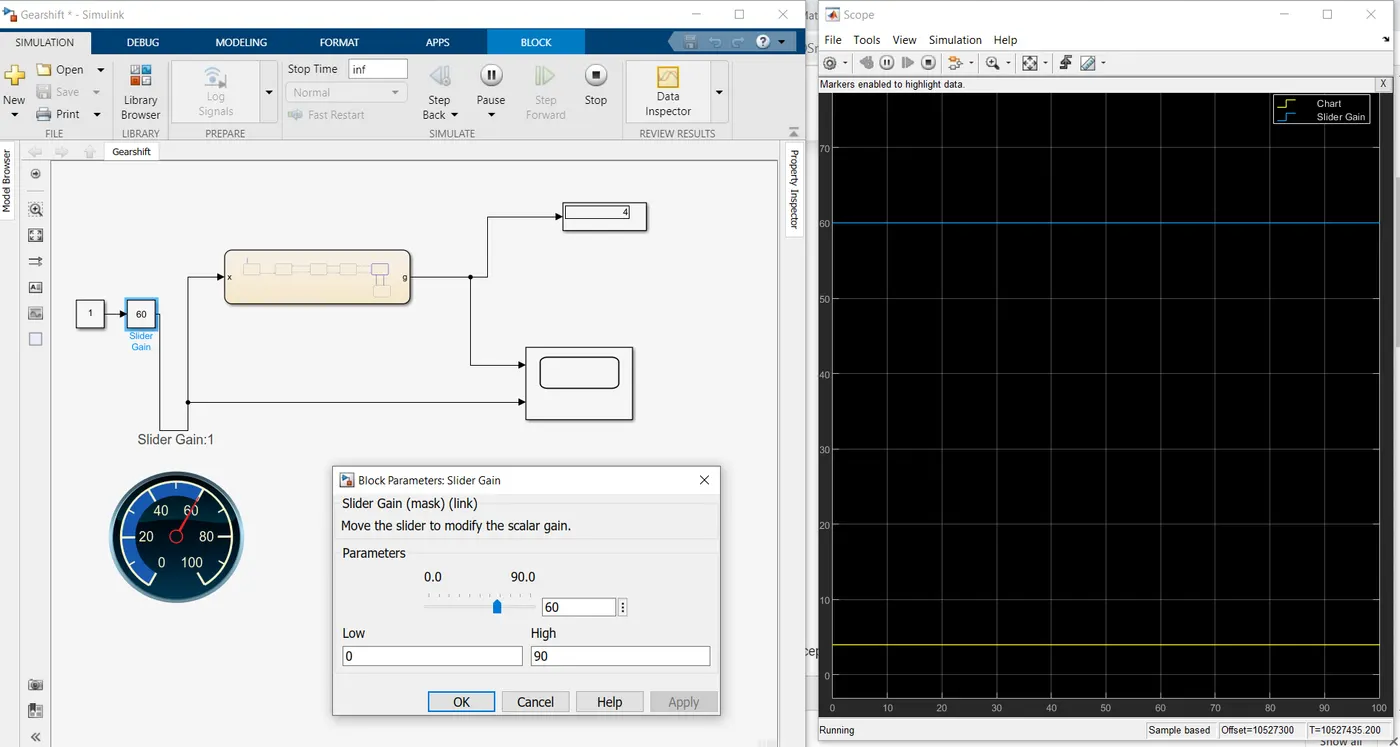
When the Speed is above 41 and below the 60 Gear is 4.
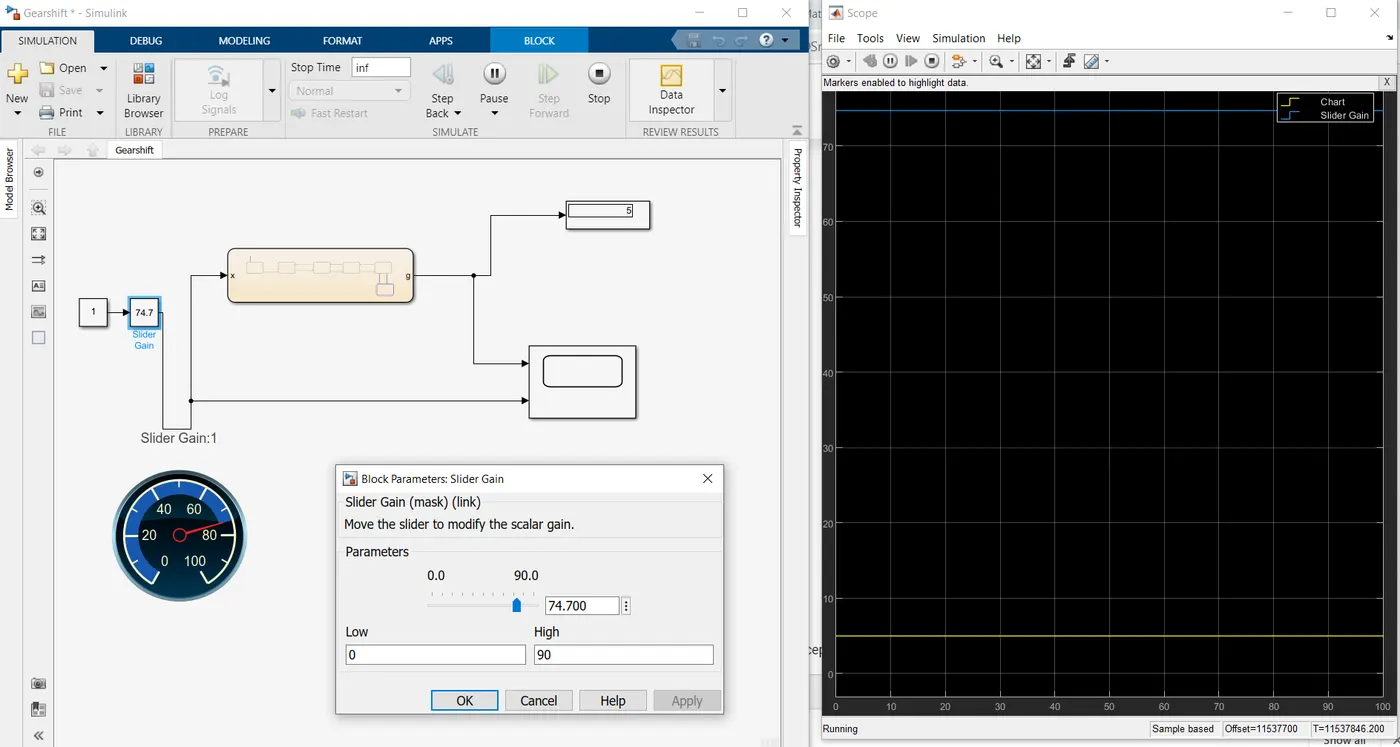
When the Speed is above 61 25 Gear is 5.
The Customized Gauage is used to indicated speed. Slider Gain is used to changing the speed according to given speed Conditions.
The Simulation time was set Inf.. The gear numbers are Dispayed according to the speed. In the Scope Ouput is Yellow line is Gear number and Bule Line is Speed.
Finally the control logic modelled and Simulation Run successfully according to Conditions .