Week - 4
SOLUTION 1: IMPLEMENT A CONTROL LOGIC OF A WASHING MACHINE USING STATEFLOW AS PER THE GIVEN SEQUENCE:
State Flow may be defined as the method of developing the control logic sequence for a machine when operating in different input environments exhibits different outputs or working state (or condition). These machines are termed as State Machines. And the different working conditions are termed as States.
For the problem given, the logic control of a washing machine is to be designed such that it includes the following states:
- Checking for the electric and water supply.
- Soaking process for 200 seconds.
- Washing process for 100 seconds.
- Rinsing process for 20 seconds.
- Drying process for 50 seconds.
The block diagram for the given problem is shown below:
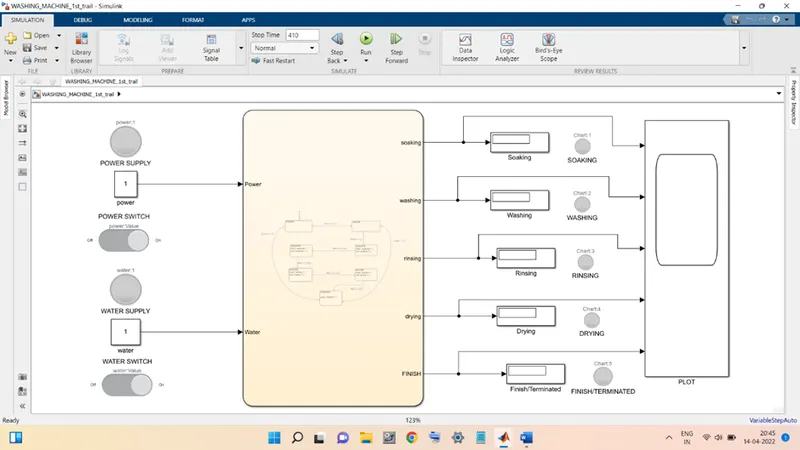
Elements present in the given block diagram are as follows:
- Constant Blocks: the constant blocks are used to provide the input signal to the system. There are 2 such blocks used namely; ‘power’ representing the power input signal source and ‘water’, representing the water supply input signal source. For both the blocks ‘1’ is for supply is available and ‘0’ when the either or both supplies are not present.
- Slider Switch Blocks: These are the blocks used to change the input signal values either to 0 or 1. The ‘on’ condition is when supply is present and ‘off’ is when the supply is not present.
- Chart Block: This block is used to develop the control logic flowchart for any Stateflow problem. This block consists of its own work environment which includes many tools, with these tools one can develop the logic chart.
- Display: Display block shows the value of its input signal. In the present problem there are 5 different display blocks used to show the output signal values from different out-ports of the chart block.
- Scope: This block is used to plot the signal input to it against the time.
- Lamps: This block is like a LED or a bulb which will turn on for a given input signal and emit create color light for a certain given input signal.
The expanded view of the CHART block is shown below:
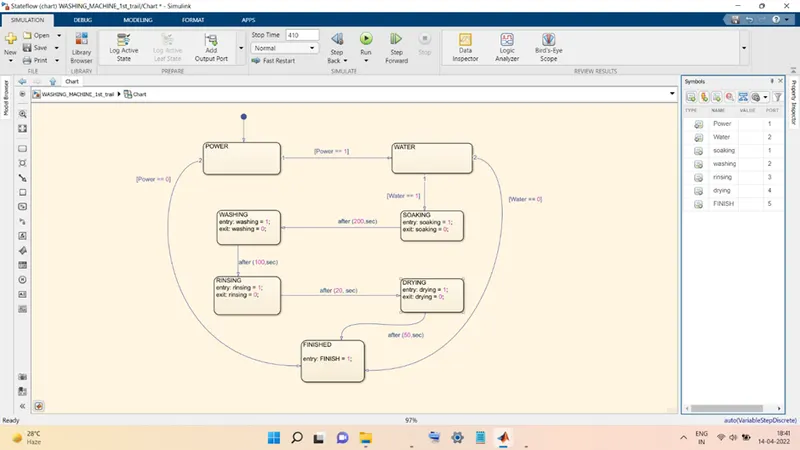
The rectangular blocks are the different states that the machine can have at any point of time.
The logic flow starts from the BLUE dot on top left of the flowchart.
The arrows represent the state transition direction i.e., the logic will change to new state according to the arrowhead directions.
First state is POWER, from this state the washing machine can move in two different directions depending upon the state transitions condition statement.
Like if there is no power supply connected to the washing machine then the logic will take the direction shown by are numbered as 2, which will immediately terminate the operation represented by the state named FINISH.
If power supply is present then the logic will follow the arrow numbered 1 and will the next state, WATER.
This state again there are two different paths for the logic and depending upon the input condition any one of them is taken up. Here the water supply condition will be checked.
If the water supply is present then logic will take the arrow numbered 1 but if there is no water supply then the arrow number 2 is taken. If arrow 2 is chosen then the process will be terminated immediately by moving straight to the state named FINISH.
when power and water supply both are present then only the logic will move from the WATER state to SOAKING state.
When the control logic is in this state there will be an output data sent by this state. This output data is named as ‘soaking’. Its value will be equal to 1 till the machine is in this state and as soon as machine leaves this state the value will change to 0.
As shown in the block diagram the out signal from the soaking out-port is fed to a display block (named Soaking). This display block will show the value of the output signal from the soaking port.
A lamp with name SOAKING, also is connected to the signal from this output port, such that whenever the value of this signal is equal to 1 the lamp will glow in green and whenever it is equal to 0 the lamp will glow in red color. Finally, the output signal is fed to a scope named PLOT, in order to see the variation of the output signal against time.
The logic will stay in the SOAKING state for a time period equal to 200 seconds as the delay is given to the logic flow.
After 200 seconds the logic control will automatically shift from SOAKING state to WASHING state.
In the WASHING state, a new output signal, ‘washing’ will be sent out from the chart block such that its value is 1 till the machine is in this state and when the machine will exit this state the value of ‘washing’ will change to 0.
This output signal, just like the previous output signal will be fed to a scope ‘Washing’ then to a lamp ‘WASHING’ and finally to the scope ‘PLOT’ to get the required outputs.
The machine will move to next state after a delay of 100 seconds.
The next state is known as ‘RINSING’. in this state, the output signal ‘washing’ is sent out. It is equal to 1 till machine is in the current state and will be 0 once the machine moves to next state.
The signal is again fed to the display ‘Rinsing’ then to a lamp ‘RINSING’ and finally to the scope ‘PLOT’ to get the required outputs.
The machine will move to next state after a delay of 20 seconds.
The next state is known as ‘DRYING’. in this state, the output signal ‘drying’ is sent out. It is equal to 1 till machine is in the current state and will be 0 once the machine moves to next state.
The signal is again fed to the display ‘Drying’ then to a lamp ‘DRYING’ and finally to the scope ‘PLOT’ to get the required outputs.
The machine will move to next state after a delay of 50 seconds.
The next state after all these states is the FINISHED state. It is the state which shows that all the operations are completed and the task given to the washing machine thus stands completed.
The output signal from this state is ‘FINISH’, that is fed to the display ‘Finished/Terminated’ then to a lamp ‘FINISH/TERMINATED’ and finally to the scope ‘PLOT’ to get the required outputs.
The above discussed control logic is now checked for different input conditions which are mentioned below:
BOTH POWER SUPPLY AND WATER SUPPLY ARE OFF:
First, both the power supply and water supply lamps are red showing there is no power or water supply connected to the washing machine.
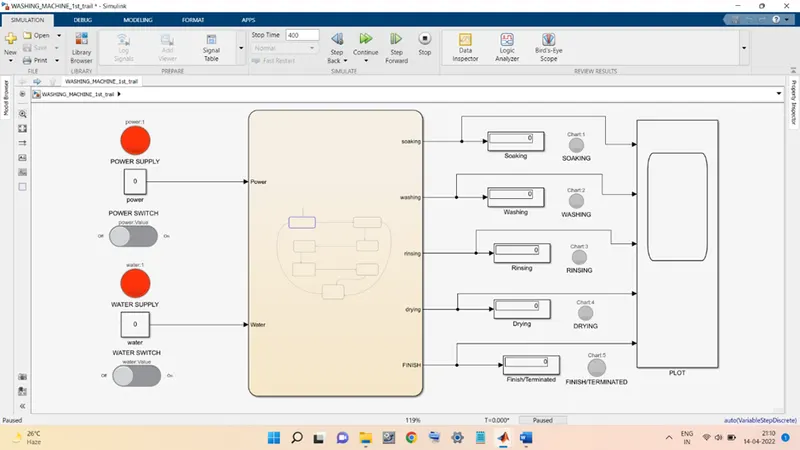
Also, in the chart block the blue highlighted state is shown, which tells the machine is at the first state of the control logic.
Next, control logic checks for the power supply and water supply and since there is no input given the control logic will straight away jump to the FINISHED state, as shown in below figure:
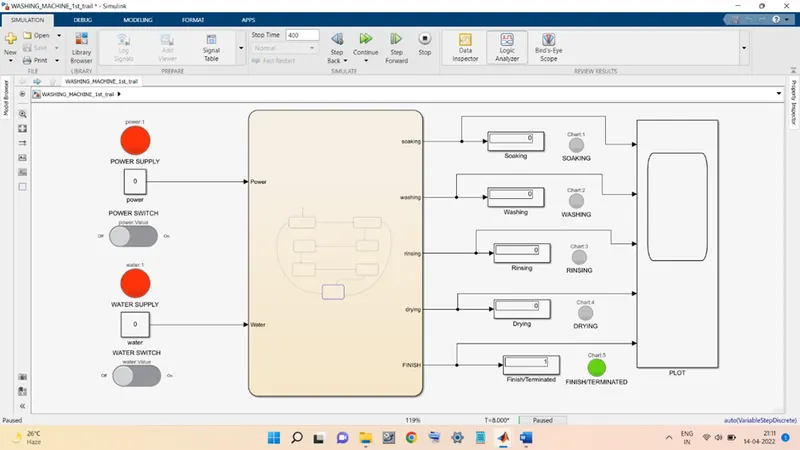
It can be seen that the FINISHED/TERMINATED lamp is green. Now the result in the PLOT will be seen:
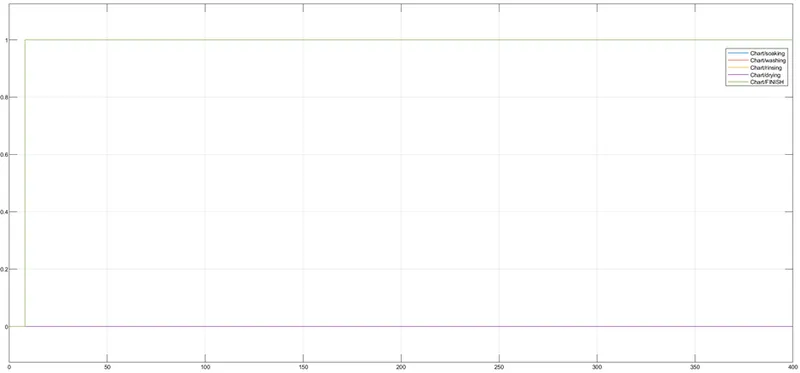
It is clear that the machine finished the operation within the first 10 seconds.
WHEN POWER SUPPLY IS ON BUT WATER SUPPLY IS OFF:
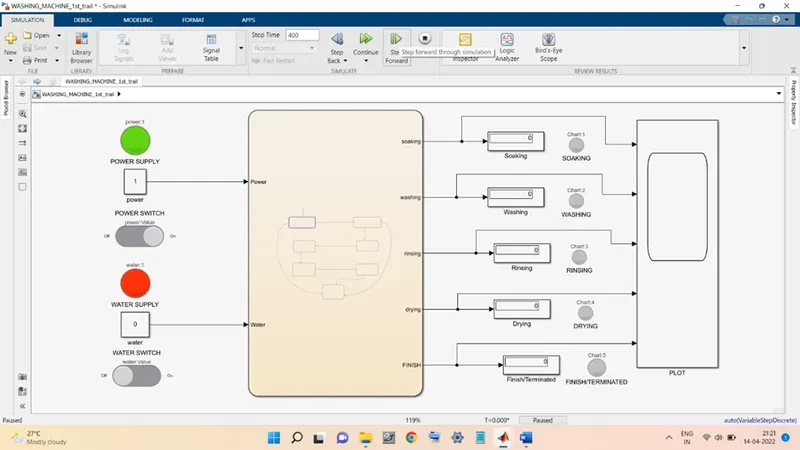
Above figure shows that the power supply is connected but the water supply is still off. The machine is at the first state.
The next step is shown below:
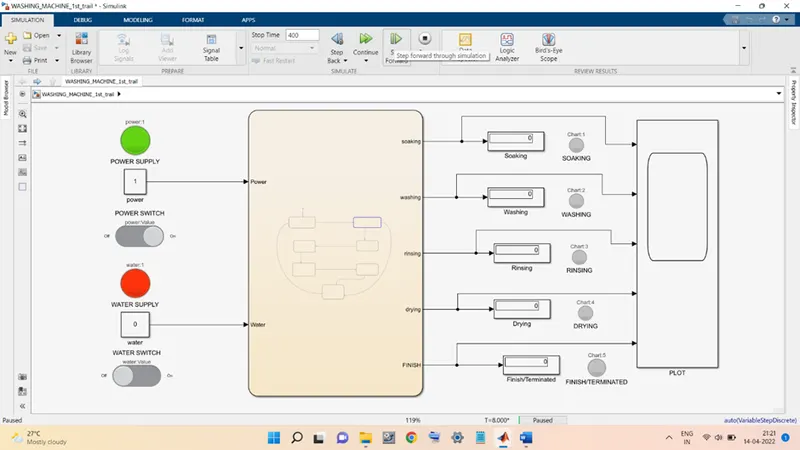
The machine is in the second state (WATER). Here it will check whether water supply is on or off and move to next state based on that result. Since, the water supply is off so the machine will directly jump to the FINISHED state, as shown below:
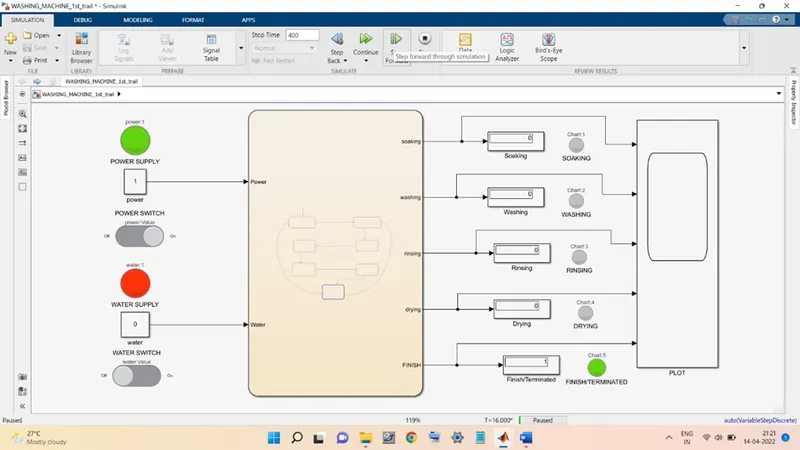
The lamp FINISHED/TERMONIATED is now green.
The plot obtained for this input condition is shown below:
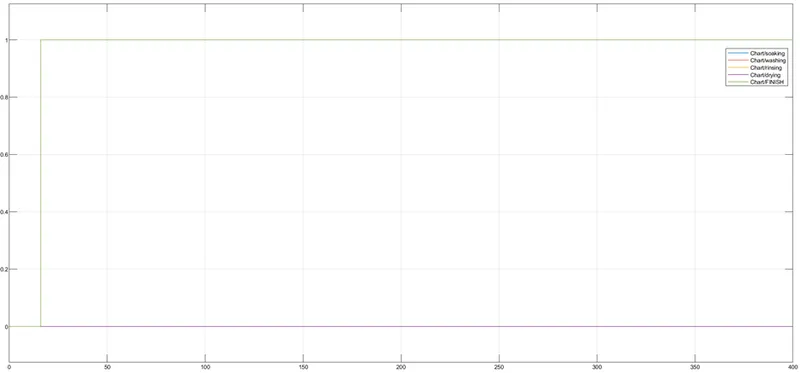
Again, the machine terminated the task is first 10 seconds time interval.
WHEN BOTH POWER SUPPLY AND WATER SUPPLY ARE ON:
The given input conditions are shown in figure below:
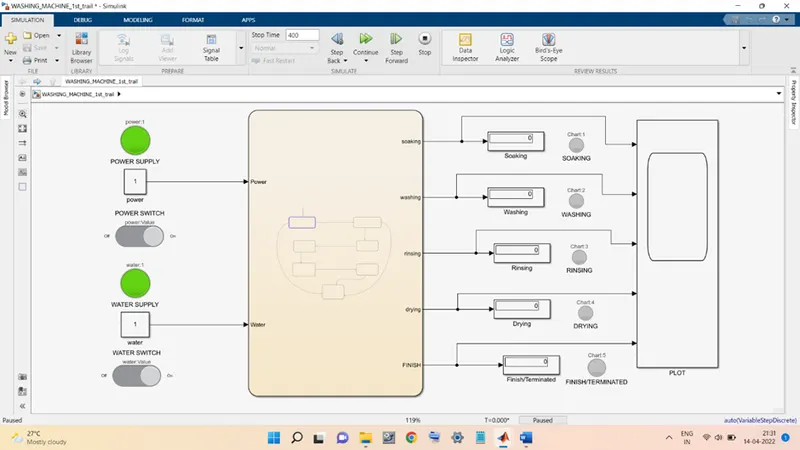
Both the lamps for the power and water supply are now green. The machine now can be seen to be at the first state of the control logic diagram. The power supply condition is checked here and then it will move to next state which is the WATER state, shown below:
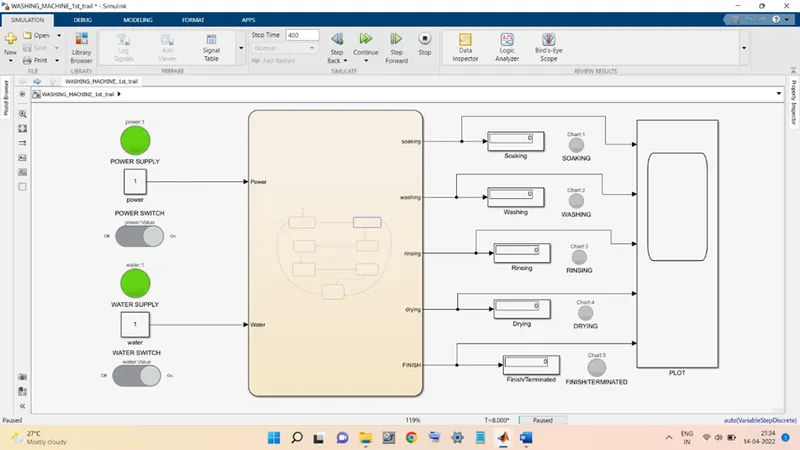
Here, the water supply condition will be checked. Both the inputs are connected to the washing machine therefore now it will move the ‘soaking’ state, as shown below:
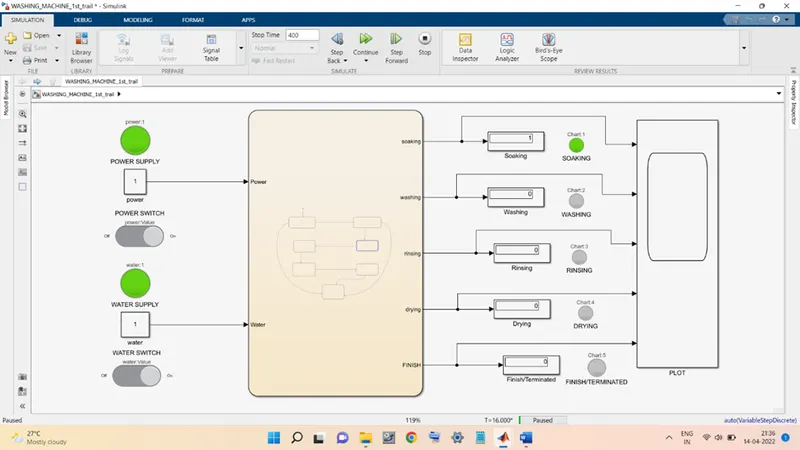
The lamp corresponding to the soaking state is now green showing that the machine is currently in the soaking state. The plot during this state will be:
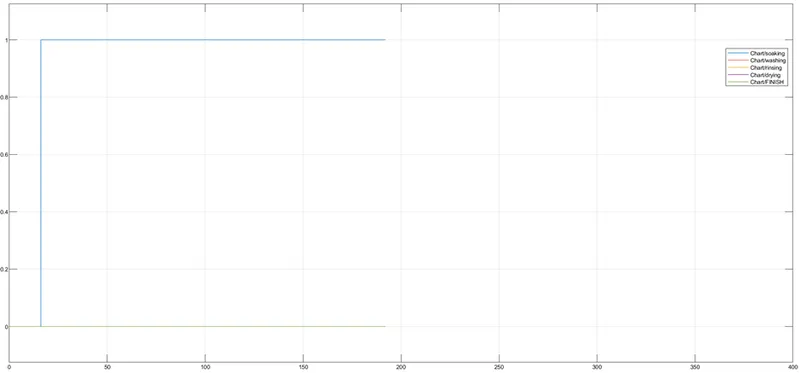
This plot is just before the 200 seconds delay is completed.
Once the 200 seconds delay is completed, the machine will move to the next state which is the washing state. This can be seen in figure below:
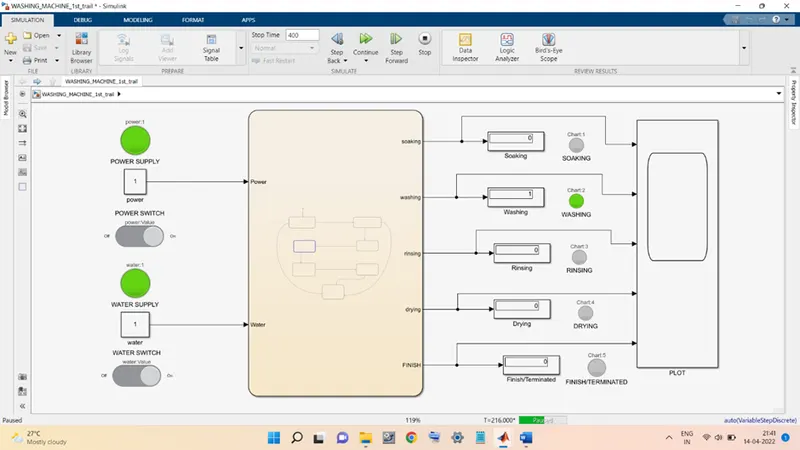
The lamp corresponding to the washing state is now green also the display is showing the value 1 implying the same. The plot for this state is shown below:
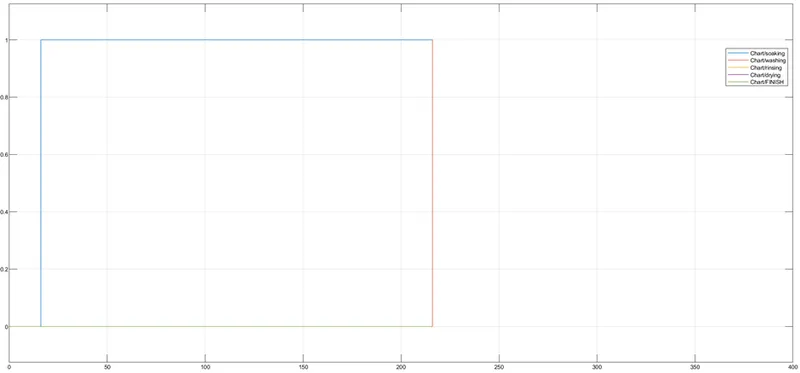
The red spike shows the washing state is just activated.
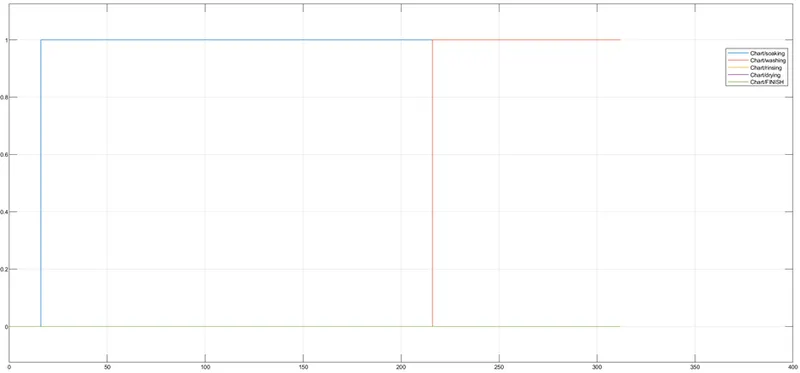
This is how the washing state will proceed and after the 100 seconds delay is completed the machine will jump to the next state which is the ‘rinsing’ state, as shown below:
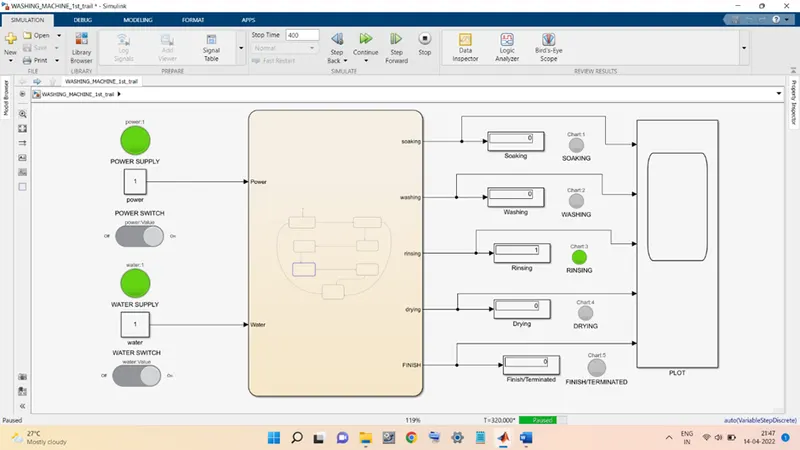
The display of the rinsing state shows value 1 and the lamp also is green showing that the machine is now in the ‘Rinsing’ state of the control logic. The plot for this state is as follows:
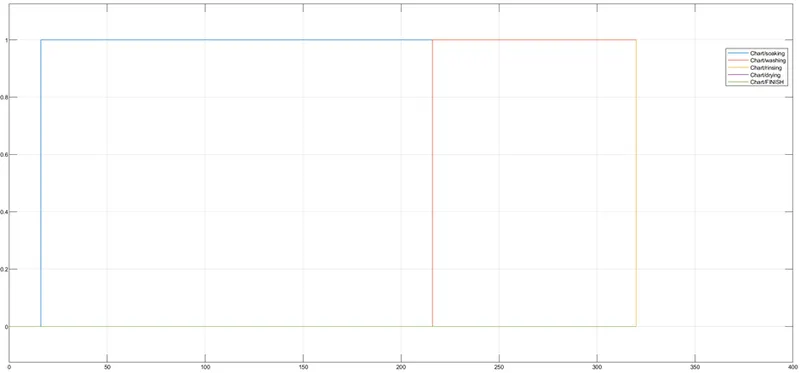
The yellow spike in the plot shows the Rinsing state activation and for the next 20 seconds the machine will be in this state only, as shown below:
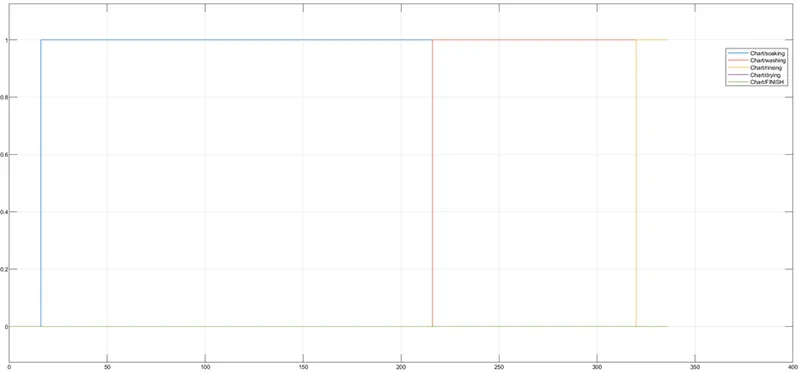
After 20 seconds the machine will enter in the next state which is the ‘Drying’ state, as shown below:
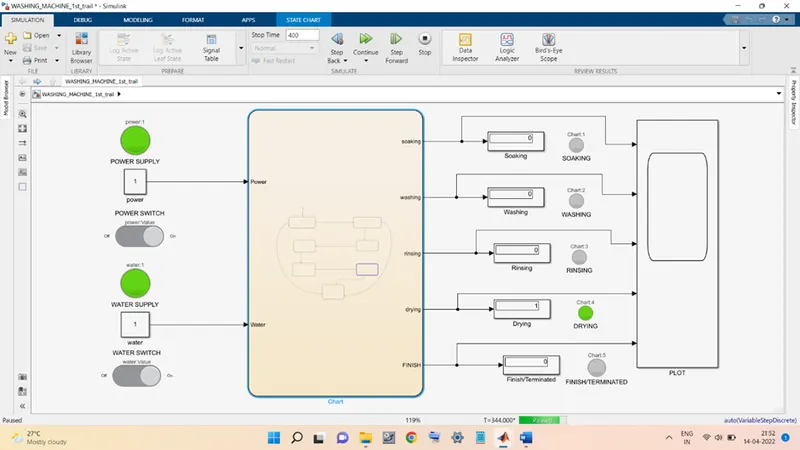
The display for the Drying state shows the value 1 and the lamp is also now green showing the machine has entered into the Drying state. The plot for this state is shown below:
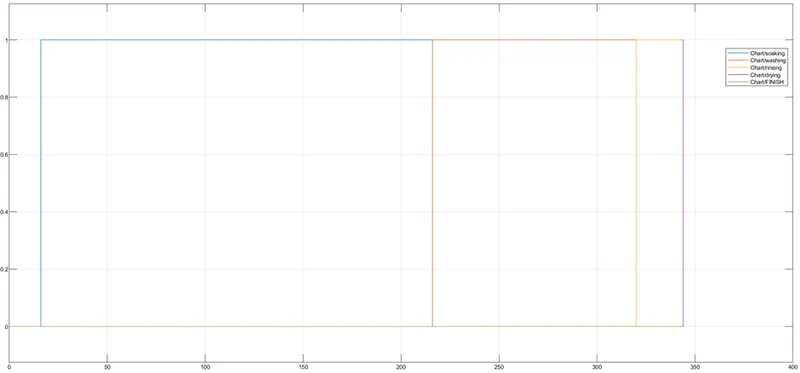
The purple color spike shows the activation of the Drying state. The machine will be in this state for next 50 seconds as shown in figure below:
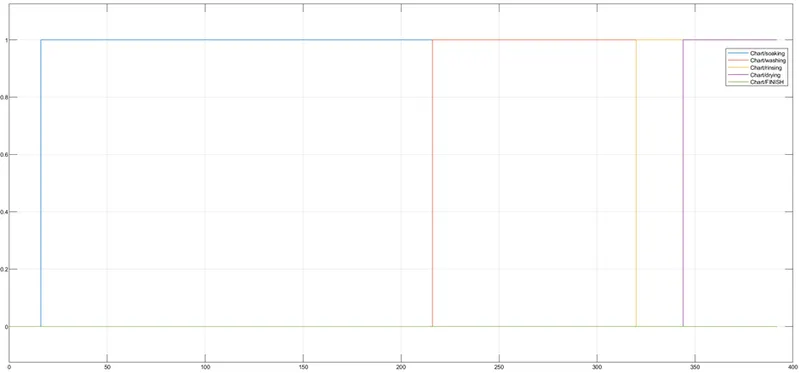
After 50 seconds the machine will enter the FINISHED state, as shown below:
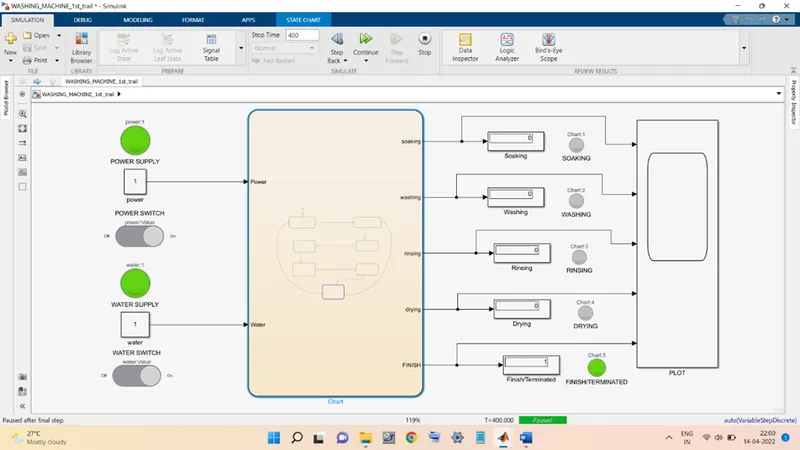
The plot showing the activation of FINISHED state is shown below:
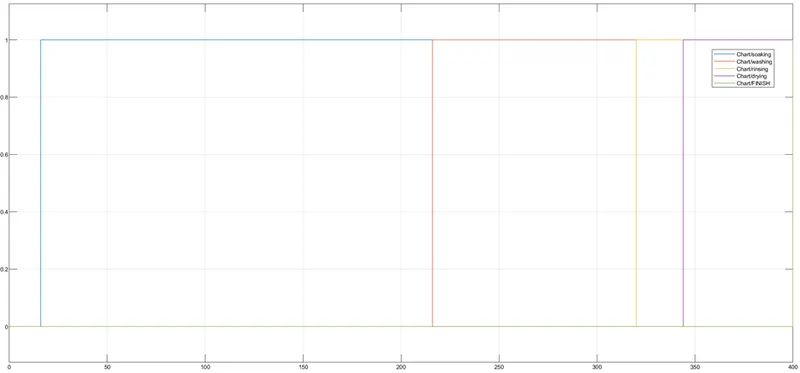
The green color spike at time equal to 400 seconds shows the activation of the FINISHED state.
This completes all the conditions which will be encountered during the Stateflow of the logic diagram of a washing machine.
SOLUTION 2: TO MAKE A SIMULINK CHART FOR THE “GEAR SHIFT” LOGIC AS PER GIVEN CONDITIONS:
|
SPEED (IN KMPH) |
GEAR |
|
0-15 |
1 |
|
16-25 |
2 |
|
26-40 |
3 |
|
41-60 |
4 |
|
Above 61 |
5 |
The block diagram for the given problem is shown below:
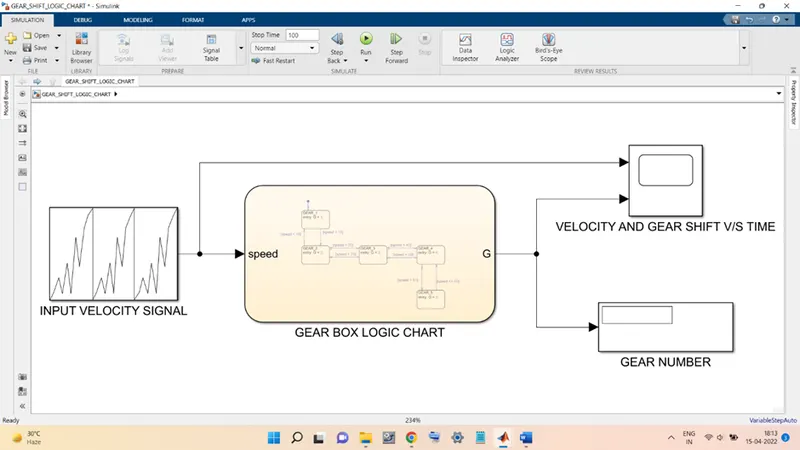
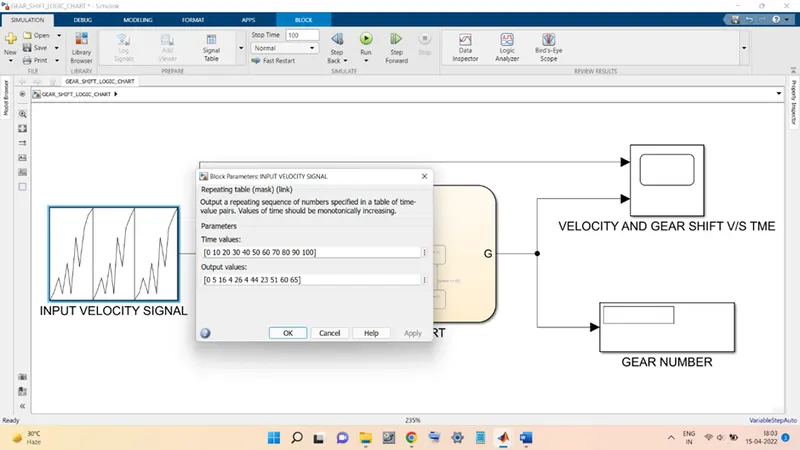
Elements of the presented block diagram GEAR_SHIFT_LOGIC_CHART are as follows:
- Repeating Sequence Block: This block is a source type block; it is used to generate an input signal that is sent into a system. For this case, the time values vary from 0 to 100 in step-size of The output values are randomly selected. The values can be seen:
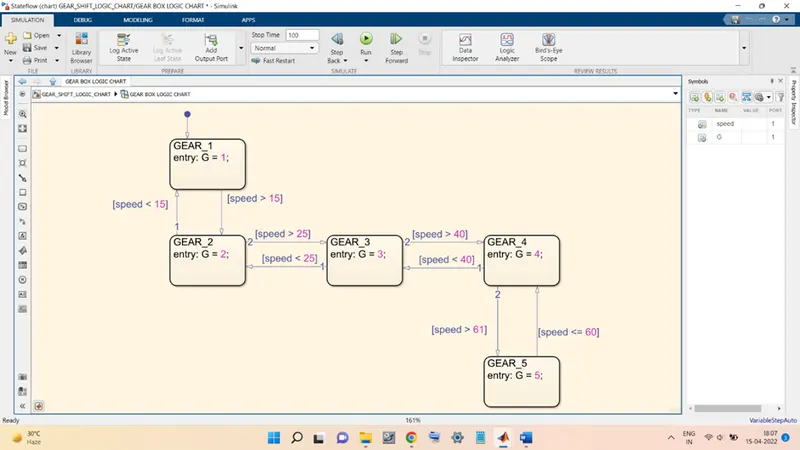
- Chart block: This block is the most important block since this block contains the Stateflow control logic for the given problem. The name given to the chart block is ‘GEAR BOX LOGIC CHART’. The chart block containing all the states for the gear shift logic flow:
- Display Block: This block will display the value of the signal that is fed into it as input to this block. The block is named as ‘GEAR NUMBER’. It will show the number of the gear for the given velocity value.
- Scope Block: This block will plot the input given to it against the time. In the present problem this block is named as ‘VELOCITY AND GEAR SHIFT V/S TIME’. There are 2 inputs given to the scope block; one is the input to the chart (velocity) block and the other is the output from the chart block (gear number). So that, the variation of both the signals can be seen on a common time axis.
Flow of the Gear Shift logic diagram:
The first state of the gear shift logic diagram is GEAR_1. When the gear box is in this state an output signal named, ‘G’ will be sent out from the chart block as an output signal. The value of this signal, for the time when gear box is in the first state, is equal to 1. It implies that whenever the gearbox is in state 1, the gear number is equal to 1.
The state diagram during the first state is shown below:
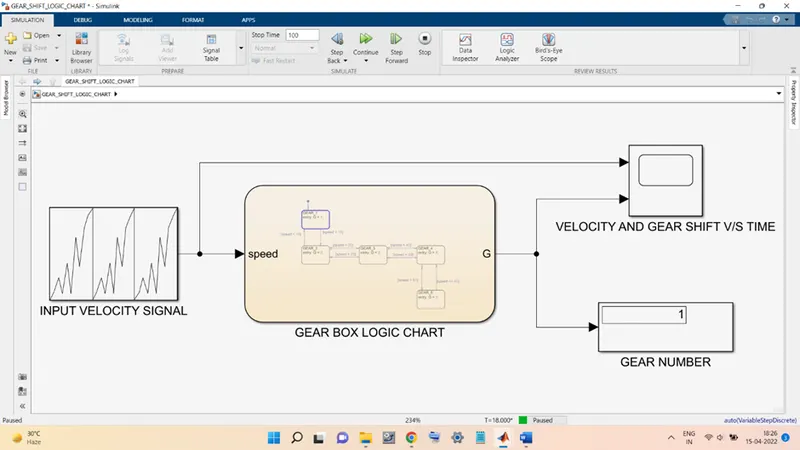
The display ‘GEAR NUMBER’ shows the gear number as 1.
In the chart block, the highlighted blue rectangle is the state in which the gearbox is in right now.
The output of the scope will be seen now,
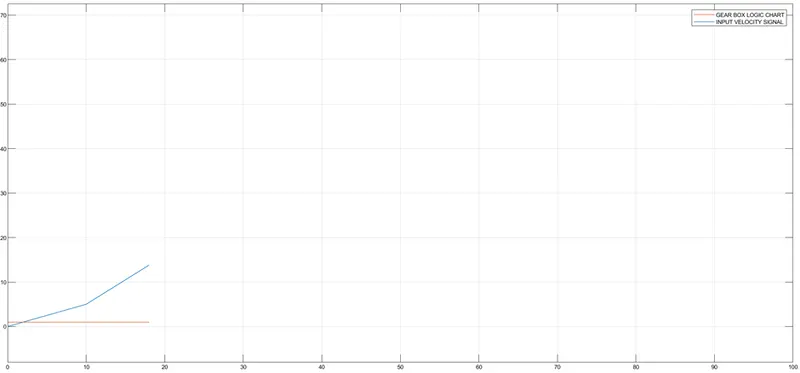
In the above figure, the blue line is the input velocity from the repeating sequence block and the red line is gear number (output from the chart block). On zooming, the above figure is like this:
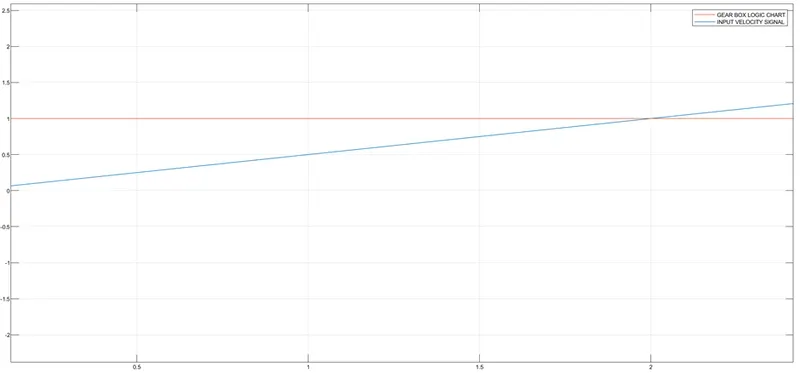
It can be seen that the output gear umber value is constant (equal to 1). This is because the state condition is such that the gear will change only when the velocity value is above 15 kmph, below this the gear number has to be 1.
When the time value reaches 20 seconds, the velocity value will be greater than 15 kmph and at that instant the gearbox state will change to the second state named as, GEAR_2 and move to next state, as shown in the figure below:
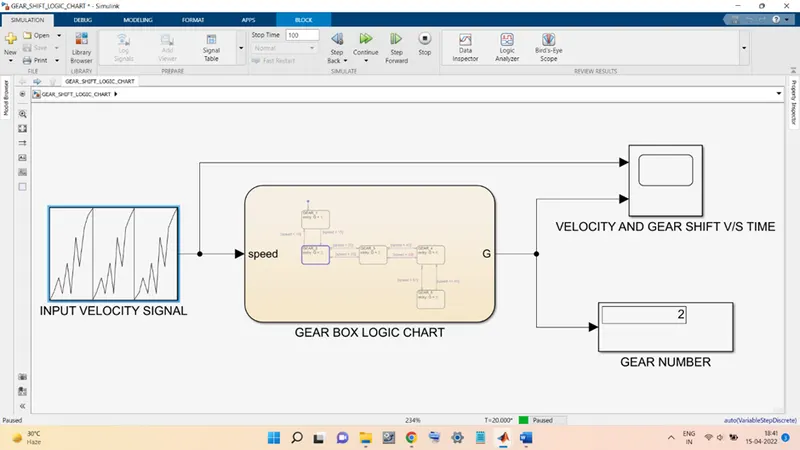
The Display block now shows the gear number value as 2.
The plot, at this instant, in the scope block is shown below:
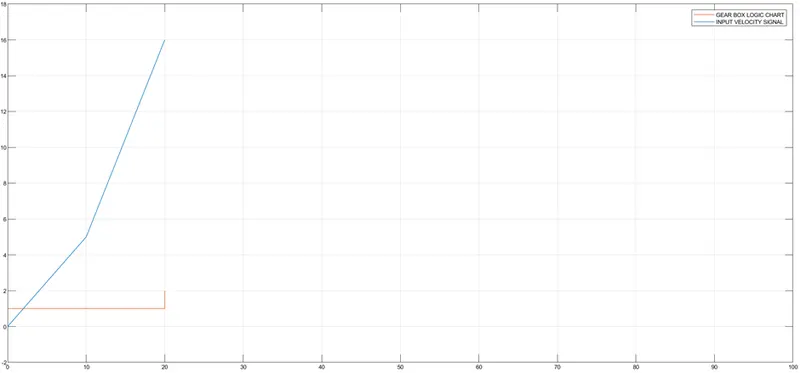
The plot shows the change in gear number line (red line) from 1 to 2.
Moving ahead, the velocity gets reduces from the threshold value of 15 kmph. As a result, the state of the gearbox is changed from second state to the first state, as shown in the figures below:
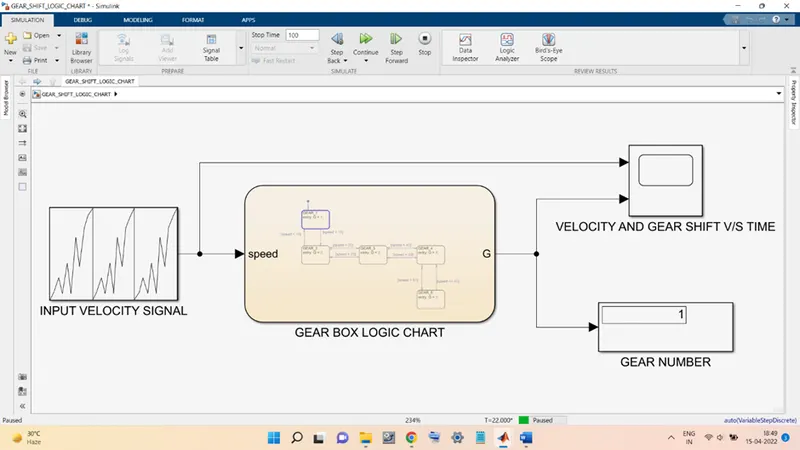
The plot:
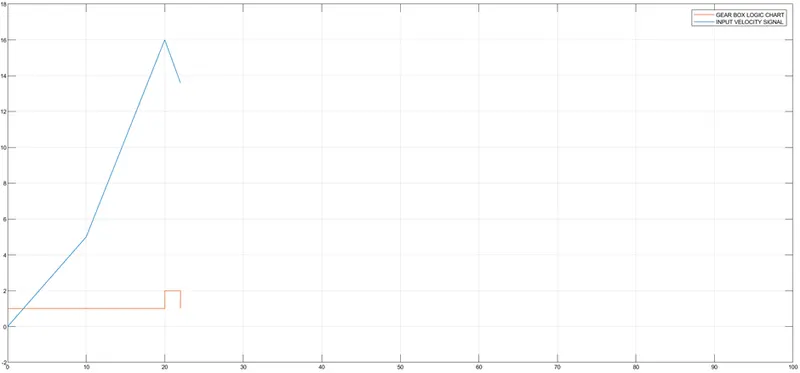
Now at time instant of 36 seconds, the velocity gets greater than the threshold criteria and as a result the gearbox shifts to second state.
For time equal to 40 seconds, the velocity is greater than 25 kmph. This exceeds the threshold criteria to move to the next state. Ass a result, the gear box enters the next state, GEAR_3. This is shown by the figures below:
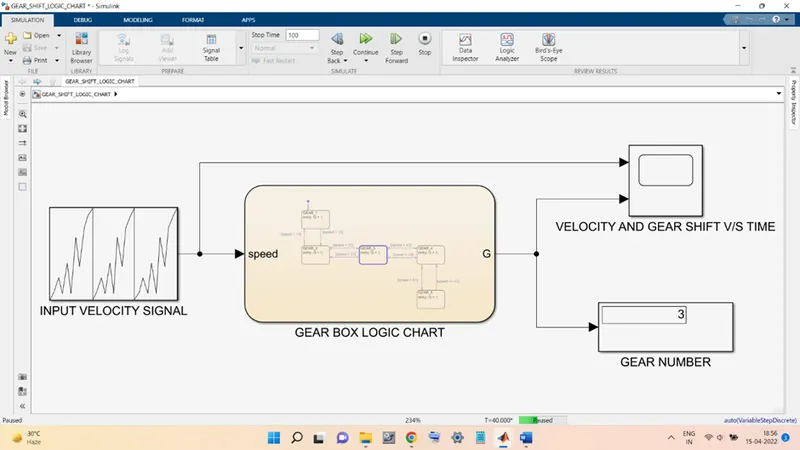
Display shows the gear number is equal to 3.
The plot till 40 seconds is:
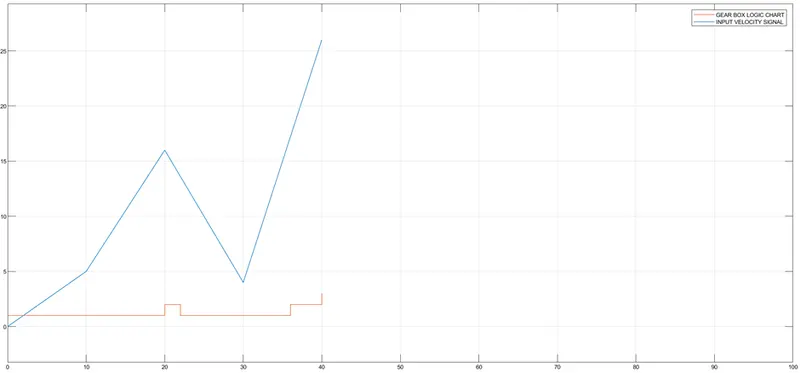
At time equal to 42 seconds, the gearbox again shifts to the second state, since the velocity is lower than 25 kmph.
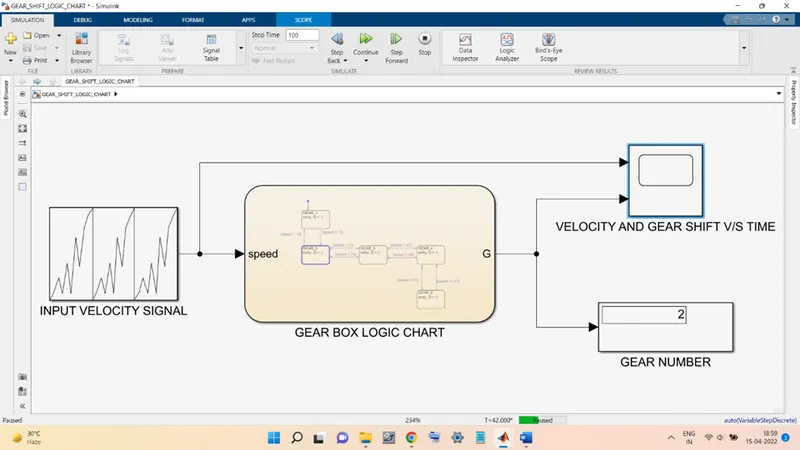
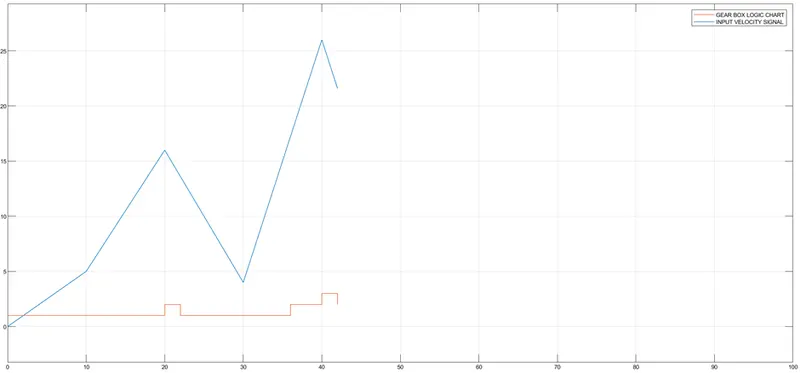
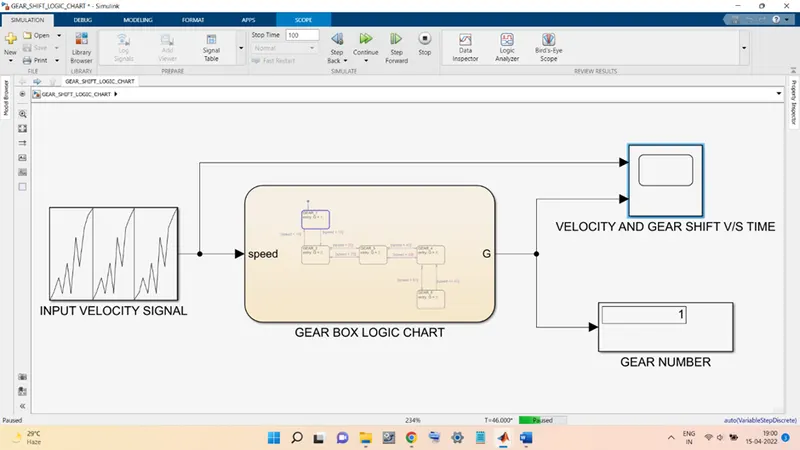
And for time equal to 46 seconds. The gearbox shifts the state to the first state:
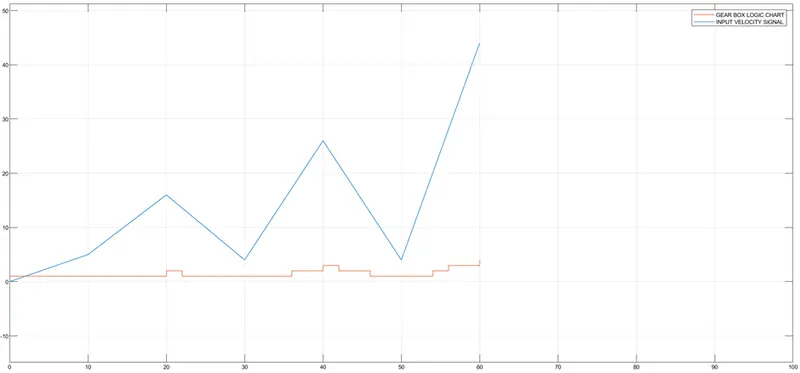
At time = 54 seconds, gearbox moves from first state to second state.
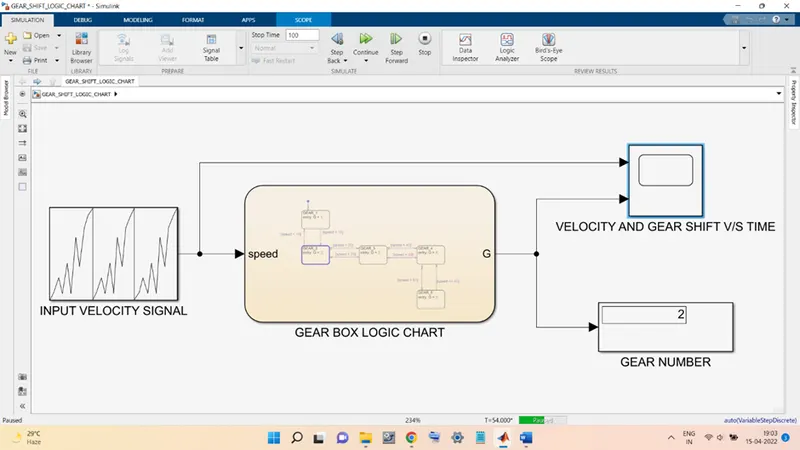
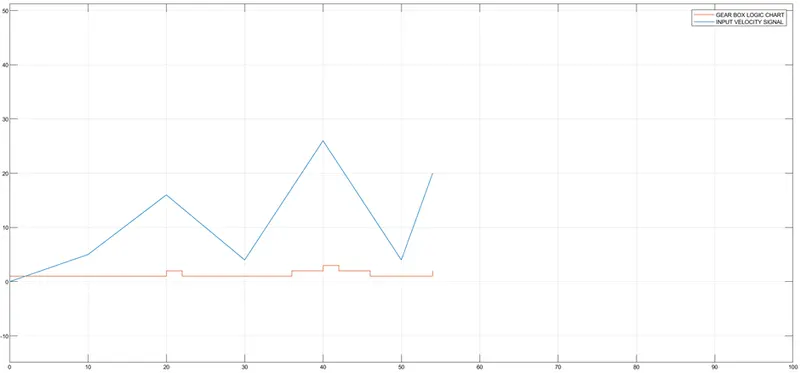
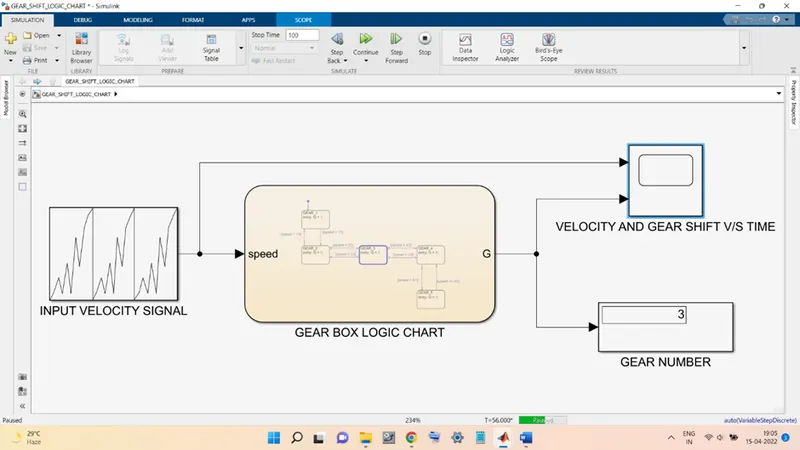
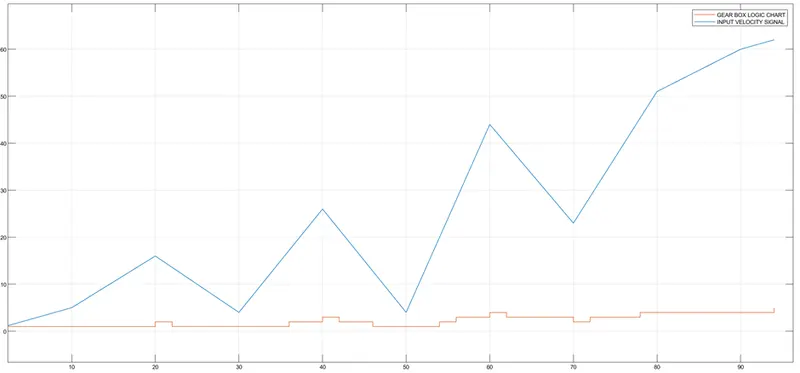
At time = 56 seconds, it changes from second state to third state.
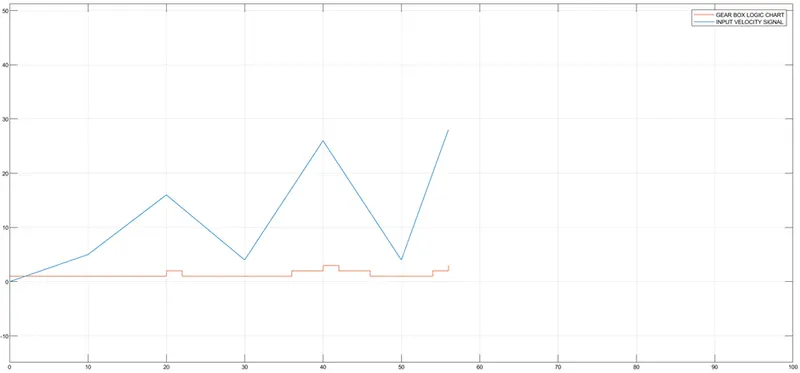
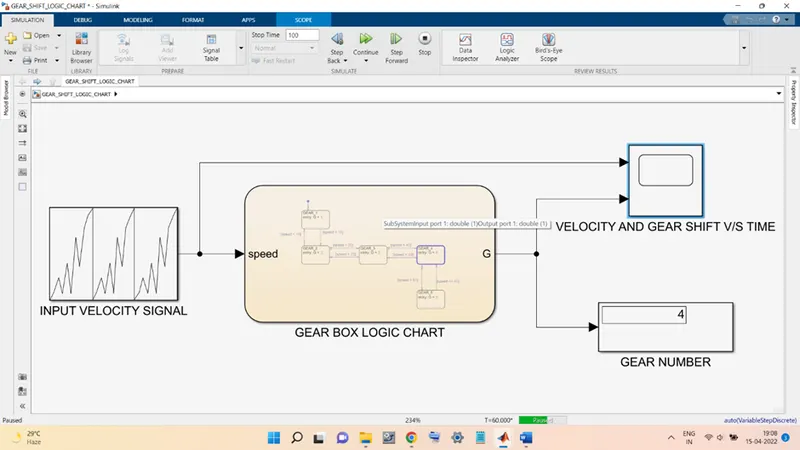
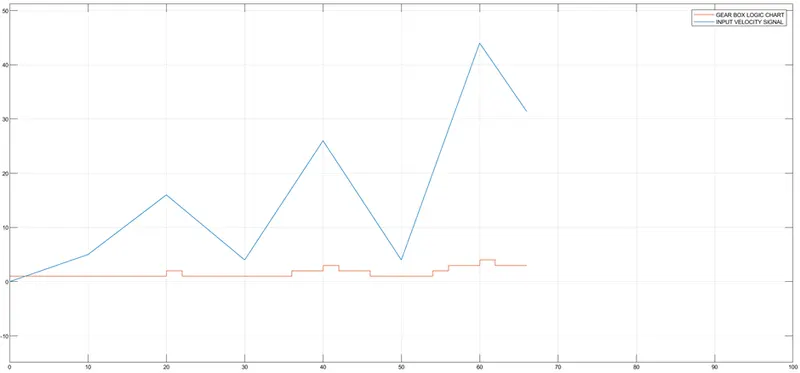
At time = 60 secs, the gearbox moves from the GEAR_3 state to GEAR_4 state. As shown below:
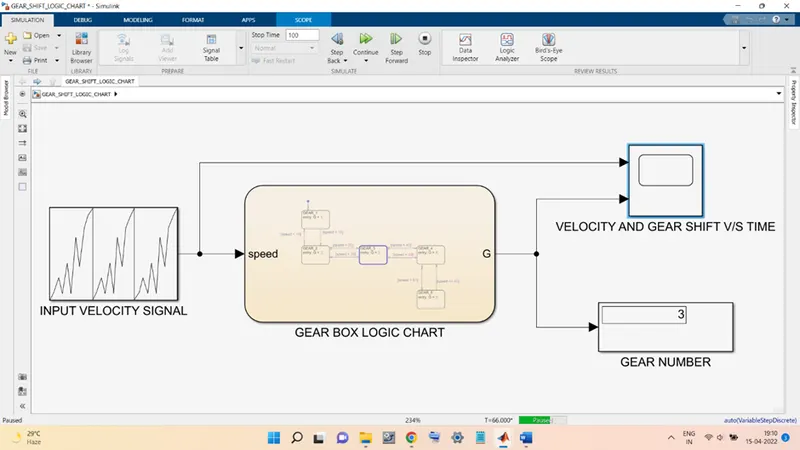
At time = 66 secs, the gearbox shifts the state back to GEAR_3 state
At time = 94 secs, the velocity is greater than 61 kmph and thus the gearbox will shift from the state GEAR_4 to GEAR_5 state. As shown below:
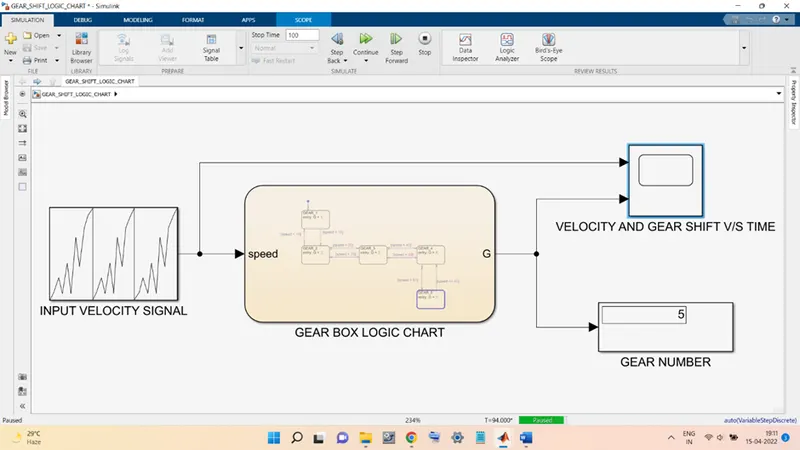
The display shows the gear number is 5.
The plot till 94 secs is:
Finally, after 100 seconds the plot from the scope block is like this:
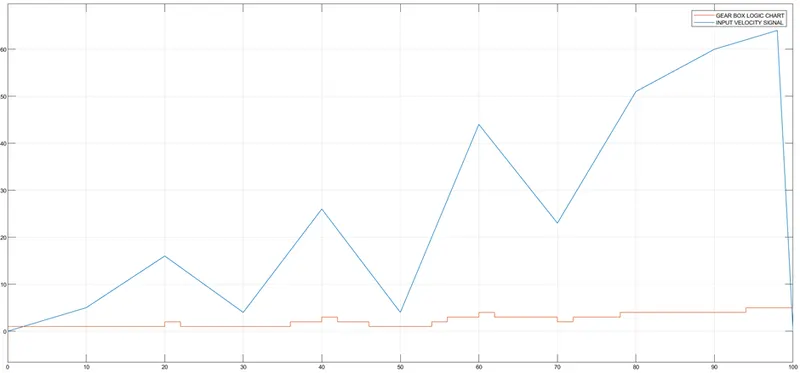
With this at the possible states that can be taken by the gearbox are complete.