Week - 4
Q1. Implement Control Logic of a Washing Machine Using Stateflow :
Block Diagram :
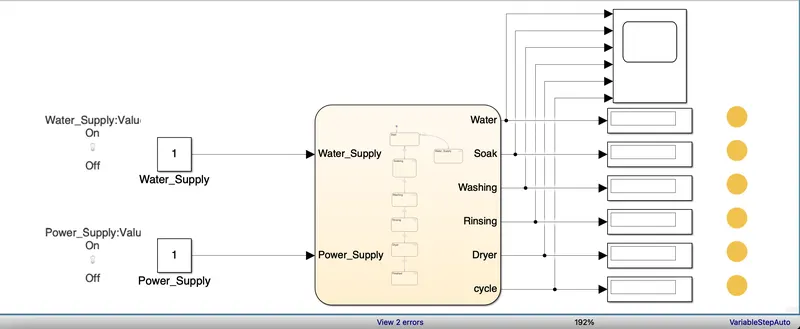
- In Block diagram The Washine Machine is showen by use of Water supply and Power Supply switches.
- Then it is given to the constant value, Then it is given to the Chart and then output is showen by use of display.
- When the Process is Done the light bulb used will blink and then process ends.
Chart Representation :
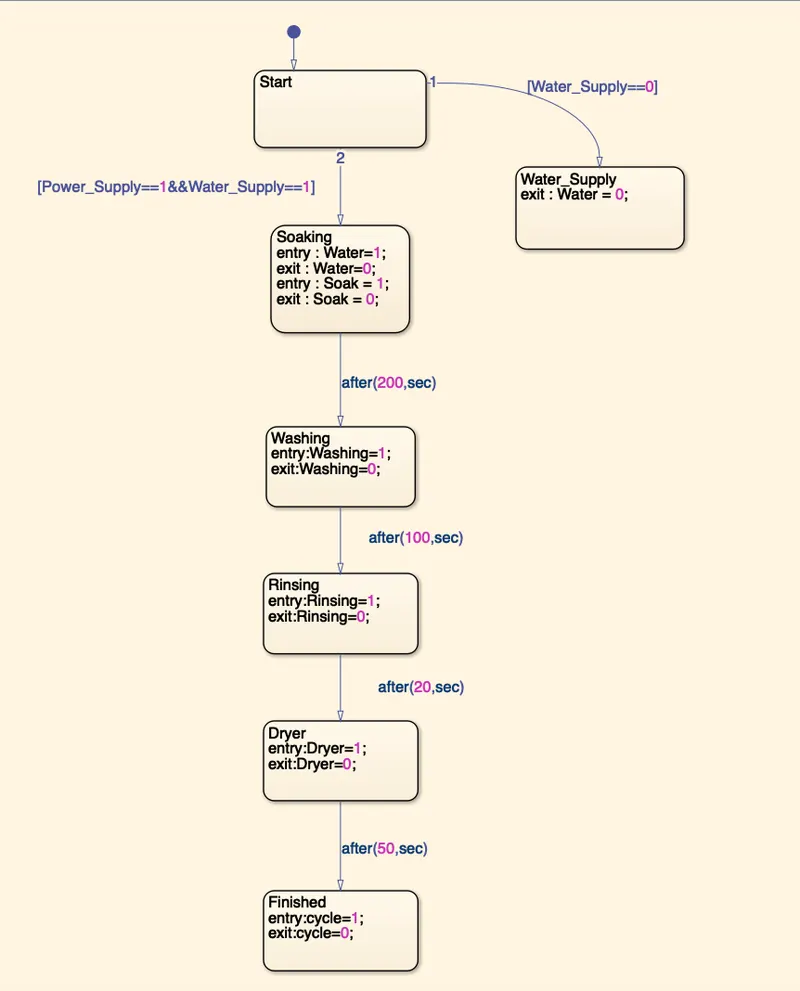
- In Chart Representation is used to represent the Process and each process is seprated by time.
- Each Block is used to represent a process and each process is used to contain N number of Process.
- Each process is used to have certaine time interval.
Parameter :
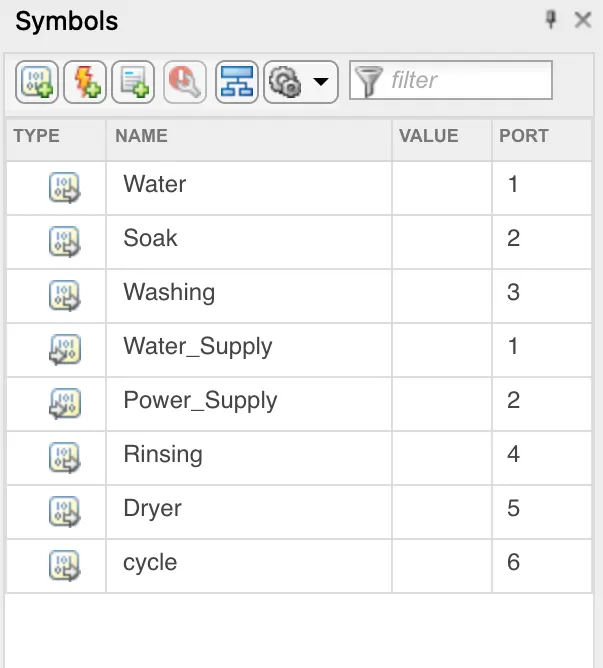
- The Parameter is used to show eaither it's going to be input or output Parameter.
- Each name is used to determine a value eaither input value or output value.
- After the Parameters are denoted then, they are assined to sertaine ports.
- Water_Supply and Power_Supply are input values to be taken into consideration.
- Water, Soak, Washing, Rinsing, Dryer and Cycle are output Values.
Simulation Timing :
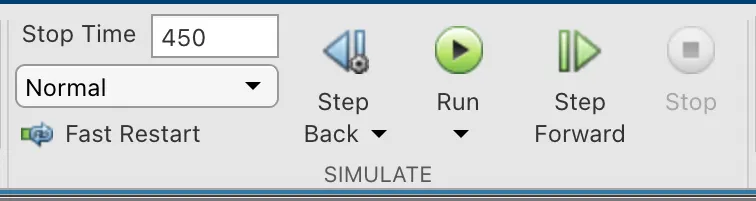
Simulation Timing are used to simulate the process. Which are 450 sec is used to simulate all the process and to get the desired output.
OUTPUT :
Block Diagram :
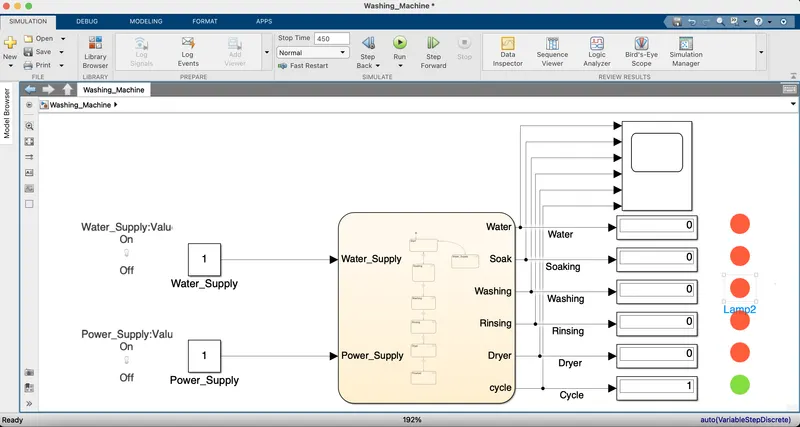
- When End of timing, the simulation process is said to be complete.
- The Cycle of the washing machine is said to be over by the time.
- Then Display is used to display the graphs and the bulb is used to denote end of process.
Graphs :
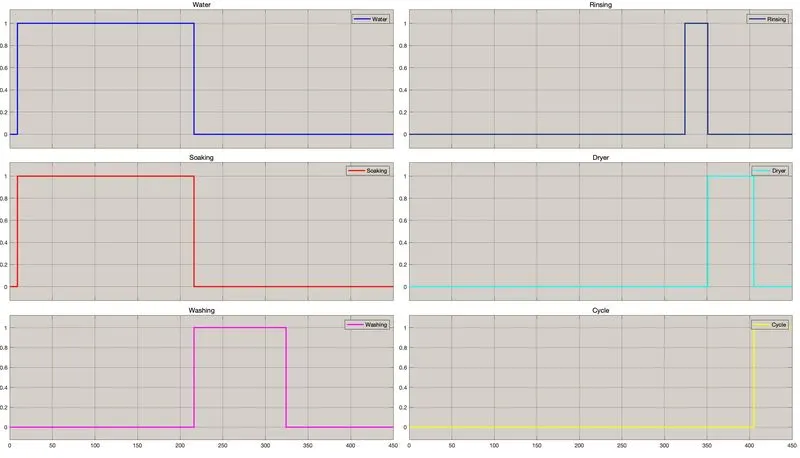
- Graphs Shows the Overall Process and each process is seprated into seprate graphs.
- Each Graphs are different process and with unike time process.
- Therefore the green bulb is used to denote that the cycle as ended.
Q2. Making a simulink chart for " Gear Shifter " logic as per below condition :
Speed(Kmph) Gear
00 to 15 1
16 to 25 2
26 to 40 3
41 to 60 4
61 above 5
Block Diagram :
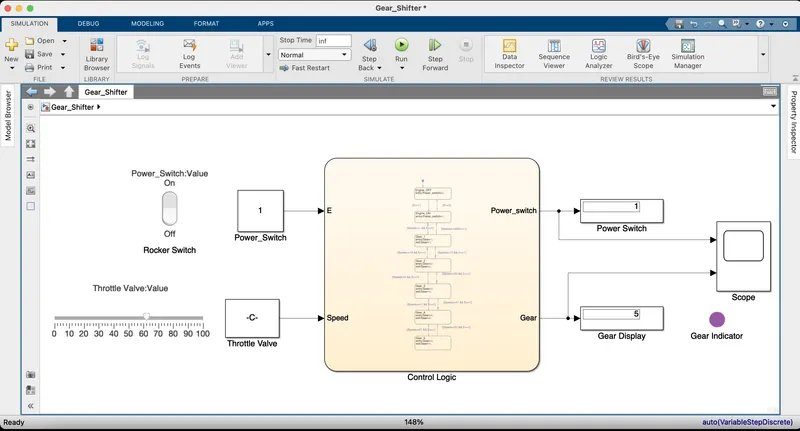
- In This Diagram contains blocks of sets which are Switch, constant, Throttle Controler, Display, Scope, Gear indicator and Chart Logic.
- In Chart Logic or Control Logic Contains the set chart which controles the Gear shifter and indicator to show Which Gear is now active.
Chart Representation :
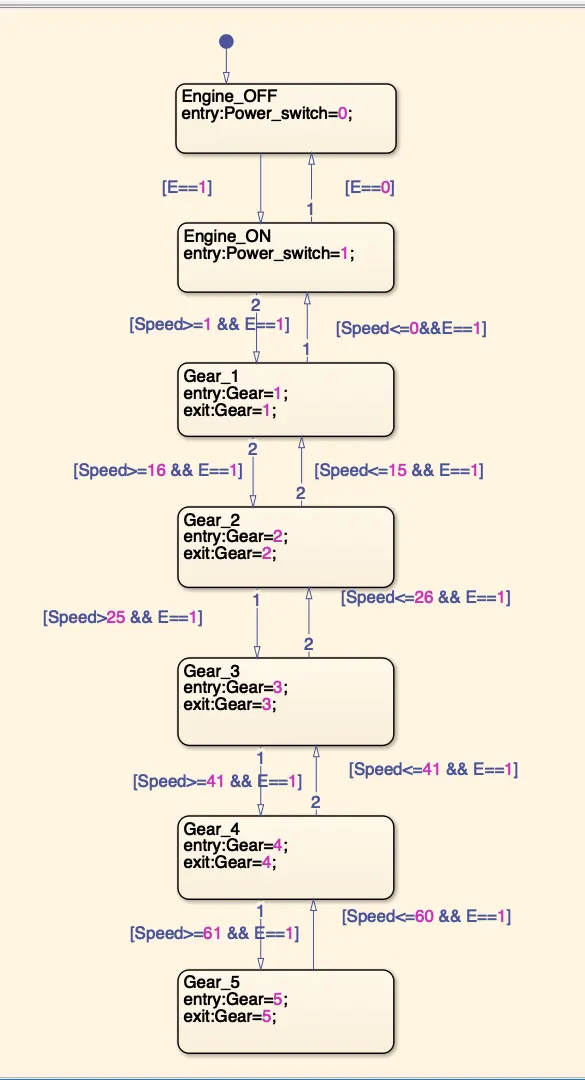
- In Chart Logic or Control logic, Chart is started with Engine_OFF controll. when the switch is OFF the controll does not go any feather.
- If the Switch is ON then the contoller will move feather to Engine_ON controll, Then the engine is said to be started and Power supply is ON.
- Then Gear Shifter is Moved to Gear_1 to Indicate that Gear is in 1st position, When the speed is inbetween 0 to 15.
- When the Speed increases the Gear will Shift accordingly upto 5th Gear.
Parameters :
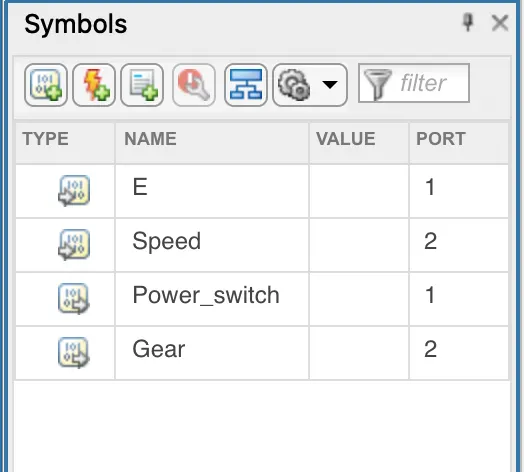
- The Parameter is used to show eaither it's going to be input or output Parameter.
- Each name is used to determine a value eaither input value or output value.
- After the Parameters are denoted then, they are assined to sertaine ports.
- E and Speed are input values to be taken into consideration.
- Pwer_Switch and Gear are output values of the controller logic.
Simulation Timing :
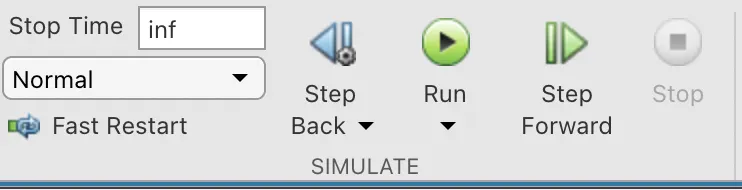
- In this Case the Timing for the simulation to run is taken as infinite. So that the Simulation will run in till stop button is pressed.
OUTPUT :
Block Diagram :
- In this diagram the Gear is Shifted to 5th Gear and the indicator is indicating the colour of the gear.
- When the speed is increased the gear shift will change according to the speed value.
Color Indicator :
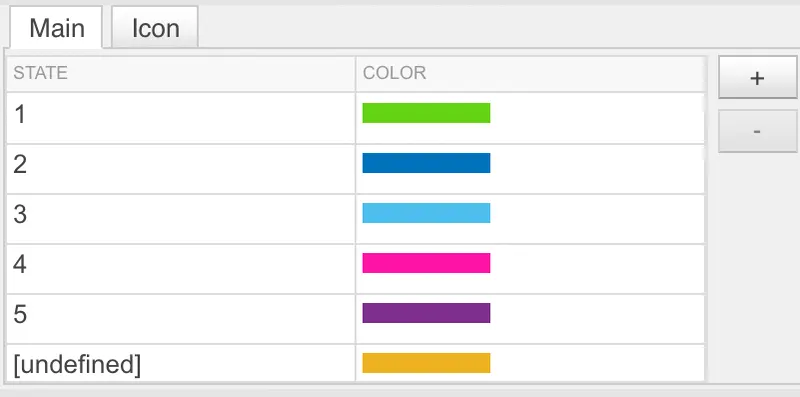
- Each Color in the Indicator is used denote a certain Gear.
- If the system is in ideal condition the Color will be in undefined state.
Graph :
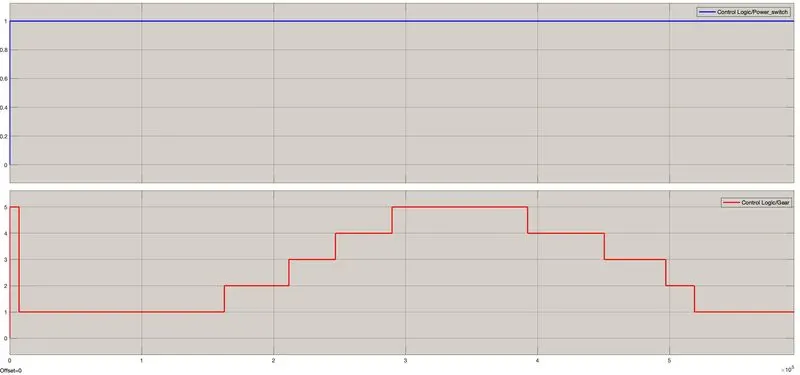
- The Graph is representing the Gear Shifting and also the Control logic Power_supply.
- The Second Graph represent the Gear shifter during the Speed increases.