Week 4.1 - Solving second order ODEs
Aim: Solving second order code.
Objective:
- write a program in Matlab\\Octave that will simulate the pendulam motion.
- write a program that solves the following ODE. This ODE represents the equation of motion of a simle pendulum with damping.
Theory:
- What is simple pendulum
A pendulum is a weight suspended from a pivot so that it can swing freely. when a pendulum is displaced sideways from its resting,equlibrium position, it is subject to a restoring force due to gravity that will accelerate it back toward the equilibrium position.
- Theory of simple pendulum:
A simple pendulum consists of a mass m hanging at the end of a string of length L. The period of a pendulum or any oscillatory motion is the time to go back and forth once.
- Governing equation:
second-order ODE representing the equation of a simple pendulum motion.
In the above equation
- g= gravity in m/s2,
- L = Length of the pendulum in m,
- m = mass of ball in kg
- b= damping coefficient.
- To write a program in Matlab\\Octave that will simulate the pendulum motion, just like the one shown in the start of this challenge.
- We are using,
- L= 1 metre,
- m=1kg
- b=0.05.
- g=9.8m/s2
Function code:
function[dtheta_dt] = ode_func(t,theta,b,g,l,m)
theta1= theta(1);
theta2 = theta(2);
dtheta1_dt=theta2;
dtheta2_dt= -(b/m)*theta2 - (g/l)*sin(theta1);
dtheta_dt= [dtheta1_dt;dtheta2_dt];
end
Input code:
clear all
close all
clc
b=0.05;
g=9.81;
l=1;
m=0.1;
%intial condition
theta0 = [0;5];
%Time points
t_span=linspace(0,10,500);
%solve ODE
[t,results]= ode45(@(t,theta)ode_func(t,theta,b,g,l,m),t_span,theta0);

%Plotting
plot(t,results(:,1))
hold on
plot(t,results(:,2))
ylabel('Plot')
xlabel('Time')

ct=1;
for i=1:length(t)

    %Coordinates of pendulam with respect to angular displacement
    x0=0;
    y0=0;
    x1=l*sin(results(i,1));
    y1=-l*cos(results(i,1));

    %Plotting the pendulum movement.
    plot([x0,x1],[y0,y1])
    hold on
    plot([-1.5 1.5],[0 0],'color','r','Linewidth',3)
    axis([-1.5 1.5 -1.5 0.5])
    plot(x1,y1,'o','MarkerSize',20)
    pause(0.0001)
    hold off
    %Capturing the frames
    M(ct)=getframe(gcf);
    ct=ct+1;
end
%Creating a video file
movie(M)
Videofile=VideoWriter('sec_order_ODE.avi','Uncompressed AVI');
open(Videofile)
writeVideo(Videofile,M)
close(Videofile)
Results:
Output Plot of the above code is shown as:
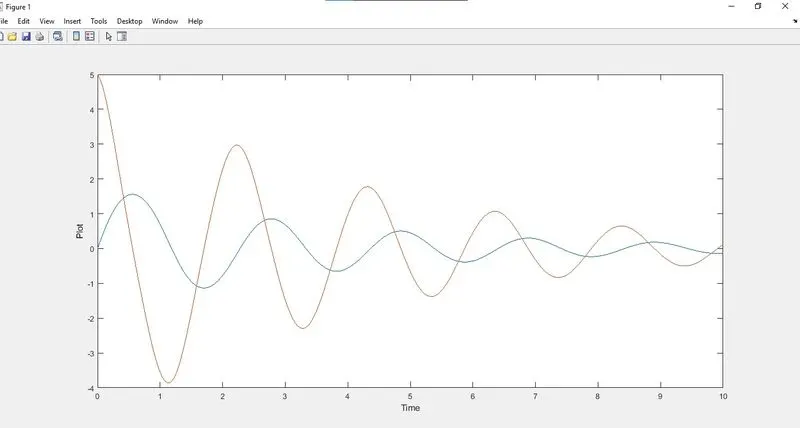
The animated vedio by the result of the code can be found through following link:
https://drive.google.com/file/d/1o1PloLsIborfhStHLPzfmhRNjn9Vtqg9/view?usp=sharing
Error faced while writing the code:
ode_45 was undefined initially so I defined the ode_func to solve this error by calling that function in code after defining it.
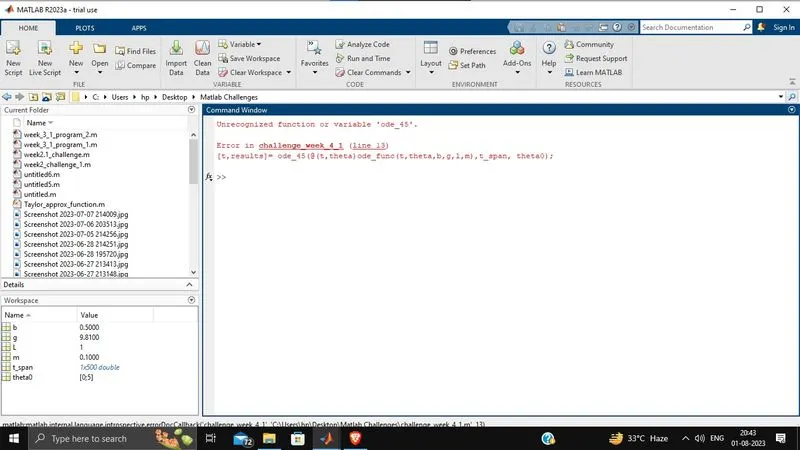
Also faced some basic typo error which was solved by correcting them.