Week 4.1 - Genetic Algorithm
The Genetic algorithm (GA) is an optimization technique used to solve non linear optimization problems.It uses concepts of evolutionary biology
to find the global minima for optimization a problem .An initial set of solutions is tested aganist the objective function. subsequent generation evolve through the processes
1- crossover
2- mutation
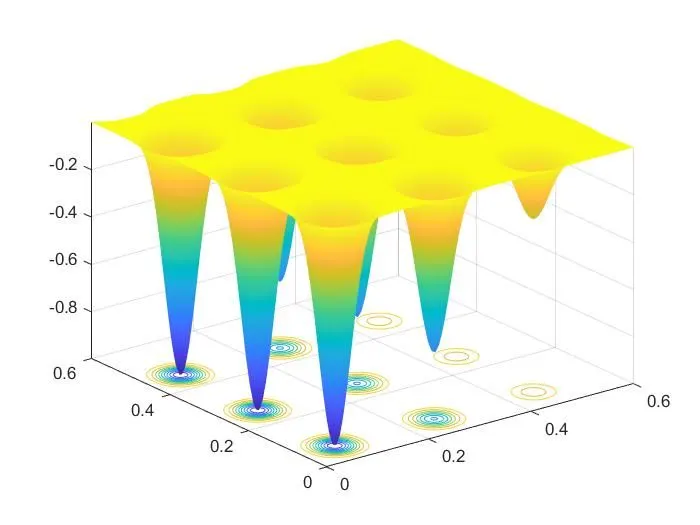
the code for the stalagmite formula
function [f]= stalagmite(input_vector)
f1x = (sin((5.1*pi).*input_vector(1)+ 0.5))^6;
f1y = (sin((5.1*pi)*input_vector(2)+ 0.5))^6;
f2x = exp((((input_vector(1)-0.0667).^2)/0.64).*(-4*log(2)));
f2y = exp((((input_vector(1)-0.0667).^2)/0.64).*(-4*log(2)));
f1 = f1x*f1y*f2x*f2y;
f=-f1;
end
the main code
clear all
close all
clc
x = linspace(0,0.6,150);
y = linspace(0,0.6,150);
[xx yy]= meshgrid(x, y);
for i=1:length(xx)
for j=1:length(yy)
input_vector(1)=xx(i,j);
input_vector(2)=yy(i,j);
f(i,j)= stalagmite(input_vector);
end
end
surfc(xx,yy,f)
shading interp
[x ,fval]= ga (@stalagmite, 2);
x_out(i)=input(1);
y_out(i)=input(2);
case_time_1=toc;
figure(1)
subplot(2,1,1)
surf(xx,yy,-f)
xlabel('x')
ylabel('y')
title('case 1(unbounded)','color','k')
shading interp
hold on;
plot3(x_out,y_out,-fval,'Marker','o','markersize',6,'markerfacecolor','r');
subplot(2,1,2)
plot(-fval);
xlabel('no of iteration')
ylabel('max function value')
tic
for i=1:limil
[input,fval(i)]=ga(@stalagmite_fun,2,[],[],[],[],[0;0],[0.6;0.6]);
x_out(i)=input(1);
y_out(i)=input(2);
end
case_time_2=toc;
figure(2)
subplot(2,1,1)
hold on
surfc(xx,yy,-f)
xlabel('x');
ylabel('y');
title('case 2','color','k')
shading interp
plot3(x_out,y_out,-fval,'Marker','o','markersize',6,'MarkerFaceColor','r');
subplot(2,1,2)
plot(-fval)
xlabel('no of iterations')
ylabel('max function value')
options=optimoptions('ga');
options=optimoptions(options,'populationsize',100);
tic
for i=1:limit
[input,fval(i)]=ga(@stalagmite_fun,2,[],[],[],[],[0;0],[0.6;0.6],[],[],options);
x_out(i)=input(1);
y_out(i)=input(2);
end
case_timer_3=toc;
figure(3)
subplot(2,1,1)
hold on
surfc(xx,yy,-f)
shading interp
xlabel('x');
ylabel('y');
title('case 3','color','k')
plot3(x_out,y_out,-fval,'Marker','o','MarkerSize',6,'MarkerFaceColor','r')
subplot(2,1,2)
plot(-fval)
xlabel('no of iterations')
ylabel('max function value')
options=optimoptions('ga');
options=optimoptions(options,'populationsize',300);
tic
for i=1:limit
[input,fval(i)]=ga(@stalagmite_fun,2,[],[],[],[],[0;0],[0.1;0.1],[],[],options);
x_out(i)=input(1);
y_out(i)=input(2);
end
case_timer_4=toc;
figure(4)
subplot(2,1,1)
hold on
surfc(xx,yy,-f)
shading interp
xlabel('x');
ylabel('y');
title('case 4','color','k')
plot3(x_out,y_out,-fval,'Marker','o','MarkerSize',6,'MarkerFaceColor','r')
subplot(2,1,2)
plot(-fval)
xlabel('no of iterations')
ylabel('max function value')
display(input)